

5 Integrating across species
Populations of related species occupy similar niches in different environments. A big question for environmental physiologists is whether differences in biochemistry and physiology between related species living in different environments derive from physiological acclimatisation (sometimes referred to as phenotypic flexibility), phenotypic plasticity or evolutionary adaptation.
Recall from Section 3.3 how hoopoe larks, wild-captured from the Arabian desert and kept at T a 25°C for just 3 weeks, showed increased body mass, increased food intake and increased BMR in comparison to hoopoe larks kept at 36°C. Clearly, interspecific comparisons of BMR should be designed with the possibility of phenotypic plasticity and/or flexibility in mind.
Comparisons between vertebrate species of similar body mass within a particular taxonomic group but living in different environments have shown substantial differences in metabolic rate, e.g. metabolic rates of some desert mammals are relatively low in comparison with mammals of similar size within the same taxonomic group. The association between food intake, diet and environmental factors can be expressed in deceptively simple terms. Net primary productivity of the environment is determined to a major extent by environmental factors. Plant growth and therefore availability of food for animals is affected by climate, especially rainfall and T a. However, metabolic rates of mammal species living on low-energy diets, e.g. herbivores eating large quantities of fibrous plants, are relatively low, in comparison with species eating foods with high-energy content such as fruits and nuts. Mueller and Diamond (2001) proposed that the low net primary productivity (NPP) of deserts and consequent low availability of food can only support mammals with relatively low metabolic rates. In contrast, relatively high metabolic rates may have evolved in species living in environments with abundant food; they ‘run and idle fast’. BMR can be regarded as the metabolic rate during ‘idling’. Mean field metabolic rates represent the total energy costs of an animal's normal daily activities and rest periods.
To test the hypothesis that there is a direct association between environmental NPP, BMR and FMR, Mueller and Diamond studied five species of deer mice (Peromyscus spp.). They are the most common North American mammals and are found in habitats ranging from Alaska to Central America. The cactus mouse (Peromyscus eremicus) is found in the North American deserts, including the Sonoran and Mojave deserts. It is nocturnal and emerges from its burrow at night to feed on seeds, and occasionally leaves and insects. Other species of Peromyscus live in woodland, the prairies and scrubland (Table 8). The five species selected all have similar diets, but live in diverse habitats of varying NPP. All five species are omnivores that feed on seeds, flowers, fruits and also insects and fungi. Breeding colonies of all the species, obtained from the Peromyscus Genetic Stock Center, were maintained in the laboratory under the same conditions and provided with water and the same diet ad libitum. The mice were kept at 27°C on a 16 h/8 h light/dark cycle. The mice in these colonies had been in captivity for 10–40 generations. Thus any physiological acclimatisation to the environment would have lapsed and selection for adaptation to the natural environment would have been relaxed.
| Species | Body mass/g | Ancestral site | Habitat type | NPP/g C m−2 yr−1 |
|---|---|---|---|---|
| P. eremicus | 22.2 ± 2.8* | Nr Tucson Arizona | Sonoran desert | 48 |
| P. melanophrys | 45.0 ± 6.3 | Zacatecas in Mexico | Yucca/agave desert | 67 |
| P. californicus | 43.5 ± 4.5 | Santa Monica Mts, CA | Chaparral/coastal sage scrub | 340 |
| P. maniculatus | 19.0 ± 1.4 | Nr Ann Arbor, MI | Deciduous woodland and meadow | 600 |
| P. leucopus | 19.1 ± 3.5 | Nr Linville, NC | Deciduous/coniferous forest | 604 |
* ± SE.
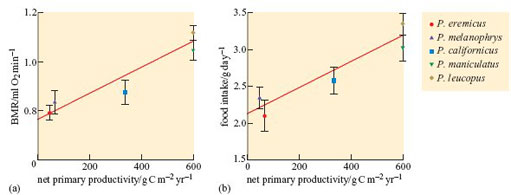
BMR was measured for individual male mice aged 8–15 months during daylight, while the mice were resting and had completed digestion. The dry mass of food consumed, dry mass of faeces produced and body mass of the mice were recorded daily. Values for NPP were calculated for the sites where the founders of the captive Peromyscus populations were collected. Figures 45a and b show, respectively, mass-adjusted BMR and daily food intake plotted against NPP for the five species of mice.
Activity 18
Describe the data in Figures 45a and b.
Answer
There is positive relationship between NPP and BMR. Where the NPP is 50 g C m−2 yr−1, animals have a BMR of about 0.8 ml O2 min−1. As NPP increases to 600 g C m−2 yr−1, animals have a BMR of about 1.1. Food intake also positively correlates closely with NPP. With NPP levels of about 50 g C m−2 yr−1 food intake (g day−1) is around 2.3, rising to around 3.0 when NPP is 600.
Net productivity of each species' habitat of origin, BMR, and total energy intake (the latter equivalent overall to total energy expenditure) differed in the same rank order in the five Peromyscus species.
The data support the researchers' hypothesis that the well-provisioned species had evolved to ‘run and idle fast’. Peromyscus eremicus and P. melanophrys, both desert species, have the lowest values for BMR (the ‘idling’ metabolic rate) and food intake (a measure of FMR). In contrast, two species living in environments with NPP> 600 g C m−2 yr−1 had the highest values for BMR and daily food intake. Peromyscus californicus was intermediate in both BMR and daily food intake. It is important to correlate observations of behaviour of species subjected to physiological measurements and the researchers noted that P. leucopus and P. maniculatus, species with the highest values for BMR and food intake, were jumpy and ready to escape from their cages, biting people who handled them. In contrast, the two species with the lowest food intake and BMR, P. eremicus and P. melanophrys, were docile and easy to handle. It is tempting to interpret the behaviour of the desert species as being geared to saving energy. Mueller and Diamond conclude that food availability determines which species of Peromyscus do best in a particular habitat.
Summary of Section 5
Researchers proposed the hypothesis that the low primary productivity of deserts and low availability of food correlates with low BMR and FMR of desert species. They tested their hypothesis by studying five captive-bred species of deer mice, Peromyscus: two originating from deserts with low NPP, one from chaparral and two from woodland with high NPP. The five species have similar diets, and were fed ad libitum. The desert species, P. eremicus and P. melanophrys, had the lowest BMR and lowest food intake. The two species from woodland, P. maniculatus and P. leucopus, had the highest values for BMR and food intake, while P. californicus from chaparral had intermediate BMR and food intake. This investigation was stringent as all the deer mice were descended from stock that had been captive for 10–40 generations. Therefore, the results could not be explained by phenotypic plasticity or flexibility.