
5.2 Body size and metabolic rate
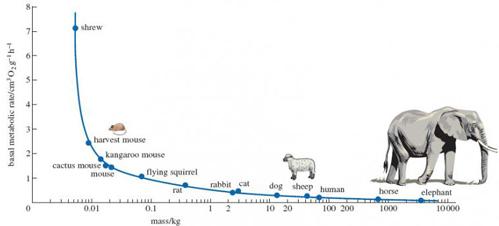
Figure 6 is a slightly more complex graph than those used in S182_1. In particular, the masses of the mammals that are plotted on the horizontal axis vary so much that a normal scale would squeeze together all the small and medium-sized ones, in order to be long enough to get the very large ones on the scale. So, as explained in the figure caption, a logarithmic scale is used here to get them all to fit. In this series of units, you won't come across plots like this very often, so it's not worth spending time struggling at this point to understand what a logarithmic scale means, if you are not familiar with one. You should still be able to read off the values of the plotted points as normal. As a general rule, you should be prepared to 'put to one side' complications like this that are not central to your learning and focus on the key points - here, the relationship between BMR and body mass. Don't forget to check the figure caption and look carefully at the units in which the measurements have been made.
It has long been known that the metabolic rate of mammals is closely related to body size. Look at Figure 6 which shows how BMR decreases in mammals as body size increases. (The way the units of body mass are marked onto the horizontal axis may well be unfamiliar to you, but you should find it possible to use the scale to work out the value of plotted points, most readily those between 1 and 10 and 10 and 100 kilograms.)
SAQ 6
From Figure 6 read off the BMR of the shrew, which weighs around 0.01 kg, and of the sheep, which weighs around 40 kg, and compare the values you obtain. Explain how your comparison relates to the energetic lifestyle of the shrew and what you know about the lifestyle of the sheep.
Answer
A shrew with a body mass of about 0.01 kg has a metabolic rate of about 7 cm3 O2 g−1 h−1. The BMR of a sheep is much lower, about 0.3 cm3 O2 g−1 h−1. You'll know of the very fast pace of a shrew's life from the TV programme, so its high metabolic rate may come as no surprise. High metabolic rates derive from rapid breakdown of food, which in turn requires relatively high food intake. Shrews spend nearly all of their time hunting vigorously for insects and eating them. In contrast, sheep have a slower lifestyle - long periods of rest interspersed with grazing - and have a lower BMR.
The daily food intake of the pygmy shrew reveals just how much a shrew eats; it consumes up to 1¼ times its body weight daily. Shrews need to feed every few hours, otherwise they die. A giant anteater weighing 40 kg would need to eat up to 50 kg of termites per day if it ate an equivalent amount to that taken in by the shrew. However, a giant anteater's average consumption is about 30 000 termites per day. Assuming a body weight per insect of about 0.03-0.05 g, 30 000 termites amounts to about 1-1.5 kg food in total. DA's figures suggest a much higher value for the giant African pangolin's daily intake of insects [p. 58] but even this amount comes nowhere near the shrew's intake, relative to body size.