

4.1 How do people ‘get’ science numbers?
Communicating science through numbers, particularly in the media, is often in the form of simple graphs. Scientists also communicate results in graphical form, so creating and interpreting graphs is a very important skill for a scientist.
When you pick up a newspaper or magazine do you open it and immediately start reading, or do you flick through the pages, pausing at those with images that catch your eye to read those articles first?
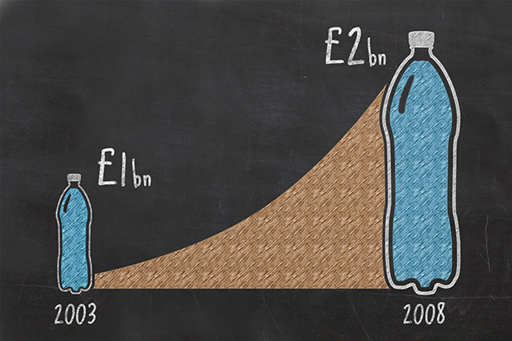
Consider the bottled water video from Week 1. It uses graphs, like the one below, to present science numbers. But is this really a graph or is it just a graphic intended to illustrate the doubling of the bottled water industry?
Numbers are used in articles designed for the public, as well as being an invaluable tool for scientists, economists and many others, not just to present data, but to analyse data and identify patterns and trends.