Watching the weather
Use 'Print preview' to check the number of pages and printer settings.
Print functionality varies between browsers.
Printable page generated Friday, 19 April 2024, 3:27 PM
Watching the weather
Introduction
Measuring and recording the weather is essential for many reasons: to accumulate an accurate record of the past; to provide a picture of what is happening now and a warning of extreme events; and to give the right starting point for predicting the future, in other words a weather forecast. It is also essential to later check those predictions and to improve them. Formal observations have long been recorded at weather stations around the globe and aircraft and satellites are of ever-increasing importance in monitoring the atmosphere. These observations are collated and distributed globally by the World Meteorological Organisation. This course describes how some of these measurements are made and what they can tell scientists about the atmosphere. Meteorology is an observational science and measurements are vital for understanding the weather.
This OpenLearn course provides a sample of level 1 study in Environment & Development
Learning outcomes
After studying this course, you should be able to:
demonstrate general knowledge and understanding of some of the basic facts, concepts, scientific principles and language relating to meteorology and weather forecasting, in particular the techniques used to gather meteorological data
receive and respond to information presented in a variety of ways, including text, tables, graphs, diagrams, computer-based multimedia and websites
begin to understand how to develop personal learning strategies.
1 Recording the weather: from the surface
For well over a century, formal observations of the prevailing meteorological conditions have been recorded at official weather stations around the globe. In the early days the information was chiefly gathered by the military, ever mindful of the risk that even the most carefully devised strategy is at the mercy of short-term changes in the weather. It is hard to imagine that forecasting success rates were high for more than a few hours ahead, so military discipline and scientific curiosity may have been essential for keeping the observation networks going in the early days. In addition to supplying data for forecasting, records of past weather are an important input into climatology.
1.1 What is worth recording?
From an archival point of view it could be argued that it is worth recording anything that changes and that can be reliably measured. If it is not known exactly how to use the data now, a good scientific record might be valuable at a later date. From a practical point of view, the important measurements are those that have a known bearing on events.
Suggest at least six meteorological quantities that are locally measurable and that might form the basis for a scientific weather forecast.
Here is a possible list: atmospheric surface pressure; air temperature; wind speed and direction; humidity; amount of rainfall or other precipitation; cloud amount, height of cloud base and cloud type; visibility.
The quantities just listed are commonly included in reporting of data for meteorological forecasts and/or for climatological archives. Many meteorological reports list extreme values (such as daily minimum and maximum temperatures), temperature averages, and net accumulations of precipitation over defined periods of time. Daily maximum and minimum temperatures are often taken over a 24-hour period starting at 9 a.m. local time each day rather than midnight. This is to avoid dividing each night in half; one very cold night might then contribute minimum temperatures (one at just before and one after midnight) which would appear in the record as minima for two successive days.
A vessel designed to catch precipitation can be emptied at set intervals; the accumulation over a period is simply the depth of water collected over the time interval until the instrument is next checked. (This kind of instrument is called a 'rain' gauge, even if it catches hail or snow rather than rain.) Note that similar accumulations might result if there was a single rain storm for a short period during an otherwise dry day, or a continuous drizzle. Figure 1 shows one example extract of an hourly record from which it is easy to see not only the current weather conditions, but just as importantly, how they are changing. Notice that alongside the pressure reading is an indication that the pressure is falling. You should recognise that, though it may take a few more hourly reports to confirm it, this suggestion of decreasing pressure could be early warning of the approach of a low-pressure weather system.
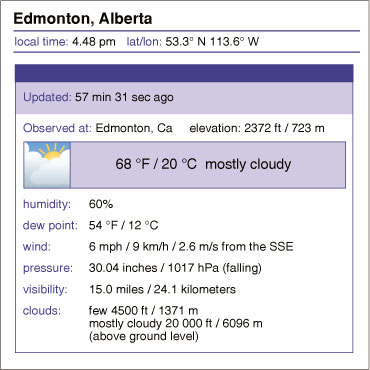
Somewhere between the observations like those recorded in Figure 1 and a weather forecast is a team of professional meteorologists. No doubt among them will be those whose tasks include a consideration of the observers' reports of cloud type, which is a rich source of immediate weather information. It is interesting that few reports available to the general public include the raw information on cloud classification or a realistic measure of cloud extent, although a simple pictogram is often used to describe the cloud cover.
1.2 Weather observations
There is a lot more to taking useful meteorological data than simply reading a handy thermometer. For a start, the measurement instruments must be 'calibrated' and they should be used in specified ways. Calibration is performed to try to ensure that each meteorological variable is measured in a consistent way at every surface site; this is required because weather observations at many sites are needed to feed into a forecast model and to build up a weather chart. These observations are all made using different instruments, which were built at different times and possibly originate from different manufacturers. If one instrument consistently measures a higher or lower reading than others, then false features will be introduced into the record. A similar concern applies when instruments at the same site are replaced: the new instrument should be calibrated against the old, or at least any differences in calibration should be well understood and documented, for the historical weather record to be reliable. Good scientific practice is essential.
As you can probably imagine, there are manuals and handbooks that set out procedures that must be followed as part of a quality assurance approach to gathering meteorological data. This is to eliminate differences in the way that instruments are sited or are read by observers in different regions. For example, thermometers and other instruments should be sited in a ventilated, white box, placed 1.25 m above the ground with a north-facing door in the Northern Hemisphere. This is known as a 'Stevenson Screen' (named after the civil engineer Thomas Stevenson, father of the famous author Robert Louis Stevenson). Recordings should be made at the same time each day and preferably synchronised with other readings around the world.
For the purpose of synchronising events around the globe, some line of longitude has to be defined as a reference for time zones. For historical reasons this was established as a line of longitude passing through a marker fixed to the ground at Greenwich in London. This line is specified as longitude zero degrees and is sometimes called the Greenwich (or Prime) Meridian. By international agreement, time on the Earth was then set relative to a 'noon' or 'midday' as seen from the Greenwich Meridian. This defined 1200 hours 'Greenwich Mean Time' (GMT). From places lying to the east of Greenwich the Sun will be seen to pass its highest point earlier than 1200 hours GMT, which is why progressively earlier time zones are encountered when travelling eastwards. Conversely, places to the west of Greenwich experience the Sun at its highest at progressively later times with increasing longitude. Coordinated Universal Time (abbreviated as UTC) is a timescale that is nowadays defined by the use of highly precise atomic clocks, but is equivalent to GMT for most practical purposes. UTC is the scale used by meteorologists.
The main internationally accepted times for weather observations are 0000 UTC (i.e. midnight) and at six-hourly intervals thereafter, but data are often also taken at several intermediate times, and hourly at many stations.
1.3 Automated weather observation
The collection of most routine meteorological data is something that can be easily automated using electronic instrumentation. Making electronic measurements of temperature is easy - the electrical properties of some materials are very temperature sensitive, as are the tiny, but easily measurable, electrical voltages generated when two different metals are brought into contact. In fact, there are a large number of other 'thermo-electric' effects and experimental scientists will tell you that when the first prototypes for most electronic measuring instruments are built in the laboratory they often respond to changes in temperature more markedly than to changes in the quantity that they were designed to measure. There is an almost equally rich variety of 'piezoelectric' effects (i.e. effects in which changes in pressure generate changes in electric properties) that can be engineered into electronic barometers. Humidity too can nowadays be monitored in the changing properties of simple electronic components. In fact, all of the above instrumentation can be comfortably fitted into a modern digital wristwatch.
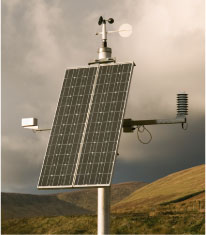
An automated weather monitoring station is essentially a set of electronic sensors linked to a telecommunications channel that need be little more than a mobile phone or a wireless radio link. You may well have seen roadside weather monitoring stations similar to that shown in Figure 2. Routine reports from roadside and, at airports, runwayside, automatic weather stations are important for issuing travel safety alerts.
Several basic weather observations are difficult to automate, though not impossible. However, the smarter the electronic instrument, the more expensive it is likely to be. Suggest two kinds of observation that a person can do with relative ease compared with an electronic system.
You may have thought of things like visibility, cloud cover and, in particular, cloud type. These can all be recorded by trained observers without any instrumentation beyond the human eye, so the electronic world starts at a disadvantage. (A simple, well-placed, live, video camera, though useful, still needs an observer and places higher demands on data transmission.)
1.4 The global perspective
Local observations are a key ingredient in short-term, local weather forecasting but the data from the global network of ground-based observations are also important in setting initial conditions in larger-scale models for longer-term forecasts. Worldwide cooperation on weather can be traced back to 1873. Nowadays, the World Meteorological Organisation (WMO) coordinates the international exchange of meteorological data. In 2007 the WMO was collecting and freely distributing meteorological data from more than 100 moored buoys, 1000 drifting buoys, 7300 ships and around 10,000 land-based weather stations. These surface data traditionally form the basis of weather forecasts, risk assessments and weather warnings around the globe. Figure 3 shows the extent of the global coverage by international weather stations on the surface.
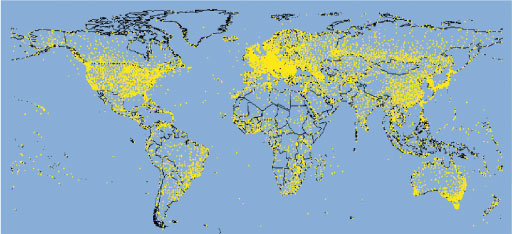
Examine Figure 3 carefully. How does the distribution of surface observation sites on land compare with that of sites at sea?
The distribution of surface observation sites across the globe is not uniform primarily because the oceans are more sparsely covered by observing stations than the land.
Suggest some reasons for the land coverage not being uniform.
The land coverage to some extent reflects a combination of population density and economic factors, with richer and/or more densely populated areas being better represented. Population density also reflects geography; deserts and high mountains are usually sparsely inhabited.
Why is there a relative imbalance in coverage between the Northern and Southern Hemispheres?
The Southern Hemisphere is under-represented in terms of coverage, because compared with the Northern Hemisphere there is relatively little land area - the surface is predominantly ocean.
Activity 1 Meteorological instruments (part 1)
In this course's activities you will study images of many different instruments that are used by professional meteorologists to gather meteorological data and see examples of some of the information that they provide. There are three activities, one for each major section of this course. The first part deals with surface-based instruments.
Open the image bank. You will find that there are 38 images divided into three sub-sections, corresponding to the major sections of this course. The contents of each sub-section is given here.
You can use the search tab in the image bank to find the sub-sections. Clicking on a thumbnail gives you a larger image; to get back to the search results, use your web browser's back arrow. You may view the images in any order, but it is recommended that you open them in numerical order.
Before you start work on this image bank material, read through the study comment below and look at what is asked in Question 1. Then, as you look at the images and read the captions, make notes of any aspects of the measurement platforms that might be relevant to the entries you will make in Table 1.
Study comment
Two of the questions in this OpenLearn free course give you the opportunity to use tables for summarising ideas. Tables can provide a concise way of displaying information, whether quantitative or qualitative. In the case of qualitative information, tables are particularly useful when comparisons are required, as similarities and differences can be picked out more easily from a table than from paragraphs of text.
Like the activities, the questions are split into three (Questions 1, 3 and 5), and allow you to compile your own table of ideas related to the huge variety of instruments that can be used to make meteorological measurements. A phrase often used in this context is 'measurement platform'; this denotes anything (such as a surface station, a satellite or an aircraft) that can carry a number of instruments. The overall task is to compare the relative strengths and weaknesses of different components within the meteorological network as you read through this course and complete the activities.
Question 1
After studying the images in the surface-based instruments sub-section, put a few words into the first row of Table 1 to describe what you see as the obvious advantages and disadvantages of surface stations for making meteorological measurements and observations. You will probably find you want to revise or add to your answer once you have read the following sections and have made the comparison with other platforms, so the answer is given after Question 5 in Section 3.3.
2 Recording the weather: from the top down
The ability to launch artificial satellites has revolutionised the way in which the weather has been recorded over the last 50 years. For the first time, meteorologists have been able to routinely get a view of the whole atmosphere and of the weather systems that it contains.
2.1 The view from space
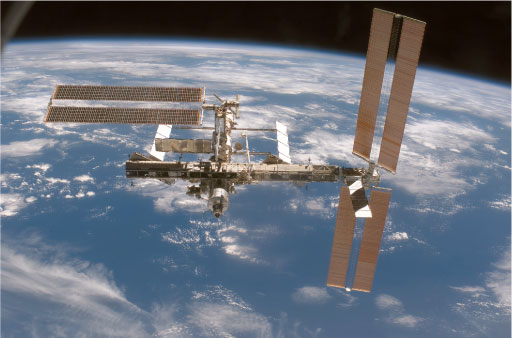
Since the early days of space exploration, 'top-down' weather information has been gathered in increasingly sophisticated ways. Figure 4 gives an impression of the kind of view that can be had on arrival at or departure from the International Space Station (ISS) some 320 km above the Earth. The ISS is just one of a vast number of artificial satellites that have been placed in orbit around the Earth. Box 1 gives some information about the orbits of Earth satellites.
Box 1 Satellite orbits
An object that is in orbit about the Earth (or any other planet) is usually referred to as a satellite. Because a satellite is so far above the atmosphere, there is nothing to impede its motion so it is not necessary to keep the engines running. The duration of a single orbit is called the 'orbital period'. The further away a satellite is from the surface of the planet, the longer it takes to make one complete orbit. Figure 5 shows the orbital periods, measured in days, for orbits at various distances from the centre of the Earth. The horizontal axis is marked in units of the radius of the satellite's orbit divided by the radius of the Earth (which is about 6400 km). A value of 1.0 on this scale indicates ground level. Values smaller than 1.0 do not represent a real situation, since the satellite would be underground!
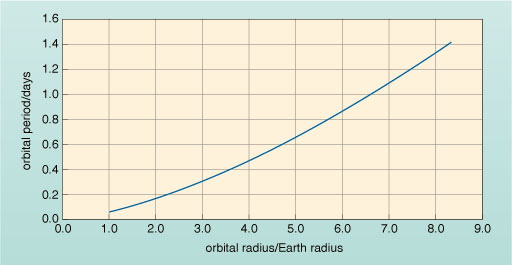
How high above the surface of the Earth is a satellite for which the value of orbital radius/Earth radius = 3.0?
The satellite is placed at 3.0 Earth radii from the centre of the Earth, i.e. 2.0 Earth radii, or about 12 800 km, above the Earth's surface.
What is the orbital period in days of a satellite placed at 3.0 Earth radii from the centre of the Earth?
This satellite would have an orbital period of about 0.3 days.
What is this orbital period (0.3 days) in hours?
0.3 days = (0.3 × 24) hours = 7.2 hours = 7 hours 12 minutes
Detailed information about weather systems can be recorded by satellites and transmitted back to ground stations whenever a convenient receiver can 'see' the satellite. A particularly attractive option is to set a satellite into what is called a polar orbit. The satellite passes over the North and South Poles at a height of 700-800 km (about 0.12 times the radius of the Earth) above the surface. You can see from Figure 5 that the orbital period of such a satellite is more than 0.05 days and less than 0.1 days. In fact it is 0.07 days (or 100 minutes). From this height, cameras can easily see features as small as 1 km across. At the Equator, with a field of view about 2800 km wide, the tracks below successive orbits just overlap. This is because the Earth rotates below the satellite, so that every time the satellite crosses the Equator in one direction it is over a point 2800 km further west than it was at the previous crossing.
The circumference of the Earth at the Equator is about 40 000 km. How many orbits will be required to cover the globe completely?
The number of orbits required is
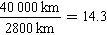
How many hours will it take for the satellite to go through this number of orbits?
Since each complete orbit takes 100 minutes, the time taken to cover 14.3 orbits will be 14.3 × 100 minutes.
This corresponds to
Thus a satellite in polar orbit can photograph the whole globe in one day.
The USA's National Oceanic and Atmospheric Administration (NOAA) operates a pair of polar orbiting satellites like this and even has three 'old series spares' dating from before the turn of the century. The European polar orbiter called 'MetOp' went into service in May 2007 and has a similar weather reconnaissance role.
A more immediate picture of global weather can be had from satellites that sit out among the telecommunication platforms. These are in what is termed a 'geostationary' orbit at 6.7 Earth radii from the centre of the Earth.
According to Figure 5, what is the orbital period if a satellite is placed at 6.7 Earth radii from the centre of the Earth? As seen from a satellite in this orbit over the Equator, how would the Earth appear to move underneath the satellite?
The orbit lasts one day. Provided the satellite lies exactly over the Equator, the disc of the Earth will appear fixed.
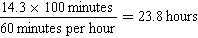
A satellite that is geostationary sits over the Equator and over a single fixed longitude. Looking back at the Earth from a geostationary platform, the disc of the Earth appears very much as a standard football would to you from a distance of 75 cm. You do not need a powerful telescope to get a good view at this range - all you need is a good camera. Figure 6 shows the view from three geostationary meteorological monitoring satellites; images like this are sent back to Earth every hour. Note that most satellite images from meteorological satellites are presented as 'grey-scale', i.e. like black and white photographs. Take some time to study the images and the caption of Figure 6 carefully.
2.2 Observing the Earth in the visible and infrared
Satellites can do much more than just showing us what we would see if we were to be on board. They can also show us things that human eyes could not see. At its best, the human eye sees only what we call light, i.e. visible radiation. The Sun and other warm bodies also emit non-visible radiation, and you will be familiar with other types of radiation such as X-rays. The collective term for all these types of radiation is 'electromagnetic'. Box 2 explains what distinguishes the various kinds of electromagnetic radiation.
Box 2 The electromagnetic spectrum
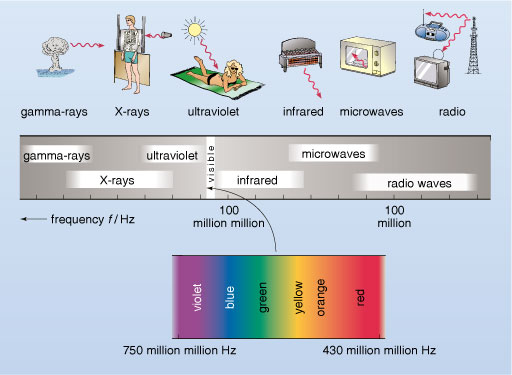
Sunlight is in fact a veritable rainbow or 'spectrum' of different colours that we describe as red, orange, yellow, green, blue and violet. Vegetation appears green because the chemicals within it mostly absorb the other colours, scattering the green light back to our eyes; a cloudless sky appears blue because of all the colours blue light is scattered the most (i.e. its direction of travel is most altered) on encountering very small particles high in the atmosphere; these have much less effect on yellow and red light. If there were no scattering, the daytime sky seen from the Earth's surface would mostly appear dark, as it does at night. From the surface of the Moon, which has no atmosphere, the sky always appears dark apart from the bright illumination from the direction of the Sun.
You may like to try a simple demonstration of light scattering yourself. You will need a torch and a large, straight-sided clear glass. Fill the glass about two-thirds full of water and then add about half a teaspoon of milk (you may need to experiment to get the correct proportions of milk to water). In a darkened room, shine the torch down onto the top of the water. The liquid should appear distinctly blue-ish if viewed from the sides, as blue light is scattered through a large angle by particles in the milk more effectively than the other colours, which travel from top to bottom. The sky appears blue (except when you look towards the Sun or at clouds) due to a similar scattering effect from tiny particles and molecules in the air. Then shine the torch upwards from below the glass and look down from above. You should see a red hue to the light which penetrates directly through the liquid, because the red light is least scattered by the small particles in the milk.
Although the human eye can't see it, the Sun's radiation is spread across a wider spectrum than the visible range (red to violet). There are 'colours' beyond each end of the visible spectrum: beyond the violet end there is ultraviolet (UV) radiation and beyond the red end there is infrared (IR) radiation. The human eye cannot detect UV radiation but bees' eyes apparently can. Most people are aware of UV in the context of sunscreen, because human skin tissue is damaged by UV resulting in sunburn. The human eye cannot detect IR radiation either, but it has been found that snakes' eyes have sensors that do, and the heat that we feel, for example from a glowing fire, is detected by infrared sensors in our skin.
You need to know a little more about radiation emitted by the Sun, by the atmosphere and from the surface of the Earth to appreciate the enormous insight into the weather that can be gained from satellite images. This radiation is described as being 'electromagnetic' because it can be understood in terms of the physics of electricity and magnetism. The physics of electromagnetism describes how electromagnetic radiation transports energy. It can also account for how electromagnetic radiation crosses the empty space from the Sun and stars to the Earth and beyond.
On encountering matter, radiation is transmitted, absorbed and scattered to varying degrees, depending on the chemical and physical nature of the matter. For example, the visible radiation in sunlight is certainly transmitted through panes of window glass, but some is also reflected (or scattered) by the glass, especially when it strikes the pane of glass at oblique angles. Scientifically the process is usually referred to as 'absorption' or 'excitation' if the radiation is converted into heat within the matter, and as 'scattering' if the path of the radiation is changed, but it is not absorbed. So on a sunny day the Earth's surface is heated by absorbing radiation from the Sun, whereas on a cloudy day much of this radiation is scattered back into space before it reaches the ground.
Our physiological experience of colour is just a means of expressing the response of the light-sensitive detector cells of the eye's retina to stimulation by different frequencies of electrical excitation. Red light stimulates these detectors electrically at around four hundred million, million times a second, whereas violet light stimulates them at almost twice that frequency. The way that the visible colours map into the wider electromagnetic spectrum over a broad range of frequencies is shown in Figure 7. The unit of frequency is the hertz (abbreviated as Hz).
The Earth is bathed in electromagnetic radiation from the Sun at a variety of frequencies though visible light is in the frequency range that reaches the Earth's surface most readily. Much of the incoming UV radiation is absorbed by a form of oxygen known as ozone which is most common high in the atmosphere. Some of the incoming visible radiation is reflected from clouds and land masses, but clouds are especially effective at blocking incoming IR radiation, which is also absorbed by atmospheric gases, including water vapour. The absorbed radiation warms the atmosphere, which itself emits IR radiation.
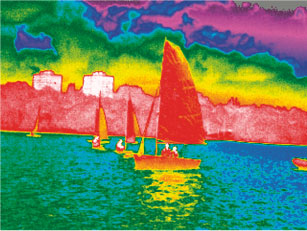
All warm objects emit IR radiation in amounts roughly in proportion to how warm they are. Thus, in complete darkness, the bodies of warm-blooded animals, including humans, can be imaged by IR-sensitive 'night vision' cameras (and by snakes), contrasted against a cooler, inanimate background. Making a camera that 'sees' IR radiation is not difficult in the digital age. Even the cameras built into many consumer electronic devices (such as some mobile phones and laptop computers) do so, though they are not specifically designed for this purpose. An IR image is shown in Figure 8.
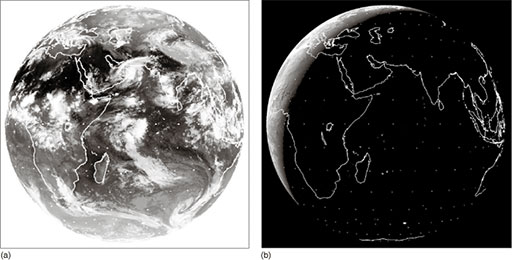
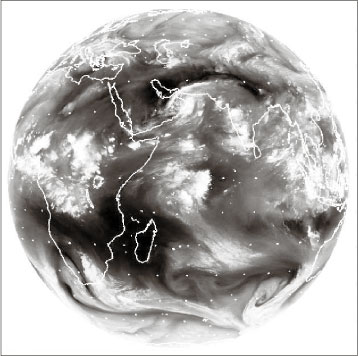
Both the Earth and its atmosphere emit IR radiation, a significant fraction of which escapes out into space, especially when skies are clear. As a result, IR cameras, mounted on satellites and looking back at the Earth, are extremely useful for weather observation on a global scale. Figure 9 shows IR and visible images from Meteosat-7, above the Indian Ocean. Unlike the artificial colour representation of Figure 8, the IR image of Figure 9 is presented as a grey-scale picture. This is normally the case for IR as well as visible images from meteorological satellites (compare with Figure 6). On the day shown in Figure 9, the Sun set at 6.19 p.m. local time in Kolkata, which is 5.5 hours ahead of UTC, so the Indian night was around half-way through at the time the image was taken. The visible image, Figure 9b, confirms that at the time most of the view was in darkness. The IR image of Figure 9a, on the other hand, shows lots of detail.
In a conventional black and white photographic print, what is represented by the light to dark contrast?
The lighter parts of a black and white picture come from the brighter surfaces of the scene being photographed - highlights and reflections are lightest; shadows and shade are darkest.
The conventional arrangement for 'black and white' photographic prints uses a positive image that looks recognisably similar to the real full-colour scene, whereas negative images reverse the contrast. Meteorological IR photographs are presented as a negative image: the darker regions correspond with the IR-emitting (i.e. warmer) surfaces and lighter tones tell of much reduced IR emission, i.e. relative coldness.
What colour does the view of space outside the disc of the Earth appear in the two images in Figure 9?
Space appears black in the visible, but white in the IR image.
Space is the coldest part of the image, being around 290 Celsius degrees colder than the average temperature of the surface of the Earth (which is around 15 °C).
What is the coldest thing visible within the Earth's disc in Figure 9a?
The cloud tops, which appear very light grey or white.
What is the warmest thing visible within the Earth's disc in Figure 9a?
The very dark-coloured land visible in the Sahara region of North Africa and in the Arabian Peninsula.
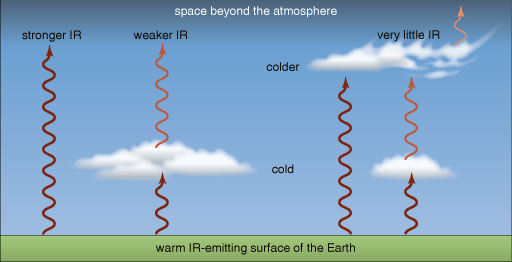
Land and sea surfaces are heated during the day and cool down at night but their temperature stays above 0 °C at low latitudes and they remain significant emitters of IR throughout the night-time. Clouds form in cold air and, in general, the higher the clouds are, the colder must be the tiny droplets and ice particles of which they are made; cloud tops are much colder than 0 °C and are not strong IR emitters. The whitest clouds in the IR image in Figure 9a are therefore also the highest. Lower-level clouds, which are more prevalent in mid-latitudes in this image, are a mid-grey tone. Figure 10 shows the relative amounts of IR radiation emitted by the Earth's surface and clouds.
In Figure 9a you should now try to identify the following features.
- The cold, high cloud over most of India, where the image is very light. The IR emission from the land is absorbed by the cold, high cloud and all the camera registers is the small amount of emission from the top of the cold clouds.
- A band of clearer skies that extends over North Africa, Saudi Arabia, Iraq, Iran, Afghanistan and Tibet, where the darkness of the image shows strong IR emission from warm land masses.
- The very sharply defined northern edge to the cloud-free region just to the north of India that corresponds with the Himalayan range.
- A region of cold, high cloud near the bottom of the Persian Gulf. This is partially veiling lower cloud spiralling anticlockwise in a (Northern Hemisphere) low-pressure system.
- A (Southern Hemisphere) low-pressure weather system in the Southern Ocean, at the bottom right of the image, with the cloud spiralling in a clockwise direction.
In general a rich variety of weather patterns can be read from an infrared global image, traced in layers of cloud even, as you have seen in Figure 9, when the picture is taken at night. A yet more vivid impression of developing weather can be seen in a sequence of successive images. Meteorologists can make use of sequences of cloud images to measure the wind speed and direction in the atmosphere at levels where clouds are present. Video clips of this nature make fascinating viewing.
Study comment
The following question gives you another opportunity to use a table layout to summarise and compare qualitative information.
Question 2
The top two rows of Table 2 show how various types of area visible in satellite images interact (or don't) with sunlight, and whether they emit IR radiation. These rows have been partly completed. Fill in the empty boxes. (You may find Figure 10 is helpful.) The bottom two rows of the table categorise the grey-scale visible and IR images captured by satellites. These rows have also been partially completed. By referring to your entries in the top two rows and to Figures 6 and 9, fill in the remaining empty boxes.
Answer
The completed table shows all the boxes completed.
| Ocean | Land | Low-level clouds | Very deep clouds | Space | |
| Interaction with sunlight | Absorb sunlight | Scatter sunlight back into space | No scattering or absorption of sunlight | ||
| Emission of IR radiation | Radiate IR strongly upwards into space | Radiate very little IR | No radiation of IR along satellite line of sight | ||
| Visible image (positive) in daytime | Black | Various shades of grey | Pale grey | White | Black |
| IR image (negative) | Black | Mostly very dark | Grey | White | White |
The water vapour in the air, as well as the droplets from which clouds are formed, absorbs radiation particularly effectively over a range of frequencies that lie within the infrared part of the electromagnetic spectrum. By looking at the detail of the IR spectrum passing through the atmosphere to a satellite, and by comparing absorption at individual frequencies, it is possible to make a good estimate of the total amount of water and water vapour along any line between a point on the surface of the Earth and the satellite. Most of the water is in the lowest 10 km or so of the atmosphere. Figure 11 shows a 'water vapour image' for the same time as Figure 9, with increasing brightness corresponding to higher water vapour content and darkness indicating dryness.
What is shown in the water vapour image of Figure 11 at locations where the IR image of Figure 9a shows thick cloud cover? (Hint: look particularly at central and southern Africa.)
Figure 11 shows large quantities of water vapour over the regions where cloud cover can also be deduced from the IR image.
What is shown in the water vapour image, Figure 11, where the IR image, Figure 9a, shows little or no cloud cover? (Hint: look at the central Indian Ocean.)
The water vapour image also detects diffuse regions of moist air between the bright, thick cloud regions of the IR image.
As a result of absorption and emission of radiation at other IR frequencies, often by carbon dioxide gas, it is also possible for scientists to measure temperatures within the atmosphere, not just at the cloud tops. This is done by a careful calculation of the amount of IR radiation expected to be seen at a whole series of frequencies for a particular distribution of temperatures all the way along the line of sight. That distribution of temperatures is then adjusted until the IR spectrum predicted from it matches the one observed by the satellite, to within a reasonable tolerance. This laborious calculation is repeated for every point where the satellite makes an observation. Measuring a quantity of real interest (e.g. temperature) using a remote measurement of another quantity (e.g. IR radiation at various frequencies) can be challenging, but is vital across a range of scientific disciplines ranging from studies of the Earth's core via earthquakes to medical scanning of the human body.
2.3 Comparing with the view from the ground
So, how does the view from space correlate with the charts of the weather that meteorologists can construct from surface observations? The answer is 'remarkably well'. A geostationary satellite sees higher latitudes increasingly foreshortened owing to the curvature of the Earth's surface. However, image processing experts can tilt and distort the image so that it appears to be taken from overhead. Figure 12 shows both the full globe in the IR, as seen from the MTSAT geostationary satellite, and a reprojection of the same image in the region of Australia and New Zealand, suitable for weather reports in that region. This image was taken at 0630 UTC on 19 February 2008.

There is a bright white, circular region of cloud lying just off the northwestern coast of Australia in Figure 12b, in the centre of a spiral pattern. Why does this cloud appear whiter in the image than the band of cloud over the ocean to the south of Australia?
This cloud surrounds the centre of tropical cyclone Nicholas, a region of strong upward motion. The cloud tops are high, and consequently cold, and so the clouds emit little IR radiation and appear white in the IR image. The clouds over the Southern Ocean are associated with a front. The cloud tops here are lower in the atmosphere, warmer and so appear greyer in the image.
The more complex features are not always easy to interpret. However, you should be able to imagine the potential of a sequence of images like this to inform meteorologists of likely developments.
Satellite measurements are described as 'remote', since the instrument is not placed within the atmosphere that it is observing, but instead it measures an electromagnetic spectrum at a distance from its target. From this spectrum, scientists are able to infer the most likely temperatures or water amounts which fit the observed radiation, but they are not directly measuring the physical quantities in which they are interested. Remote measurements are thus different in nature from the type of surface station measurements already discussed in Section 1, and a check against 'ground truth' is always of particular importance for satellite measurement. For example, a check might be made by comparing a surface temperature inferred from a satellite measurement with a direct measurement made using a thermometer on the surface at the same location and time. Satellite instruments must also be monitored in case they degrade with time.
2.4 Observing at other frequencies
All of the satellite images you have seen so far, and most that you will find in the image bank, are made using either visible or IR radiation. However, these are not the only frequencies that can be used for meteorological measurements.
Higher frequencies from the blue end of visible light to UV are used to measure and to map gases that absorb in that region of the spectrum, notably ozone. Lower frequencies, including microwaves, also have observational uses. You have already seen that neither visible nor IR radiation penetrates through thick clouds, a fact that can be used to good effect to image cloud tops in the IR. Radiation at lower frequencies is much less strongly scattered by small particles; you would not expect a radio signal to be blocked by clouds or fog. In the microwave region of the spectrum, all clouds, except the thickest cumulonimbus, also appear transparent. A sensor that operates at microwave frequencies can therefore 'see through' clouds and fill in parts of the atmosphere and surface that are invisible to a satellite observing in the IR.
2.5 Where to see satellite images
Satellite images are a common part of TV and internet weather forecasts, especially the time sequences of hourly satellite images issued by national weather agencies. They provide a unique synopsis of the situation within the last few hours and in combination with other weather data they provide the starting point for the forecast. Rapid dissemination of this 'current/latest' information is vital, so that meteorologists can make a swift visual assessment of the next few hours covering a wide region.
The data from satellites are transmitted by radio signals to various ground stations from where they are fed to the WMO for sharing around the globe. Archives of images extending back several years can be accessed via the internet.
Activity 2 Meteorological instruments (part 2)
Now study the images in the 'Satellites' sub-section in the image bank to see how sequences of images from geostationary satellites show the development, movement and decay of various weather systems. Make notes of any aspects of the satellite images that might be relevant to the entries you will make in Table 1.
Question 3
Revisit Table 1 and put a few words in the second row to describe some advantages and disadvantages of satellites for meteorological observations. You will be able to check the answer when you have completed the whole table.
Question 4
Explain briefly why:
- a. polar orbiting satellites are not as convenient as those in geostationary orbit for providing sequences of weather images at frequent intervals;
- b.the highest latitudes are poorly served by geostationary satellites (for instance, look at what Figures 9, 11 and 12 can tell you about weather in Antarctica).
Answer
- a.A polar orbiter takes around a day to map the full globe, whereas a geostationary satellite sends back images of the same fixed view centred on a specific longitude every hour.
- b.The geostationary view is severely foreshortened in the polar latitudes - so much so that Antarctica cannot be seen with any detail.
3 Recording the weather: filling in the middle
There is a sophisticated network of surface observation stations that can catalogue what occurs at ground level, at least over land, and an array of geostationary satellites that look in from above. Between them, these systems furnish a valuable range of data on the current state of the weather and the way it is changing, but quite a lot is missing.
Winds above ground level and the nature of air masses are key to the development of local weather. Ground-based and satellite observations of clouds can be used to infer the wind directions and nature of the air masses - interpreting sequences of images in this way is an essential skill for a meteorologist. However, even for the skilled, there are blind spots: little can be inferred about winds where there are no clouds tracing out the airflow; there are few surface observations made over the oceans, where weather systems may be developing; and geostationary satellite data are not useful for monitoring weather at high latitudes (although satellites in polar orbit are more useful in these regions).
There are two more ways to gather data from the bulk of the atmosphere. The first is to get a set of instruments up there and make measurements; the second is to probe it from the ground.
3.1 Radiosondes
Hot-air balloonists care a great deal about how the wind changes with height. It offers them their only means of steering. The launch is a particularly critical phase in ballooning as there is precious little room for manoeuvre, so just before committing to a launch the pilot usually arranges for a brightly coloured, helium-filled balloon to be released. As it rises it traces the local air movement giving a vivid impression of how the wind speed and wind direction vary with height.
Why is it possible to have a stable atmospheric environment in the troposphere, where the air temperature is observed to fall by about 5 °C per kilometre as height increases, in apparent contradiction of the 'hot air rises' maxim?
Air from lower in the troposphere, although warm when at its original level, would cool to a lower temperature and so become denser than its surroundings if it were raised.
This situation is indeed stable, unless the temperature falls by more than about 10 °C per kilometre for unsaturated air. Only if the temperature falls with height even more rapidly than 10 °C per kilometre, would any rising air still be warmer than its surroundings, even after cooling, and continue to rise. In that case, convection would cause the warmer, lower air to rise until the overall change of temperature with height is such that the atmospheric environment is stable.
A balloon filled with air tends to sink because of the weight of the skin of the balloon and because of the weight of the extra air blown into it in order to inflate it. A soap bubble appears a great deal more buoyant as its skin is relatively light and very little extra air is used in its inflation, but unless caught on an upward-moving air current a soap bubble also sinks. Balloons filled with helium or hot air on the other hand tend to float upwards. The reason is that they are inflated with gases that are less dense than the surrounding air. If the total weight of skin and gas is less than the weight of surrounding air that would otherwise occupy the same space, then it inevitably follows that the balloon will float upwards.
From the start of systematic weather observations in the mid-nineteenth century it was recognised that data from above the ground would be useful in predicting how the weather might develop. Putting a thermometer and a barometer on a kite was easily done, though reading them was more of a challenge. By stacking many kites, or using a hot-air balloon, it was possible to generate enough lift to get a person aloft in a basket complete with instruments and record book. But, as you might imagine, this was not the basis for routine observation.
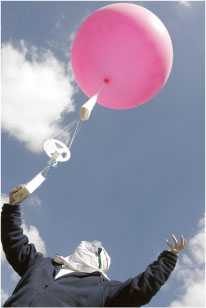
The practical solution to probing the atmosphere with airborne instruments is to carry them on a helium-filled balloon large enough also to carry a radio transmitter and its power source. This arrangement is called a radiosonde ('sonde' is a French/international word meaning probe). The weight and value of the instrumentation posed serious challenges before the advent of microelectronics in the latter half of the twentieth century, but today the radiosonde is virtually a disposable automatic observation system, with the investment in the recovery of instruments being driven as much by tidiness as by economy. A modern radiosonde is shown in Figure 13. Radiosonde balloons will normally reach an altitude of about 25-30 km (i.e. into the stratosphere), at which point the balloon expands so much that it bursts. A small parachute then slows the descent of the instrument payload to prevent impact damage on landing. During its flight a radiosonde transmits data on temperature, pressure and humidity for 90 minutes or so. The balloon itself can also be tracked to map wind speed and direction; nowadays this is often done by an onboard Global Positioning System (GPS).
There are more than 800 sites around the world that launch radiosondes daily at 0000 and 1200 UTC and, as with other meteorological observations, radiosonde data are shared through the WMO.
3.2 Precipitation radar
The water droplets from which clouds are formed are typically in the range of a thousandth of a millimetre to a tenth of a millimetre in diameter and are widely dispersed. Raindrops on the other hand are much larger, typically 1-2 mm across. Regions of the atmosphere through which rain is falling contain markedly more water than an equivalent volume of cloud. As a consequence, a region of falling rain presents a more significant obstacle than a cloud to anything passing through it.
The word 'radar' is an acronym for 'RAdio Detection And Ranging'. Radar works by sending out a pulse of electromagnetic radiation and timing how long it takes for a portion of the signal to return as a result of reflections from objects encountered along the path. The delay time between the main pulse and its echo determines the distance between the target object and the radar station. The delay time is three-millionths of a second per kilometre and, although that sounds like a short time, it is easily possible to determine the distance between the emitting source and the reflecting object to within one metre.
The strength of a radar echo depends on two factors - how far away the target is and what it is made of. Strong radar echoes are created by dense, nearby objects whereas echoes from very small remote objects are easily 'lost in the noise'. If you were spotting distant aircraft by radar, you might try turning up the receiver only to be frustrated by finding that faint signals from distant objects get lost in what is known technically as 'clutter'. This is the radar equivalent of the hiss you hear on audio systems. Among the various contributions to clutter is rainfall.
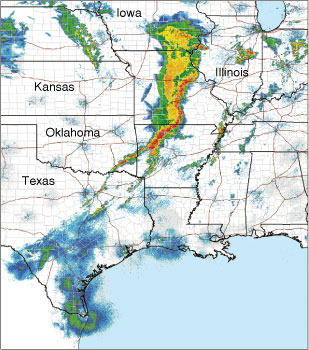
Most developed countries operate radar networks to detect precipitation. By comparing the strength of an echo with the delay time (which effectively gives the distance) precipitation radar will provide estimates of the rates of rainfall; the larger the raindrops detected, the stronger the return signal. This is especially valuable in warning of imminent flooding as the radar images give a clear indication of the intensity of the rain.
A single radar station can be expected to detect the presence of rain within a radius of 100 km or so. The network is planned to give appropriate coverage with overlapping areas. A complete scan of the skies around each station takes a few minutes, so typically data are updated every 10-30 minutes. The precipitation radar coverage of the stations operated over part of the USA is shown in Figure 14.
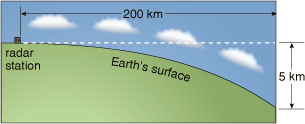
The curvature of the Earth over the range of precipitation radar is significant: because a radar beam is straight, the beam effectively climbs away from the Earth's surface with increasing distance from the radar station. The geometry is illustrated in Figure 15. At a distance of 50 km the radar simply cannot 'see' lower than about 0.5 km and by 200 km from the radar station the minimum height for detection by radar is almost 5 km. At 200 km range, a great deal of rain will therefore go undetected below the beam.
Determining the lateral speed of movement of a patch of rain can be done in two ways. The simplest is to track the rainfall and to compare its position at successive times, a few minutes apart. An even more immediate measure can be obtained from technology that works like the radar speed traps designed to identify speeding motorists. In this kind of device, the exact time difference between the reflections of successive radar pulses is measured electronically, and from this the speed of the reflecting object can be calculated. Thus rainfall radar gives a means of assessing wind speed at the cloud base, from the ground, without the use of radiosondes. Better still, thanks to the ingenuity of the instrument engineers, meteorologists can pick out radar reflections from patches of turbulence and dust in the air, so air movements can be 'read' from the ground even when it isn't raining! For this reason, radar is especially valuable for detecting.
3.3 Aircraft
Just as the oceans are relatively poorly sampled by surface stations, except for some buoys and weather stations mounted on ships, the air above them is even more difficult to access for direct measurements. Radiosonde ascents are normally made from land-based sites and radar techniques have a range of only about 100 km away from the coasts. The advent of satellites has made a huge impact on observations for ocean regions, where weather systems may develop otherwise almost unobserved until they reach land. Not everything, however, can be observed remotely and local, direct measurements are still needed, particularly of winds and other features too small to be sensed easily from orbit.
One valuable source of information derives from commercial air-traffic. Most large aircraft carry some meteorological instruments and report data back to meteorological centres. In fact, it is very much in their interests to do so. There are clear safety issues connected with visibility, pollutants, clouds and precipitation, turbulence and wind gusts. Airlines also have a particular interest in the position and strength of winds in the middle and upper troposphere; they can save enormous amounts of fuel by tailoring long-distance routes to make best use of tail winds and to minimise head winds in the meandering jet streams.
Aircraft reports are naturally concentrated in the main air-traffic lanes, but there are a handful of specialist meteorological research flights around the world. These do not participate in routine weather reports, but can instead be targeted on individual phenomena, such as clouds of a particular type or large storm systems, and used to make detailed observations.
Activity 3 Meteorological instruments (part 3)
Now study the images in the 'Balloons, aircraft and radar' sub-section of the image bank to learn a little more about some of the instruments that are used to gather meteorological data at various levels in the troposphere. Make notes of any aspects of the satellite images that might be relevant to the entries you will make in Table 1.
Question 5
Revisit Table 1 and put a few words in the third row to describe some advantages and disadvantages of radiosondes and aircraft for meteorological observations. Now you have read the whole OpenLearn free course and completed Activities 1-3, you may also see some more comparative advantages and disadvantages of surface stations and satellites. If so, add these to the table.
Answer
The completed table shows some suggested advantages and disadvantages of various meteorological observing systems. You may well have thought of others. You may have used single words or shorter phrases to express ideas.
| Measurement platform | Advantages | Disadvantages |
|---|---|---|
| Surface stations | Cheap to build Easy to maintain Direct measurements with relatively simple instruments | Mainly concentrated in populated regions of land Restricted to near-surface measurements Concern whether measurements at different sites are made consistently |
| Satellites | Global coverage Rapid access to images recorded at the same time but at different frequencies Top-down viewpoint | Indirect, remote measurements Expensive to build, launch and operate Limited weight and power supply for instruments |
| Radiosondes and aircraft | Direct measurements made in the atmosphere Instruments can be manually operated (aircraft) Less restricted in weight and power than satellite instruments | Limited coverage and altitude range Restricted number of launch sites for radiosondes Aircraft limited to commercial routes or a few research flights |
Conclusion
- There is a large international network of surface observation stations that record, among other things, air temperature, humidity, pressure, wind speed, wind direction, cloud type, cloud cover and precipitation.
- Satellites provide global, or at least hemispheric, coverage, from either polar or geostationary orbits, using remote instruments which operate at various frequencies in the electromagnetic spectrum.
- To complement surface data and observations from space, data from within the atmosphere itself can be gathered by radiosondes, aircraft and by radar.
- The collation and distribution of atmospheric data is coordinated by the World Meteorological Organisation.
Take the next step

If you enjoyed this course, why not explore the subject further with our paid-for short course, Science: the weather?
Acknowledgements
Course image: Alejandro Erickson in Flickr made available under Creative Commons Attribution-NonCommercial-ShareAlike 2.0 Licence.
The material acknowledged below is proprietary, used under licence and not subject to Creative Commons licensing. See terms and conditions. Grateful acknowledgement is made to the following:
Figure 1: © Royal Meteorological Society; Figure 2: Realimage/Alamy; Figures 3, 14: courtesy NOAA; Figure 4: © NASA; Figures 6, 9, 11: courtesy NERC Satellite Receiving Station, Dundee University, Scotland, www.sat.dundee.ac.uk; Figure 8: Tony McConnell/Science Photo Library; Figure 12: © Australian Bureau of Meteorology; Figure 13: Michael Donne/Science Photo Library.
MI001: © The Royal Botanic Garden Edinburgh; MI002: © The Open University, by permission of The Radcliffe Observer; MI003-009, 011, 012, 014-016: © The Open University; MI010: courtesy Royal Meteorological Society; MI013: Dawkeye/at Leicester Aero Club/Flickr Photo Sharing; MI017: © NOAA; MI018: © Misje Rederi AS; MI019-030: © 2007 EUMETSAT; MI031-033: © NASA; MI034, 036: © Vaisala; MI035: British Antarctic Survey/Science Photo Library; MI037: © BAES Systems 2003; MI038: courtesy Swedish Meteorological and Hydrological Institute.
This OpenLearn free course was adapted from a course that was produced in collaboration with the Royal Meteorological Society.
Don't miss out:
If reading this text has inspired you to learn more, you may be interested in joining the millions of people who discover our free learning resources and qualifications by visiting The Open University - www.open.edu/ openlearn/ free-courses