You and your money
Use 'Print preview' to check the number of pages and printer settings.
Print functionality varies between browsers.
Printable page generated Friday, 19 April 2024, 6:08 PM
You and your money
Introduction
This OpenLearn course provides a sample of level 1 study in Business & Management, and Social Sciences.
Learning outcomes
After studying this course, you should be able to:
demonstrate a knowledge of the structure of the financial services industry and the role of financial liberalisation in shaping this industry
understand the basics of debt and interest
appreciate different forms of unsecured lending
apply the financial planning model to the borrowing process.
1 Debt
Of all the aspects of household finances debt has, in recent years, been the most controversial and widely talked about. Personal debt has become a part of everyday life and, as a result, discussions about it regularly make the headlines. Even the Archbishop of Canterbury has made public statements about the level of personal indebtedness in the UK (The Times, 2008)! Debt is regularly featured in the media with stories about how much people have borrowed, how a proportion of borrowers encounter difficulties in making repayments, and how extortionate rates of interest are charged on some forms of debt.
In 2010, the amount of personal debt owed by UK citizens exceeded the staggering figure of £1.46 trillion (Bank of England, 2010a). This total had increased threefold from the level in 1995 – although the growth of debt stalled during the financial crisis that began in 2007. As Box 1 highlights, 2007 proved to be a pivotal year for personal debt. In the preceding years, the growth in personal debt helped to fuel a consumer boom and a rapid rise in house prices. After 2007, the economy moved into recession and house prices fell as the volume of new lending contracted.
Box 1 The financial crisis
Emanating from the global financial crisis that began in 2007, the phrase ‘credit crunch’ entered the media in 2007 and has subsequently been virtually ever-present in discussions about personal borrowing. During this period banks found it difficult to raise funds from the financial markets to support their lending business. This difficulty arose due to concerns about the solvency of many banks – concerns that ultimately were borne out when the US investment bank Lehman Brothers collapsed in September 2008 and later when governments were forced to rescue several banks around the world. In the UK, both the Royal Bank of Scotland (RBS) and Lloyds Banking Group – after it had acquired the near-insolvent Halifax Bank of Scotland (HBOS) – were provided with billions of pounds of financial support and consequently became owned by taxpayers. Under these circumstances the banks chose to cut the amount of lending with the result that households and businesses found it increasingly difficult to obtain loans. High salaries and large bonuses, however, remained. Unsurprisingly, the financial crisis resulted in stalling the growth of personal debt. For example, between 2007 and 2009 the growth in total personal debt virtually came to a halt.
Everyone who has a mortgage, a personal loan or who owes money on a credit card contributes to this total of personal debt – although the greatest proportion by far relates to mortgage debt.
This course explores several of the issues relating to personal debt in detail. Section 2 looks at the evidence on the level and distribution of personal debt in the UK – including the factors that resulted in the rapid expansion of debt until the late 2000s. Section 2 also examines the changing social and economic context and how this has impacted on personal debt levels. Section 3 explores the costs of having debt, and Section 4 considers the relationship between debt and household finances. Finally, Section 5 investigates the process of borrowing, and explains why the gathering of information and making informed decisions about taking on debt is an important part of financial capability.
2 Exploration of debt
2.1 Debt: concepts and evidence
Let’s start by examining exactly what is meant by ‘debt’. You may be familiar with the concept of assets and liabilities. Assets are things that people own at a point in time. By contrast, a debt is a liability. Liabilities are effectively the opposite of assets: they are amounts, or stocks, of money that people owe at a particular point in time. Typically, this would include mortgages; personal loans; outstanding amounts on hire-purchase agreements; credit card debts; and bank overdrafts. If, at the point of time that you read this course, you owe money in any of these ways, then you have a liability for that amount. Liabilities can also include money owed on items such as utility bills and Council Tax bills (a situation often referred to as being ‘in arrears’), although these are not included in the Bank of England’s calculation of the £1.4 trillion of personal debt.
Having an understanding of both assets and liabilities is an essential part of financial capability. By comparing assets owned with liabilities owed, you will be able to look at concepts such as net worth (also referred to as ‘net wealth’), or the value of all assets minus the value of all liabilities.
In this course, we’ll be concentrating on looking at debt in some detail. Let’s start by briefly considering the terms which are often used to talk about debt: ‘borrowing’, ‘debt’ and ‘credit’. The term ‘borrowing’ is frequently used to describe the process by which debt is taken out, and is also the amount that is taken out in any one time period, such as ‘I borrowed £10,000 this year’. ‘Debt’ is, strictly speaking, the total amount of money owed at a particular point in time – if you borrowed £10,000 this year and £10,000 last year, then you could say that you now have £20,000 of debt (although in reality the figure would have changed due to interest and repayments). Confusingly, ‘borrowing’, in popular usage, can also be used to express the total amount outstanding, as in ‘I have £20,000 of outstanding borrowing’. Sometimes, the distinction is that ‘debt’ is used to imply a less voluntary situation, whereas the term ‘borrowing’ is often used when the debt has been undertaken voluntarily, such as when taking out a mortgage. What is crucial here is that the amount – whether one refers to it as ‘outstanding borrowing’ or simply ‘debt’ – is still a liability. To keep things simple, we will primarily use the term ‘debt’ in this course, with ‘borrowing’ describing the process by which debt is taken out.
The third term that you’ll see or hear in the media is credit, defined as an arrangement to receive cash, goods or services now and to pay for them in the future. It has been argued that there is a rather subtle distinction between debt and credit, which has been described as follows: ‘Debt is the involuntary inability to make payments which the payee expects to be paid immediately, as opposed to credit use, which can be characterised as agreed postponement of payment’ (Furnham and Argyle, 1998, p. 113). So debt can have the sense of being more involuntary than credit – and debt is traditionally associated with debt problems, which we shall be looking at later in this course. It is perhaps not surprising that the part of the UK financial services industry concerned with lending money is known as the ‘credit industry’ rather than the ‘debt industry’. However, the crucial point – just as with the distinction between debt and borrowing – is that an amount owed at a particular point in time, no matter how it has arisen, is a liability.
Some 85 per cent of the UK’s £1.46 trillion of personal debt in 2010 is accounted for by mortgages. Debts such as these are known as secured debt, meaning that the amount owed is secured against assets – in this case houses – which can be ‘repossessed’ and sold by the lender if repayments are not made by the borrower. Debts that are secured on housing are known as mortgages. Other types of debt are known collectively as unsecured debt. In 2010 these represented some £220 billion or 15 per cent of the total (Bank of England, 2010a). Unsecured debt includes money owed on credit cards, retail finance, overdrafts, mail order catalogues, and other types of personal loans. If repayments are not made the lenders will still seek to recover the money lent – often by using debt collection agencies. However, since the debt is unsecured, the lenders have no right to the specific assets that may have been acquired with the borrowed money.
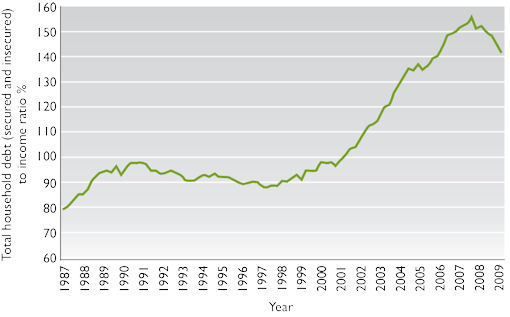
Levels of personal debt have changed over time, growing steadily in the 1980s, then more slowly in the early 1990s – largely as a consequence of falling house prices, which reduced the size of demand for mortgages – and growing rapidly from the mid 1990s until 2007, then slowing significantly during the subsequent financial crisis. Notwithstanding these variations in the rate of growth, the overall picture is that personal indebtedness in 2008 was substantially higher than ten, twenty or thirty years earlier. One consequence has been that the ratio of total personal debt to total after-tax household income has risen materially. As you can see in Figure 2, between 1987 and 2009 the ratio of debt to household income increased from 0.8 to over 1.5 (BIS, 2010). Following the financial crisis the debt-to-income ratio declined, as is also shown in Figure 2. This ratio had risen to 1.6 by the onset of the financial crisis in 2007, at which point it levelled off (Bank of England, 2010a; ONS, 2010a). This means that up to 2008, a period of time when household income was growing, levels of debt were growing even more rapidly. The inference is that the burden of debt on households over this period was therefore growing – since more debt means that greater sums have, eventually at least, to be repaid. From 2008, the fall in the ratio could be explained by households paying down debt and being more reluctant to take out new debt.
An important factor in this preparedness to take on debt was the level of ‘economic confidence’ from the mid 1990s to 2007. When people feel optimistic about the future – when there is the so-called ‘feel good’ factor about the economy – they are more likely to consider taking on debts than if they are worried about the economy and problems such as falling net incomes and unemployment. Indeed, the prevalence of the latter factors from 2007 helps to explain why outstanding personal debt slowed substantially from that point. The demand for debt products remained low throughout the period of economic recession after 2007, and even in 2010 ‘demand for secured lending, including remortgaging, remained weak’ (Bank of England, 2010b), while the annual growth rate of unsecured lending was close to zero.
There were some specific developments within personal debt in the 1990s and 2000s. One was for people to increase the level of secured debt by increasing their mortgage debt. This phenomenon came about particularly as a result of rising UK house prices. The rising prices tended to increase the equity people had in their homes. Many people therefore sought access to this additional equity by increasing the size of their mortgages and then using the resulting funds to increase spending in other areas (Del-Rio and Young, 2005). This process is known as equity withdrawal.
A second development within the total level of personal debt has been an increase and then a decrease in the proportion that is unsecured. Unsecured debt rose from 13 per cent of total debt in 1993 to 18 per cent in 2005, only to subsequently fall back to 16 per cent in 2007 and 15 per cent in 2010 (Bank of England, 2010a). While the rise can be explained by the greater use of credit cards in the 1990s and early 2000s, the subsequent fall in the proportion after 2005 may be ascribed to borrowers replacing unsecured debt with cheaper secured debt or simply paying off expensive credit card debts. Despite this trend change, the average level of unsecured debt for each household in the UK in 2010 still amounted to £8650 (Credit Action, 2010a). There has also been a gradual shift in the uses to which such unsecured debts are put, with more people taking on debt to finance expenditure on items such as holidays, clothing or special occasions (Del-Rio and Young, 2005).
2.2 When are debt levels too high?
Looking at these figures for personal debt might lead some to conclude that the levels are too high. This conclusion was reinforced by the growing rhetoric on the subject coming from the media, politicians and church leaders – particularly in the years up to the onset of the financial crisis in 2007. Yet determining whether debt levels are a problem requires consideration of a number of complex issues.
The first of these issues is to consider the level of debt, taking into account all assets and liabilities. A Bank of England report indicated that at the end of 2004 the net worth of all households in the UK – that is, the value of total assets minus total secured and unsecured debt – was about £5 trillion (Tudela and Young, 2005). This was a substantial rise from just over £2 trillion ten years earlier, with the majority being made up of wealth held in the form of housing, which stood at £3.2 trillion (Tudela and Young, 2005). The remainder consisted of other financial assets, for example, money held in savings accounts. A later survey by the Office for National Statistics (ONS) covering the period 2006 to 2008 found that private household net wealth in Great Britain in 2006/08 had grown further to £9 trillion (ONS, 2009). Therefore, at the level of the country as a whole, the value of total household assets is substantially greater than the total amount of household liabilities, a fact which might be interpreted as meaning that high and increasing levels of debt are affordable (Tudela and Young, 2005).
This leads us to the second issue: even if the value of household assets exceeds household liabilities, people may still have difficulties in making the repayments due on outstanding debts. There are different ways of defining when individuals and households are facing debt problems, and there is no universally agreed definition. ‘Over-indebtedness’, ‘problem debt’ and ‘financial difficulty’ can all be used as interchangeable terms for the same debt problems (DTI, 2005). ‘Over-indebtedness’ is a term used to describe debt that has become a heavy burden for the borrower. Citizens Advice defines ‘problem debt’ as ‘when an individual is unable to pay their current credit card repayments and other commitments without reducing other expenditure below normal minimum levels’ (Citizens Advice, 2003, p. 48). The definition of debt problems as having debt that is considered by the individual to be a heavy burden is especially interesting because it suggests that two individuals with the same financial circumstances may have different views as to whether their debt is a heavy burden or not! So a statistical measure often used in personal finance to measure ‘financial difficulty’ is whether debt repayments (excluding secured loans like mortgages) are 20 per cent or more of net income.
A 2004 UK Government publication showed that the proportion of people who saw debt as a ‘heavy’ burden stayed constant at around 10 per cent between 1995 and 2004 despite rising personal debt levels (DTI, 2004). Other studies published at that time concluded that the proportion of people’s income spent on loan repayments was broadly constant between 2000 and 2004 (Oxera, 2004), and that UK household debt as a percentage of household income was broadly the same as in the USA, Japan and Australia, only a little higher than in Germany, and lower than in the Netherlands and Denmark (Debelle, 2004).
Subsequently – and particularly after 2007 – evidence indicated that the number of people who at least had concerns about their debts was growing. In 2008/09, Citizens Advice found that debt was the largest category in terms of the volume of problems on which they advised clients, with advice being given to around 575,000 clients on 1.9 million debt problems during the year (Citizens Advice, 2009a). It also found that in 2008, 45 per cent of its owner-occupier clients had arrears on their mortgages or secured loans – this compared with 30 per cent of its clients in 2004 (Citizens Advice 2009b). Citizens Advice has also noted an association between debt problems and the number of credit cards held (Citizens Advice, 2003). In 2010 there were more credit and charge cards than people in the UK: 71.3 million credit and charge cards compared with around 60 million people (Credit Action, 2010b).
Evidence produced by the Bank of England also indicates that developments in the economy after 2007 resulted in more households finding their debts to be a burden. Between 2004 and 2008, the proportion of households that said they were having difficulties with their housing payments (including mortgage payments) doubled to 12 per cent (Hellebrandt and Young, 2008). By 2008, 33 per cent of households surveyed said that their unsecured debt was ‘somewhat of a burden’, while 14 per cent stated that it was a ‘heavy burden’ – both proportions being markedly higher than in the early and mid 2000s (Hellebrandt and Young, 2008). Such pressures, coupled with the onset of economic recession after 2007, were reflected in the growth of arrears on debts and a marked increase in the number of homes being repossessed by mortgage lenders in the late 2000s. In 2009, 47,700 properties were repossessed compared with 8200 in 2004 – although the number of new repossessions subsequently fell slightly in the first half of 2010 (Communities and Local Government, 2010).
Activity 1
What factors do you believe were responsible for the increase in the proportion of households that reported their debt as being a burden during the 2000s?
Comment
The prime reason for this upward trend was the reduction in ‘available’ income as a result of higher household bills. The late 2000s saw sharp increases in certain livings costs including foodstuffs, domestic fuel bills and petrol. At the same time, the earnings of many households failed to keep pace with price inflation. Higher taxation – at least for some income groups – may also have been a contributory factor in reducing available income. Growing unemployment after 2007 was also a contributory factor in reducing available income for some households, thereby making debts more of a burden.
This evidence leads to a third issue to consider when determining whether debt levels are a problem: how debt is distributed between different households, and whether debt is causing problems for particular types of households. Certainly, while liabilities are more than matched by assets across the UK as a whole, debt is more likely to be a major problem for certain categories of individuals and households. For example, those on low incomes and those in their twenties and thirties are more likely to have debt problems (DTI, 2005). A 2007 survey commented that around 50 per cent of those describing debt as a ‘serious problem’ were from a low-income group (Social Justice Policy Group, 2007).
| Type | Base | Arrears indicator (%) |
|---|---|---|
| Single, not retired, without children | 1,379 | 12 |
| Single, not retired, with children | 466 | 27 |
| Couple, not retired, without children | 1,745 | 4 |
| Couple, not retired, with children | 1,384 | 8 |
| Single retired | 59 | 0 |
| Couple retired | 1,252 | 2 |
Table 1 demonstrates the relationship between debt problems and family type. The table shows that family type single, not retired, with children are much more likely to be both in arrears and to have higher heavy burden indicators than all other family types (BIS, 2010).
The link between income levels and debt problems was identified again in a study by the Institute for Public Policy Research, which found that ‘not all low-income families use consumer credit or get into debt, but poverty and job insecurity increase vulnerability to debt problems’ (Ben-Galim and Lanning, 2010). The study goes on to note that ‘job insecurity and fluctuations in income and expenditure can expose poorer households to debt problems’ (Ben-Galim and Lanning, 2010).
Moreover, there is a link between low-income households and financial exclusion, including having less access to mainstream banking and loan facilities. This, in turn, means that low-income households turn to alternative sources of credit. Bridges and Disney (2004) found that the use of credit for catalogue and mail-order purchases was very common among low-income families. Since these alternative sources of credit are typically more expensive than mainstream credit – because the interest rate charged is higher – such financial exclusion increases the probability that debts become a burden and arrears are built up.
Debt problems also relate to family type. Families with children are more likely to be in arrears than households without children and, for families with children, lone parents are much more likely to be in arrears and to have two or more debt commitments (DTI, 2004). In addition, home ownership appears to play a role, with a study of debt among low-income families in the UK finding that tenants are much more likely to be in debt than homeowners (Bridges and Disney, 2004).
A further recent development has been the sharp increase in the number of women in the UK experiencing debt problems. In 2009, women accounted for 40 per cent of all bankruptcies, with the number having increased from 6042 in 2000 to 29,680 in 2009 (Independent, 2010).
Activity 2
What kind of pressures do you think substantial debt might place upon individuals and households?
Comment
In a paper entitled ‘Debt and distress: evaluating the psychological costs of credit’, academics from Leicester University in the UK found an association between debt and psychological well-being. Their main finding was that unsecured debt, measured by outstanding (non-mortgage) credit, had a greater negative influence on psychological well-being than (secured) mortgage debt (Brown et al., 2005). A YouGov survey found that 35 per cent of those polled were kept awake at night worrying about their debts, with the respondents citing debt as the number one cause of family breakdown (YouGov, 2006).
Therefore, despite the fact that the data on debt across the whole of the UK show that the value of household assets is much greater than liabilities, a significant minority of households and individuals have debt problems. This minority appears to have been growing since the mid 2000s. Households with debt problems are concentrated in low-income groups, especially lone-parent households, many of whom face great financial difficulties (Brown et al., 2005; Citizens Advice, 2003; Kempson et al., 2004). In 2008, Citizens Advice found that the average net monthly income of their debt clients was less than two-thirds of the average monthly household income in the UK (Citizens Advice, 2009c). Nevertheless, even those who own their own home but still have a substantial mortgage may have cause to be concerned about debt. A rise in mortgage rates, a crash in the housing market or, as might be expected, the introduction of substantial student fees in England, could cause severe financial hardship. The repercussions of a large number of households suffering financial hardship would, in turn, have a significant and detrimental impact on the whole economy.
2.3 Liberalisation in the financial services industry
We’ve already touched upon the changing social and economic context by looking at the growth of debt in relation to income and the way that debt impacts upon different types of household. Yet there are other aspects of the social and economic context relevant to understanding debt. One of the most important was the liberalisation of the UK financial services industry. This process brought about great change within financial services and dated back to legislation passed in the 1980s. This included the Financial Services Act 1986, the Building Societies Act 1986, and the Banking Act 1987. Together with policy changes by lenders, these acts prompted the diversification by financial institutions into various new activities; relaxed rules on the use by lenders of borrowing from other financial institutions in the world’s financial markets to finance their personal lending, and encouraged greater price competition among lenders.
These developments led to a very different environment from that prevailing in the 1970s. Then, credit and store cards were only starting to emerge in the UK. Most mortgage lending was carried out by building societies while the banks largely limited their personal lending activities to providing overdrafts and personal loans; boundaries were clearly drawn. Other features of financial life before the 1980s were starkly in contrast with life in the mid 2000s. Lenders were less proactive in encouraging debt, and marketing was limited. Borrowers expected to have a long-standing – if not lifetime – relationship with financial institutions: one bank for banking and loans, one building society for a mortgage. When seeking a mortgage from a building society, borrowers were often expected to have a savings account with the same lender. Even after having their mortgage applications approved, borrowers sometimes had to queue for funds until these were available for advancing. By the mid 2000s, it was common for households to have multiple relationships with different lenders.
Accompanying this more competitive environment has been a greater emphasis on marketing. Some newer entrants to the UK credit card market introduced more aggressive marketing techniques and offering interest-free periods to woo consumers (but often with ‘catches’), and higher credit limits, including some limits increased with no reference to the borrower. Marketing is used by companies to encourage people to buy goods and services; it’s now common for banks and other lending institutions to advertise ‘sales’ for their debt products in much the same way as traditional high-street stores selling jeans and trainers, for example, might have January sales.
Consequently, it can be argued that the liberalisation of the financial services industry in the UK is linked to the consumer society: the increased availability of debt products helps to provide the money that fuels immediate consumption. One partial explanation for people’s willingness to borrow is that there has been a shift from deferred gratification, where one might save before purchasing a good, towards immediate reward, obtained through using credit (Lury, 2004). It’s possible to see the strength of this argument in practice when you consider the number of adverts encouraging you to ‘buy now and pay later’.
This discussion can be carried a step further: it can be claimed that the financial services industry is not simply meeting the demand for debt, but it is part of a process which encourages debt. There is some evidence to support this argument. For instance, a study in the USA found that increases in credit card limits, 90 per cent of which are initiated by the issuers rather than card holders, generated an immediate and significant rise in debt (Gross and Souleles, 2002).
There are also claims that the liberalisation of financial services has not made the debt market as competitive as it would appear. The Competition Commission found, in a report into store cards, that: ‘there is an adverse effect on competition in connection with the supply of consumer credit through store cards and associated insurance in the UK’; this report also found that the charges on store cards were ‘on average some 10 to 20 per cent higher across the store card market as a whole than they would have been had they reflected providers’ costs, including the cost of capital’ (Competition Commission, 2005). In essence, this is arguing that there is a lack of competition in the provision of such cards, and that consequently the charges for them are higher than they need be. The report suggests that the estimated cost to cardholders in terms of the excess prices paid for credit and insurance was in the region of £80 to £100 million a year.
Liberalisation also tends to be accompanied by increased regulation. The Office of Fair Trading (OFT) and local authority Trading Standards Departments enforce the Consumer Credit Act 2006. The 2006 Act amended the Consumer Credit Act 1974, which had started to come under increasing strain in the 1990s and 2000s and was arguably unable to cope with the more liberalised debt market. The 2006 Act regulates consumer credit and consumer hire agreements and lays down rules covering issues such as: the form and content of agreements; what can and cannot be stated in advertisements for debt products; and the procedures for debtors to challenge unfair relationships with creditors. The Act requires lenders to provide annual statements for some types of loan and more information to be given to customers who are not keeping up with their payments. The 2006 Act also increased the number of credit deals that are regulated.
2.4 Structure of the financial services industry
Although the global financial crisis which began in 2007 wrought havoc with the UK financial services industry, the sector has continued to be dominated by banks. This domination had been reinforced by the conversion of most of the large building societies to banks in the 1980s and 1990s – although all those that did convert were subsequently either acquired by other banks or, in the case of Northern Rock Bank and parts of Bradford & Bingley Bank, taken into public ownership during the financial crisis.
Banks and other types of lending institutions are described in Box 2. In 2010, banks accounted for 59 per cent of personal lending, building societies accounted for 13 per cent, and other specialist lenders accounted for 28 per cent (Bank of England, 2010a).
Box 2 The UK Lending Industry
- Banks are mostly public limited companies (plcs) that are owned by their shareholders. These include the major ‘high-street’ names, such as Barclays, Lloyds Banking Group, HSBC, the Royal Bank of Scotland (RBS) and Banco Santander – the Spanish bank that has made a number of acquisitions of UK banks including Abbey National Bank and Alliance & Leicester Bank. Additionally, there are a number of smaller banks including Metro Bank, which commenced business in 2010, and Church House Trust Bank, which is owned by Virgin Money. The UK Government currently has majority shareholdings in RBS and Lloyds Banking Group as a result of the support that both needed at the height of the global financial crisis.
- Building societies are ‘mutual’ organisations. This means that they are owned by their retail savers and borrowers (that is, their personal customers). When they were originally founded – mostly in the nineteenth century – building societies were organisations formed by groups of people who saved together to buy land on which to build their homes. Subsequently, ‘permanent’ building societies emerged with whom people could save even if they did not need to acquire a home themselves. The Nationwide Building Society is, by some distance, the largest of the remaining societies in the UK, although in 2010 there were still forty-nine others, such as the Yorkshire, the Coventry and the Skipton Building Societies.
- Finance companies are in many cases subsidiaries of banks and building societies. These specialise in personal loans, and motor and retail finance (e.g. Carselect – a subsidiary of Lloyds Banking Group).
- Direct lenders are also often subsidiaries of banks, building societies and insurance companies. The chief distinction between these and other lenders is that they do not have a branch network; they deal with customers via the internet, telephone and the post, e.g. Direct Line.
- Credit unions are cooperative organisations, often small in size and run on a localised basis. There are two main types: community-based, whose members tend to come from low-income groups; and work-based, whose members are employed with an affiliated organisation. One of the largest is The Open University’s credit union.
- The Student Loans Company (SLC) is owned by the UK Government, and lends to students in higher education to enable them to meet their expenses. With the cost of higher education increasing in recent years, the SLC has become a major lender.
- The alternative credit market consists of ‘sub-prime lenders’ aimed primarily at people on low incomes. Such lenders include some loans companies, door-to-door money lenders, rental purchase shops, ‘sell and buy back’ outlets, and pawnbrokers. In addition, this market includes unlicensed lenders who provide loans in an emergency at extremely high rates of interest.
- Budgeting loans are available for people on some state benefits. These are interest-free loans which have to be paid back, and in 2010 they had a borrowing limit of £1500.
The UK’s lending industry has been affected by the diversification into financial services of many retailing companies, particularly the supermarkets. Initially, these moves into financial services were undertaken as joint ventures with established banks. For example, the financial services activities of Tesco were originally a fifty-fifty joint venture with First Active – part of the Royal Bank of Scotland (RBS). In 2008, however, Tesco bought out the RBS share and established its finance operations on its own as Tesco Bank. By contrast the financial services diversification of Sainsbury (Sainsbury Finance) remains a joint venture with Halifax Bank of Scotland (HBOS), which itself is now a subsidiary of Lloyds Banking Group. The financial arm of Marks & Spencer, M&S Money, is a 100 per cent subsidiary of HSBC Bank. The retailing names of these relatively new financial entities clearly help in marketing their services to the public.
The basic business of all lenders is really the same. It involves borrowing money from the public and institutions, and lending the money (at a profit in most cases) to the public, companies, local authorities and even governments.
Activity 3
Which of the categories of lender in Box 2 have you borrowed from? Why was this? If you haven’t borrowed any money, which kinds of institutions might you borrow from in the future?
Comment
Thinking through the reasons why you build and maintain relationships with different categories of lender is important. Do you shop around for the best deal or do you accept the first offer? Do you deal with building societies because of their mutual status, or do you turn to the alternative credit markets? Sections 3 and 5 of this course will provide information about and examples of the kind of issues someone might work through in order to come to an informed decision about categories of lender and types of loan products. It’s important to remember that not everyone has such a choice: low-income households may have to use money lenders or mail-order companies because of a lack of access to mainstream lenders.
One key difference between the different types of lenders lies in their differential need to make profits. For example, a major objective of incorporated companies like banks and finance companies is to maximise profits. Banks have in recent years been very successful in doing this – and the huge losses several made during the global financial crisis that began in 2007 only proved to be a temporary deviation from their ability to operate profitably. Most banks were back in profit in 2010.
It is this issue about profitability that regularly raises concerns about whether the banks are extracting too high a profit margin on their business with households through their charges and interest rates on debt products, especially credit cards. In 2003, the Parliamentary Treasury Select Committee was among those that had voiced concerns about the interest rates charged on credit cards (UK Parliament, 2003). This pressure led to some changes, such as the industry’s introduction of an ‘Honesty Box’, in which lenders provide a range of basic information about a credit deal, and the use of existing statutory powers to improve the means by which early repayment charges are calculated. Subsequently, a protracted legal dispute between the lending institutions and the OFT, on the issue of bank charges in the late 2000s, ended in defeat for the OFT in 2009. In 2010, however, the incoming Conservative/Liberal Democrat coalition Government announced its intention to end ‘unfair’ bank and other financial transaction charges, with plans to ban ‘excessive’ interest rates on credit and store cards (BBC, 2010).
Additionally, with the acquisition of several UK lenders by other banks and building societies – combined with the withdrawal of some foreign banks from their operations in the UK as a result of the financial crisis – fears started to be expressed in the late 2000s that less competition among lenders might allow them to secure larger profits.
In contrast to banks and other incorporated companies, building societies have no shareholders since their customers in effect own them, and so they do not have to make dividend payments. With the financial leeway this gives them, these mutual organisations may charge lower rates of interest to borrowers.
For credit unions, the maximum interest rate that can be charged is set by law, and the interest rate charged by the Student Loans Company (SLC) has, to date, been linked to the rate of price inflation by law. However, changes to the arrangements for fees for higher education in England, and to student loans to finance fee payments, presaged by the Browne Report (Browne, 2010), mean that this linkage may not apply in the future.
3 Debt costs
3.1 Some basics of debt and interest
When someone acquires a debt, the money that they will have to repay to the lender will consist of three different elements. Let’s briefly introduce each of these in turn.
First, there is the amount originally lent – this is normally referred to as the principal sum (or sometimes the capital sum). For instance, if £10,000 is borrowed for five years to buy a car, then the £10,000 will have to be repaid. There are two usual ways in which this principal sum can be repaid: either in one amount at the end of the term of the loan (in this case, five years), or in stages over the life of the loan. The former is often referred to as an ‘interest-only loan’ and the latter a ‘repayment loan’. If the principal sum is to be paid off in full at the end of the loan period, the borrower will need to have the money available – for example, through the proceeds from an endowment mortgage or through building up other savings to pay off the loan.
Second, there is the important additional cost of having debt: the interest that has to be paid on it. In effect, interest is an additional charge on the repayment of debt. The interest rate is the exact price of this charge. It is normally expressed as a percentage per year – for example 7 per cent per annum, or more commonly abbreviated to ‘7 per cent p.a.’. The charging or paying of interest is generally rejected by shariah law, as it used to be by some Christians in earlier centuries. In modern economies, the concept of interest comes about because lenders require payment in return for the access to the money they have given up, in return for the risk associated with not getting their money back, and because they require an amount to cover the expected inflation rate over the coming year.
Third, there may be charges associated with taking out, having or repaying debt. We’ll look at these in more detail in Section 3.4.
3.2 The official interest rate
In the UK, the official interest rate – also known as ‘Bank Rate’ – is set monthly by the Bank of England, as explained in Box 3.
Box 3 High noon in Threadneedle Street
Prior to 1997, ‘official’ interest rates in the UK were determined by the UK Government, usually after consultation with the Bank of England. Arrangements changed in May 1997 when the incoming Labour Government passed responsibility for monetary policy and the setting of interest rates to the Bank of England to make them independent of political influence. This matches the arrangement in the USA and in the ‘euro zone’, where the Federal Reserve Bank and the European Central Bank respectively set official rates. The rate set by the Monetary Policy Committee (MPC) known as ‘Bank Rate’ is the rate at which the Bank of England will lend to the financial institutions. This, in turn, determines the level of bank ‘base rates’ – the minimum level at which the banks will normally lend money. Consequently, Bank Rate (also known as the ‘official rate’) effectively sets the general level of interest rates for the economy as a whole. Note, though, that for individuals the rate paid on debt products will be at a margin – sometimes a very high margin – over Bank Rate and bank base rates. Indeed, one of the consequences of the financial crisis (see Box 1) was that the margin between Bank Rate and the rate paid on debts widened sharply (except for those products whose rate was contractually linked to the Bank Rate).
Each month, the Bank of England’s MPC meets for two days to consider policy in the light of economic conditions – particularly the prospects for inflation. The MPC’s decision is announced each month at 12 noon on the Thursday after the first Monday in the month. The objective, in 2011, was for the MPC to set interest rates at a level consistent with inflation of 2 per cent p.a. For example, if the MPC believes inflation will go above 2 per cent p.a., they may increase interest rates in order to discourage people taking on debt – because if people spend less, it may reduce the upward pressure on prices. Conversely, if the MPC believed inflation would be much below 2 per cent p.a., they might lower interest rates (also known as ‘easing monetary policy’) – people may then borrow and spend more.
As you can see from Figure 5, official rates of interest tend to be cyclical, rising to peaks and then falling to troughs. Since 1989, the trend in the UK has been for nominal interest rates to peak at successively lower levels. Nominal rates then fell to 3.5 per cent in 2003. In 2010 they were at a record low of 0.5 per cent. They had been at this level since March 2009 as the Bank of England was attempting to stimulate economic activity following the period of recession at the end of the 2000s. However, the benefit of these low nominal interest rates was not fully experienced by borrowers as the margin between the Bank of England’s Bank Rate and the rate charged by lenders on their debt products widened.
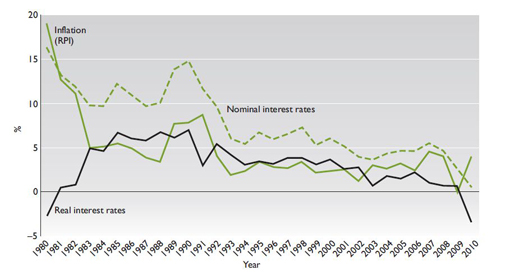
Real interest rates are interest rates which have been adjusted to take account of inflation. Looking at Figure 5, when inflation is higher than the nominal interest rate, real interest rates are negative (as they were in 1980/81 and again in 2010/11). Real interest rates are at zero when the rate of inflation and the nominal interest rates are the same; and are positive when the nominal interest rate exceeds inflation. Real interest rates were low in the 1990s and 2000s, falling from 7 per cent in 1990 to just under 2 per cent by 2004. Subsequently they fell further. By 2010 the fall in the official interest rate to an historical low of 0.5 per cent, combined with price inflation of 4.7 per cent, resulted in negative real interest rates of minus 4.0 per cent (ONS, 2010b and 2010c). Unsurprisingly the low interest rates offered on savings encouraged many households to reduce their debts – particularly credit card debts – by running down savings balances.
Most mainstream lenders link interest rates, including mortgage rates, to the official rate of interest, and so the cost of debt, including mortgage debt, declined over this period. This is another reason why debt levels may have risen in the 1990s and until 2007. After 2007, the relationship between the official rate of interest and the cost of debt products was altered by a widening in the margin between them. Nevertheless, at the end of the 2000s interest rates on mortgages and many other debt products were historically low.
3.3 More on interest
Let’s look at interest payments in more detail. We can return to the car loan I mentioned in Section 3.1. If £10,000 is borrowed and no repayments of this principal sum are made during the year, and the interest rate is 7 per cent p.a. with interest being paid once a year at the end of the year, the interest charge for that year is £700. Thus, provided that the principal sum owed to the lender remains at £10,000 and interest rates are 7 per cent p.a., the borrower will have to pay £700 each year to the lender.
Activity 4
How much would you pay in interest per annum if you make no repayments on a principal sum of £50,000 and the rate of interest is as follows?
- 5 per cent p.a.
- 35 per cent p.a.
- 7.5 per cent p.a.
- 6.7 per cent p.a.
Answer
As you completed the calculations in Activity 4, you may have started to think of some factors that could complicate the calculation of the interest charge. For example, what would be the interest charge if some of the principal sum is repaid during the course of the year In many cases, the answer is that the interest rate calculation will be based on the average balance of the principal sum during the year. For instance, if £10,000 is owed at the start of the year and £100 is repaid halfway through each month, then the outstanding balance at the end of the year would be £8800. The average balance of principal outstanding during the year would be the average (mean) of the balance at the start and at the end of the year, or £9400.
Based on this average balance, the interest for the year at 7 per cent p.a. would be £658 – rather less than the £700 if no repayment of the principal sum had been made.
The precise practice for computing the interest charge varies among different lenders – and interest can be calculated by different lenders at different time intervals. One of the pieces of financial small print it is always vital to read is the basis on which interest is charged – that is, how often and by reference to what terms. For instance, if someone was repaying some of the principal sum of their loan regularly, the interest charged would be lower if the interest charge was calculated on a daily basis, rather than a monthly, or an annual, basis (an annual basis would be the least favourable if repayments of the principal sum were being made).
Another question may be what happens if the borrower does not repay the interest due to the lender? Again, this will depend on the details of the contract with the lender and their attitude to borrowers who fall into arrears. Normally, the lender will add the interest charge left unpaid to the principal sum. This means that the following period’s interest charge is going to be higher since the borrower will be paying interest not only on the original principal sum but also on the unpaid interest. This is known as compounding, and can quickly enlarge debts. Figure 6 provides an example of compounding, illustrating what happens if someone borrows £1000 at an interest rate of 35 per cent and makes no repayments over ten years. Over this period of time, the debt would rise from £1000 to £20,107.

The dangers of compounding were demonstrated vividly in a famous case which came to court in 2004. This is reported fully in Box 4. A debt of £5750 grew to the staggering sum of £384,000 in fifteen years. In the event, the debt was (unusually) cancelled for being ‘extortionate’. Yet it showed the risks of compounding very clearly!
Box 4 Landmark ruling as judge erases couple’s debt
A judge today wiped out a couple’s debt of £384,000 which had spiralled out of control from an original loan of £5,750 due to ‘extortionate’ interest rates. Tony and Michelle Meadows, from Southport, Merseyside, faced losing their home after they were taken to court by London North Securities for failing to keep up with repayments on their loan.
The couple, who have two children, took out the loan in 1989. Mr Meadows, 45, a car windscreen salesman, claimed he had taken out the loan, designed for people with poor credit ratings, to install central heating and convert a bathroom into a third bedroom. The small print of the loan agreement revealed that the couple would be charged a ‘compounded’ interest rate if they ever fell into arrears.
Essentially this meant that the money lenders were charging 34.9 per cent interest on the arrears as well as on the repayments, which soon resulted in the debt growing to an enormous amount.
Judge Howarth said: ‘Where the rate concerned is as high as 34.9 per cent it seems to me that the combination of factors is so potentially exorbitant that it is grossly so and does grossly contravene the ordinary principles of fair dealing.’ He added: ‘This is one of the few credit bargains which is extortionate.’
When the couple failed to keep up with repayments, their debt soared and London North Securities attempted to take possession of the couple’s £200,000 family home to pay off the loan.
Speaking outside court, Mr Meadows said ‘It wasn’t a wanton spending spree we went on back then, it was just something we had to do at the time. I would advise people thinking of taking a loan to read the small print very carefully.’
The court heard the couple ended up with a loan for £5,750 to pay for £2,000 home improvements, around £3,000 to pay off their mortgage and £750 for an insurance policy they did not want …
[Subsequently the Court of Appeal] dismissed a challenge by the lender, London North Securities, to a County Court judgment that wiped out the debt run up by the Meadows. They said the loan agreement was unenforceable under the Consumer Credit Act after the original loan company had wrapped insurance payments into the debt and then added interest and penalty payments to the total.
(adapted from The Guardian, 2004 and 2005)
Interest rates can also be set in a number of different ways. These are:
- A variable rate which can move upwards or downwards during the life of the loan. In the UK, these usually move in tandem with movements in the official rate of interest (see Box 3). Some products (called ‘trackers’) are specifically linked to official Bank of England rates.
- A fixed rate where the rate is determined at the start of the loan and remains unaltered throughout the fixed rate term. The rate will be based on what the lender has to pay for fixed rate funds of the same term.
- A capped rate where the rate cannot rise above a defined maximum (the ‘cap’), but below this ‘cap’ it can move in tandem with movements of official interest rates. A variation to a capped rate loan is a ‘collared’ rate loan where rates can move in line with official rates but cannot either go above a defined maximum (the ‘cap’) or below a defined minimum (the ‘floor’). Such products usually require the payment of a fee to the lender at the start of the loan.
Most commonly, personal loans are set at a fixed rate, credit card debt and overdrafts at a variable rate, while mortgage lending is split between the three interest rate forms defined above. However, between 2008 and 2011 the volume of ‘capped-rate’ mortgage business was very small. In mid 2010, new mortgage lending in the UK was divided almost equally between fixed rate and variable rate (CML, 2010). Households with variable rate mortgages are, along with most of those with credit cards and overdrafts, at risk to increases in the official rate of interest made by the Bank of England. As mortgages account for a large proportion of personal debt, it is easy to see why the UK economy can be easily affected by even relatively small movements in interest rates.
Activity 5
Under what circumstances do you think it might be attractive to borrow at the following types of interest rate?
- Fixed rate of interest.
- Variable rate of interest.
Comment
Assuming that borrowers have a choice and want to pay as little interest as possible, choosing a variable rate may be preferred if interest rates are expected to fall, and fixed rates may be preferred if rates are expected to rise. However, to assess which would be cheaper requires a forecast of how rates will move during the life of the loan, and making such forecasts is difficult because it is difficult to predict future rates of inflation and interest rates. In addition, the choice may reflect the borrower’s household budget. For example, households on a tight budget may choose a fixed rate because this would provide certainty of monthly expenditure.
3.4 Annual Percentage Rate (APR)
You have seen that borrowers have to repay both the principal sum and interest to the lender, and that the interest charge may be fixed, variable or capped. On top of this, there are often extra costs. Some of these costs arise from fees which may have to be paid on obtaining a loan and, under certain circumstances, on repaying the loan before the end of the term. Such extra costs include:
- Arrangement fees paid to the lender: These are usually flat rate, one-off fees and are generally charged when the borrower takes out a fixed rate or capped rate loan, or when remortgaging.
- Intermediary fees: These may be paid when a borrower deals with a broker rather than directly with a lender.
- Early repayment (or ‘prepayment’) fees: These may have to be paid to a lender if a loan is repaid early. The argument used by lenders is that earlier repayment can incur additional costs. In the case of personal loans, early repayment charges mean the lender gets a share of the interest which would have been paid had a borrower kept the loan for the full term.
- Tied insurance: Taking out insurance (for instance, payment protection insurance, life insurance, home insurance) may be required with a loan. In other cases, insurance may be optional, although this is not always made clear to borrowers, who might end up paying for inappropriate policies. The commissions earned on such sales add to the profits made on lending.
Given all these different potential charges, and the different methods of calculating interest, it’s important to have a good means of comparing the total cost of debt on different debt products. Fortunately, in the UK there is a way of ensuring an accurate ‘like for like’ comparison, and of assessing which is most appropriate. This is known as the Annual Percentage Rate (APR) of interest. This accommodates interest and those charges discussed above that are compulsory. It does not include optional charges, such as buildings insurance that is not a required as part of a mortgage package, or contingent charges, such as early repayment fees, that would become payable only in situations that are not applicable to all lenders. The APR also takes into account when the interest and charges have to be paid. The method for calculating the APR is laid down by the Consumer Credit Act 1974, as amended by the Consumer Credit Act 2006. Generally, a low APR means lower costs for the borrower.
This means that APR should be seen as only a guide and not a perfect measure. As mentioned in the previous paragraph, it does not include any costs which might occur that are not a compulsory part of the loan. In 2003, the Parliamentary Treasury Select Committee report into credit and store cards found that there were, in practice, two different precise methods used to calculate the APR, and ‘up to 10 different ways in which charges are calculated, meaning that users of cards with the same APR can be charged different amounts’ (UK Parliament, 2003). The Department of Trade and Industry responded by publishing regulations that tightened up the assumptions that could be used in the calculation of the APR. These difficulties were one of the drivers behind the Consumer Credit Act referred to Section 2.1.
3.5 Interest rates and individuals
You saw in Box 3 that the Bank of England determines the official interest rate. Yet this is not the interest rate that will be charged to individuals taking out different types of debt. Lenders will tend to take into account a number of different factors when setting the rates for a particular individual. I mentioned in Section 3.1 that one of the reasons for charging interest was the need for lenders to have a return for taking the risk associated with not getting their money back. Customarily, the basic principle here would be that the greater the estimated risk of loss, the greater the interest charged. This means that ‘higher risk’ borrowers may be charged more interest than those who are deemed ‘lower risk’. In a similar vein, interest charges will vary according to the security offered to the lenders by the borrowers. This takes us back to the distinction between secured and unsecured debt introduced in Section 2.1 – secured debts will, other things being equal, usually have a lower interest rate than unsecured debts. Another factor which may affect interest rates is the size of the loan. Sometimes, larger loans may attract lower interest rates than smaller loans. The extent of competition between lenders will also be a factor: typically, the greater the competition between lenders who wish to lend money, the lower the interest rate you would expect them to be able to charge.
One question which arises from this is whether such factors can explain the different interest rates charged, especially the higher rates often charged to people on much lower income. A Citizens Advice survey, for instance, found that APRs charged to clients with debts owed to money lenders and home-collected credit providers ranged from 25 per cent to a staggering 360 per cent, while interest rates charged on mainstream credit card debts ranged from 9.9 per cent to 25.4 per cent and on bank loans from 8 per cent to 32.9 per cent (Citizens Advice, 2003). Box 5 describes some of the experiences of those on low incomes.

Box 5 Credit for those on low incomes
A Citizens Advice Bureau in Hampshire reported that their clients, a couple with two children, had taken out a £500 loan to repay their rent arrears which were the subject of possession proceedings. The total cost of the loan was £800 in total, with a 60 per cent rate of interest.
A West of Scotland Citizens Advice Bureau reported a client couple who have over £16,000 in debts. The couple had two recent loans from doorstep providers, both granted within two months of each other. The first loan was for £500, with a £275 interest charge. The second loan was for £100 with a £55 interest charge. These loans were being used to help meet the income shortfall on existing credit agreements.
(Citizens Advice, 2003, pp. 27, 28)
4 Debt and household finance
In this section, we look at how income and expenditure flows change over time. This enables us to investigate how debt fits into the overall picture of household finances.
4.1 Income and expenditure, and debt
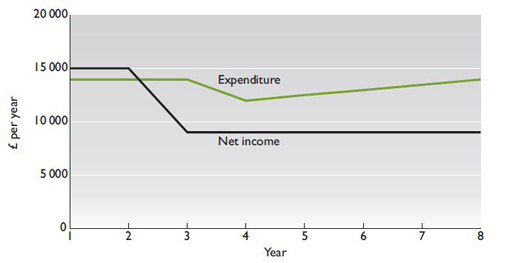
An important reason why people take on debt is because of a continued excess level of expenditure over net income: a situation which could be caused by a number of factors. Let’s use the example scenario of the Syme family: a household consisting of a lone parent and two children. We can use the Syme household to look at how flows of expenditure and income relate to debt. In this case, shown in Figure 8, the main income earner in the household loses her full-time job in year 2, and so household income falls below expenditure. This is a realistic scenario: according to Citizens Advice, job loss is one of the three main reasons for problems with debt, along with living long term on low income and overcommitment to high levels of spending (Citizens Advice, 2003). In the case of the Symes, from year 3 onwards net income, made up of benefits and earnings from part-time work, totals £9000 per year. Expenditure remains constant at £14,000 in year 3, and then the household manages to cut expenditure down to £12,000 in year 4. However, the shortfall between expenditure and income must be financed. This can be done by either using up any savings, or taking on debt, or a mixture of the two. For simplicity, in this example we’ll assume that the Symes have no savings and that they take out debt to finance the expenditure over and above net income. This debt leads to expenditure increasing from year 5 onwards as interest and other charges are added to existing household expenditure. This, in turn, would require more debt. Such a situation is not sustainable in the long term and, eventually, the Symes would either have to make other cuts in expenditure or find a way to increase income.
The Syme scenario highlights how certain life events, such as job loss, relationship breakdown or illness might lead to households having to take on debt. Other more predictable life events, such as full-time study, are easier to build into financial plans. A household, for instance, with one member who intends to go to university, might plan to finance current levels of expenditure through taking out debts and then use the benefit of the graduate earnings premium to pay these debts off after graduation.
One reason why individuals and households take on debt is to finance expenditure which is above income. Another reason is to spread the cost of expensive purchases, such as a car or house, over a number of years. In these cases, a household takes out a relatively large debt which is repaid over time. This cannot be taken to imply that taking out a debt to pay for such items means that the debt can be considered part of income – it might sometimes appear that credit can be used like income, to pay for items, but of course, unlike income, it forms a liability which is then owed. Debt problems often arise when a household already has debt, but then faces unexpected life events like those mentioned above.
4.2 Liabilities and expenditure
As you saw in Section 2.1, debts are liabilities: a stock of money owed at a certain point in time. Such liabilities include long-term debt, such as a mortgage, as well as short-term debts such as an overdraft. I want to explain the interrelationship between such liabilities and expenditure. This is illustrated in Figure 9.
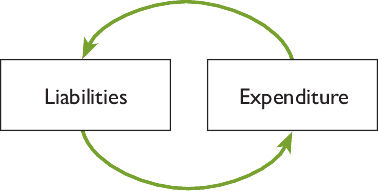
Figure 9 shows that liabilities and expenditure are inextricably linked. For example, taking on a liability will generate a future flow of expenditure in the form of debt repayments (both of the principal and, crucially, of the interest). It’s important to realise that having liabilities will give rise to higher future expenditure.
Similarly, higher levels of expenditure can give rise to liabilities. If, for instance, a household’s expenditure exceeds its income (and has no savings to draw on), then in order to fund that expenditure, a liability will arise. For example, people might run up a credit card bill, or have to increase their overdraft. Conversely, repayments of debt would gradually reduce the stock of liability over time if the repayments are of sufficient size to cover all the interest and to repay some of the capital.
To illustrate, someone may want to borrow £10,000 to buy a car. This stock of debt will be a liability; it will also give rise to monthly repayments which will be part of that person’s expenditure.
Activity 6
Can you think of any situations where taking out a debt to fund a purchase can also lead to the acquisition of an asset?
Comment
The most common answer to this question would be a home, where the house’s market value would be an asset and the amount of mortgage outstanding will be a liability. There are other possible examples – ranging from jewellery or collectibles to financial assets such as stocks and shares.
5 The borrowing process
In the example in Section 4, the Syme family fell into debt due to some unexpected circumstances. This section uses an example of someone deciding to take out a debt in order to work through the issues involved in borrowing money.
5.1 How to finance a purchase
Let’s look at the example of Philip, who wants to purchase a music system costing £1000. (We’ll assume that Philip cannot simply fund it out of his monthly budget.) In order to finance the purchase, options would include:
- using existing savings
- building up savings first, and purchasing the item later
- using a mixture of savings and debt
- taking out a debt of £1000.

Which option is chosen will obviously depend on a number of factors including, crucially, Philip’s initial financial position. Let’s start by running through some generic issues related to each of these options.
The first option involves using existing assets held in the form of savings. If Philip has built up savings, he could draw upon these to fund the music system purchase. In coming to a decision on whether to use savings, he may think about opportunity cost – the savings used to buy the music system will not then be available for him to purchase something else. He will also be giving up the future income, in the form of interest earned, on the savings that will be spent on the item. He might also compare debt costs with the loss of income on savings. Generally, you’d expect the cost of debt, in terms of the interest that will be paid, to be rather higher than income from savings for two reasons. First, savings products and debt products are provided by the same institutions – such as banks and building societies – and these institutions make their profits from the difference between them. It is likely, therefore, that in normal circumstances the interest rate for debt will be higher than the rate earned on savings. Second, interest on savings will be taxed as income unless there is a means of sheltering the earnings – for example, by saving in tax-exempt products. If savings are taxed, the likelihood is that the rate of interest received after tax will be lower than the interest paid for borrowed money. Thus, other things being equal, it would usually be the case that using existing savings will be cheaper than taking out debt to fund a purchase.
The second option is to build up savings before purchase. Again, this will depend on having disposable income above expenditure, which would allow savings to be built up. It also depends upon Philip being prepared to defer the enjoyment associated from having a music system for the period of time it takes to build up the savings. For the same reasons as the first option, this second option would most likely be cheaper than using debt to fund the purchase.
The third and fourth options both involve taking on debt. For the reasons given above, it’s likely that using a mixture of savings and debt would be cheaper than funding the purchase solely through debt. For the sake of clarity, in the rest of this section we’ll assume that Philip chooses to borrow the full amount.
Activity 7
What issues would Philip need to consider in our example of buying the music system?
Comment
Philip would need to consider the relative importance of buying the music system within the wider context of his existing goals. He would need to think about the constraints on his resources, and calculate whether repayments can be afforded within his household budget. In thinking through affordability, individuals should also consider the possibility that their circumstances may change. For instance, if household income were to fall or be interrupted during the term of the loan, could repayments be afforded?
5.2 Which debt product?
Philip may or may not have been thinking through all of the issues discussed above, but we have assumed that he is going ahead and wants to fund the purchase by taking out debt. Philip will then need finance, and the debt product which is used will depend upon a number of factors, including price, flexibility and the length of time over which repayments are made. Box 6 describes the different debt products.
Box 6 Debt products
- Overdrafts: These provide a flexible means of accessing debt on a bank current account, up to a limit approved by the lender. Unapproved overdrafts normally attract penalty fees and higher interest charges than approved overdrafts.
- Credit cards (including store cards): These will have a credit limit set by the lender and normally require a minimum amount to be repaid each month – typically between 2 per cent and 5 per cent of the balance of debt. Prior to the time when the payment is due, there may be a short period of interest-free credit. Credit cards will vary widely in the interest rate charged on the balance that is not paid off, and some may have an annual fee attached, although many do not. Store cards are a form of credit card which may only be used for buying from specified outlets, and the interest rate charged on store cards tends to be much higher than that of credit cards.
- Charge cards: These can be used like credit cards to make purchases and obtain up to around two months’ free credit between purchase and paying off the outstanding amount. The difference from a credit card is that, with a charge card, a borrower is required to pay off the entire balance each month. The two-month free credit period arises from the fact that the charge card bill will be sent out monthly, with up to around a further month to settle the bill. A fee may be payable for the card. A famous brand of charge card is the American Express charge card.
- Personal loans: These are loans, typically of terms between one and ten years, which may be either unsecured or secured against a property (such as a house) or other assets. Unsecured personal loans are not contractually linked to any assets the borrower buys. These are available from credit unions, banks, building societies, direct lenders and finance companies.
- Hire purchase (HP): This is a form of secured debt where hire payments (interest and part repayment of the principal) are made over a period, normally of up to ten years in order to purchase specific goods. The legal ownership of the product only passes to the borrower when the final instalment has been paid.
- Mortgages: These are loans to purchase property or land, and are secured against these assets. Debt terms for mortgages are normally up to twenty-five years. There are many different types of mortgages and, as mentioned in Section 2.1, it’s possible to fund spending through equity withdrawal. Since the financial crisis, however, lenders have become more cautious about equity withdrawal, particularly in the wake of the decline in average house prices after 2007.
- Alternative credit: These are the areas of sub-prime lending described in Box 1, and include buying on instalments through mail-order catalogues, doorstep lending and lending on the high street. Commonly, interest rates are high and there are heavy penalties for late payment. In fact, one report found that a fifty-week loan for £400 from one of the weekly-collect credit companies would cost £700. The same report found that a £400 loan from an unlicensed lender could cost up to £2000 in repayments spread over six or more months (Kempson, 2001).
In terms of price, as Section 3.4 noted, the APR can be used to compare the costs of different debt products. One first possible step for Philip might be to gather information on different APRs. Sources of information include adverts and offers for loans in newspapers, on television, radio and the internet, the finance sections of newspapers, or financial advisers.
Connected to price is whether the debt product is secured or unsecured. One trend in recent years, encouraged by advertising, has been for individuals to consolidate a number of unsecured debts in one loan, usually secured against a property, and thus withdrawing ‘equity’ from that property. The attraction of doing this is that the mortgage rate – which tends to be the lowest of the rates charged on the different forms of debt – may now be applied to all debts and the term of debts may be extended, reducing the size of monthly repayments.
However, there are risks in adopting this course of action because swapping existing loans for a consolidated loan increases the risk of losing one’s home. Additionally, if consolidating debts in this way involves extending the term of indebtedness, there is the possibility of a mismatch between the life of the debts and the life of the assets acquired. Therefore, for example, if the music system was expected to need replacing in five years but the debt was repaid over ten, Philip might still be paying for a music system which was no longer in use. None the less, consolidating debts is popular: a survey of borrowers conducted on behalf of the Bank of England in 2004 (May et al., 2004, pp. 420–1) found that 25 per cent of respondents who took on an additional mortgage did so to fund the consolidation of debts.
The price of the debt product is clearly important when making a decision on which product to choose. Indeed, an accurate price is essential for household budgeting and planning ahead, but it’s not the only factor. A second issue is flexibility. For instance, Philip might find that debt through hire purchase (HP) is cheaper than debt through an unsecured personal loan but, because HP tends to be tied to a particular deal, there may be less flexibility in shopping around for a particular commodity or brand.

Credit cards offer a flexible way to borrow, but interest rates can be high. You saw, in Section 2.1, that possessing and using credit cards is very popular in the UK. One feature of the credit card market is the use of discounts to attract new customers. These may be in the form of ‘low start’ loans, where the initial rate charged is lower than the standard rate, but with the cost rising to the standard rate after the introductory period. One extreme example of this is where credit cards are offered at an interest rate of zero (0 per cent) for an introductory period, including for sums of existing debt transferred to the card. These rates are designed to encourage customers to move from one lender to another or, in fact, to take on debt which might not otherwise have been contemplated. If a debt product has an initial discount, borrowers need to calculate whether they can afford the rate which will apply once the discount period ends.
A third issue when choosing a debt product, and which contains both elements of price and flexibility, is deciding over what term to borrow. Table 2 uses an example of borrowing £1000 on a repayment loan at 6.7 per cent APR to illustrate the difference this makes. In this example, taken from a high-street building society, total repayments vary from £1035.48 to £1173.60. Because it is a repayment loan, the interest charged is calculated on the average balance of the principal outstanding, as discussed in Section 3.1. Although the monthly charge (and hence the expenditure in the household budget) is higher per month for a shorter loan, the total cost of repayment is less.
| Repayment period | Monthly payment (£) | Total amount paid (£) |
|---|---|---|
| 1 year (12 months) | 86.29 | 1035.48 |
| 3 years (36 months) | 30.65 | 1103.40 |
| 5 years (60 months) | 19.56 | 1173.60 |
Consequently, price, flexibility and length of term are all important factors in choosing a debt product. This is all significant information needed in any financial planning process about the taking out of debt. However, the notion of choice itself is influenced by the social and economic circumstances of individuals such as Philip. As we saw in Section 2.1, low-income groups have only limited access to mainstream finance: in fact, this is one of the characteristics of financial exclusion. People who do not own their own home, for instance, will not have the same access to secured lending as homeowners. This narrows their ability to access the kind of low interest debt which is associated with secured lending. Such individuals might, of course, choose not to borrow to fund a music system purchase, but any borrowing they do undertake would most likely involve more expensive forms of debt than homeowners can access.
Activity 8
The data below show some real-life interest rates for different products in a high-street lender in August 2010. Given that the rate for the personal loan is substantially the lowest, why might someone use any product other than a personal loan to buy the music system?
| Debt product | Typical APR (%) |
|---|---|
| Overdraft | 19.9 |
| Personal loan | 7.7 |
| Credit card | 16.9 |
| Charge card | 25.0 |
Comment
When choosing a debt product, many of the aspects you’ve seen in Box 6, and in Section 5 generally, will be important, such as flexibility, convenience, the desired term of repayment, and the price (the interest rate). Another factor that may influence someone’s decision is how these different financial products are marketed. Therefore, many factors other than the price will play a part in selecting the specific debt product, and that is why the personal loan, which is the cheapest, may not always be the product chosen.
5.3 Accessing debt products
A crucial factor in being able to access debt products is the credit standing of the borrower. People with poor ‘credit scores’, even if they have relatively high incomes, will have limited access to cheaper forms of debt. Most lenders ‘credit score’ loan applicants before releasing money. Although the exact practices vary from lender to lender, the credit score analysis can be broken down into four main areas:
- Factors which might automatically prevent approval: For example, if the individual has a County Court Judgement (CCJ) – or a decree in Scotland – against them for previously defaulting on debts.
- Affordability testing: This looks at the income and prevailing expenditure commitments of applicants, with an emphasis on existing debts.
- Characteristics of applicants: For example, how long someone has lived at their current address (and at previous addresses), and how long they have maintained their current banking arrangements will be scored. Frequent changes of address and banking arrangements attract unfavourable credit scoring.
- Security: This relates to the importance of security in deciding the level of risk and the interest rate.
The range of outcomes from this process is more than just a ‘yes’ or a ‘no’. It also determines the maximum the lender is prepared to advance and the interest rate charged. Moreover, it can involve the lender making use of the credit reference agencies (CRAs) that provide databases on the credit histories of individuals. Those seeking to borrow have the right both to ask if a CRA was employed by the lender and which CRA was used. For a small fee (£2 per file in 2010), anyone can ask to see their statutory credit report from the major CRAs (Experian, Equifax and Call Credit). For many households, the reality of the financial crisis at the end of the 2000s was that access to mortgages and other debt products became increasingly difficult to obtain. Lenders tightened up their ‘credit scoring’ processes and shunned more risky types of business. The latter could include those with a poor credit record and where inadequate security was being provided (for example, in the form of property value with respect to mortgages).
As part of any review process (such as Philip’s decision as to which debt product to use), it’s important to be able to tackle problems with debt if they arise. To where do people with debt problems turn if they get into difficulty? The nearest Citizens Advice Bureau (the local branch of Citizens Advice, whose research has been drawn on throughout this course) is one organisation which helps people with such problems. Other organisations include the National Debtline and the Consumer Credit Counselling Service. It can also be important to contact a lender and tell them about problems with repayment. Box 7 gives an example of the kind of tips for dealing with debt that are available from many organisations without charge – in this case from the OFT (2005).
Box 7 Money and credit: tips on debt
- Get free advice.
- Don’t panic or ignore the problem: unopened bills won’t go away.
- You can’t ignore your debts. Better to pay a small amount than nothing at all – those you owe money to may be prepared to accept low repayments.
- If struggling with store or credit cards, stop using them.
- Work out a realistic budget that covers all your income and spending. Check whether there are any benefits or tax credits you are entitled to that you are not getting.
- Decide which debts take priority – like mortgage or rent – and which cost you most through penalties or higher interest rates.
- Only agree to pay off debts at a rate that you can keep up – don’t offer more than you can afford.
- Contact those who you owe money to as soon as possible. Let them know that you are having problems. Many companies will be helpful if you talk to them.
- If organisations won’t accept your repayment offers, seek advice.
- If you get a threatening letter, get advice from your local Citizens Advice Bureau or trading standards service.
- If a debt collector calls at your home, you don’t have to let them in. If you want time to get advice arrange a later appointment. If a debt collector or lender harasses you contact your local Citizens Advice Bureau or trading standards service.
- Check if a loan will be secured on your home. If it is and you do not keep up repayments you could lose your home. If you do not understand the terms of a loan get advice.
- If you’re thinking of taking out a new loan to pay off debt, make sure you find out the total cost of the loan, not just the monthly repayments.
- Think very carefully before borrowing more to pay off your debts. Get impartial advice and don’t rush into signing anything you don’t understand.
- If you are thinking of using a fee-charging debt management company, then make sure you understand exactly what you are signing up to – check what fees you will be paying to a debt management company and how long it will take you to pay off your debts.
- Keep copies of all letters you send and receive about your debts.
(OFT, 2005)
6 Conclusion
This course has explored personal debt within the UK. In Section 2, we examined overall levels of debt, before going on to explain how debt affects different households in different ways. Specifically, low-income households and families with children are more likely to get into difficulties, mostly linked to unsecured debt. We also noted how the number of people with debt problems increased in the late 2000s as circumstances in the economy led to many households having their available incomes reduced. Section 3 also explored the different costs associated with debt and highlighted the role of APR in making cost comparisons. The position of debt as a liability and the interrelationship between such liabilities and expenditure was explained in Section 4. Section 5 investigated the issues related to funding a purchase through debt, and again highlighted the role of an individual’s social and economic circumstances in shaping available choices.
References
Please note that some of the links below may no longer be valid because of the reorganisation of government departments and agencies.
Bank of England (2010a) ‘Table A5.2 Total lending to individuals: net lending’; ‘Table LPMVTXC Monthly amounts outstanding of total sterling net lending to individuals and housing associations’ and ‘Table LPQVZRI Quarterly amounts of total sterling net unsecured lending to individuals’ [online], http://www.bankofengland.co.uk/ statistics/ ms/ 2005/ may/ index.htm#a (Accessed 23 August 2010).
Bank of England (2010b) ‘Trends in lending’(August), Bank of England. http://www.bankofengland.co.uk/ publications/ other/ monetary/ TrendsAugust10.pdf (Accessed 8 March 2011).
BBC News (2010) ‘“Unfair” bank charges to be banned, government proposes’ [online], http://www.bbc.co.uk/ news/ 10130671 (Accessed 23 August 2010).
Ben-Galim, D. and Lanning, T. (2010) ‘Strength against shocks: low-income families and debt’, Institute for Public Policy Research, London. http://www.ippr.org.uk/ members/ download.asp?f=%2Fecomm%2Ffiles%2Fstrength%5Fagainst%5Fshocks%2Epdf (Accessed 8 March 2011).
Bridges, S. and Disney, R. (2004) ‘Use of credit arrears on debt among low income families in the United Kingdom’, Fiscal Studies, vol. 25, no. 1, pp. 1–25.
Brown, S., Taylor, K. and Price, S.W. (2005) ‘Debt and distress: evaluating the psychological cost of credit’, Journal of Economic Psychology, vol. 26, pp. 642–3.
Browne, Lord J. (2010) ‘Securing a sustainable future for higher education: an independent review of higher education funding and student finance’ [online], www.independent.gov.uk/browne-report (Accessed 26 October 2010).
Citizens Advice (2003) In too Deep: CAB Clients’ Experience of Debt, Citizens Advice and Citizens Advice Scotland [online], http://www.citizensadvice.org.uk/ in-too-deep.pdf (Accessed 20 December 2005).
Citizens Advice (2009a) Annual Report and Accounts, p. 1. London. http://www.citizensadvice.org.uk/ index/ aboutus/ publications/ annualreports/ ar_10.htm (Accessed 8 March 2011).
Citizens Advice (2009b) ‘A life in debt: the profile of CAB debt clients in 2008’, p. 10, Social Policy Department, London.
Citizens Advice (2009c) ‘A life in debt: the profile of CAB debt clients in 2008’, p. 4, Social Policy Department, London.
Communities and Local Government (2010) ‘Repossessions hit two-year low’ [online] http://www.communities.gov.uk/ newsstories/ housing/ 1714361 (Accessed 8 March 2011).
Competition Commission (2005) Store Cards – No Competitive Pressure on APRs and Insurance Charges, News Release, 14 September [online], http://www.competition-commission.org.uk/ press_rel/ 2005/ sep/ pdf/ 57-05.pdf (Accessed 21 December 2005).
Council of Mortgage Lenders (CML) (2010) ‘Fixed rate mortgages gained in popularity in June’ [online], http://www.cml.org.uk/ cml/ media/ press/ 2682 (Accessed 26 October 2010).
Credit Action (2010a) ‘Debt statistics’ [online] http://www.creditaction.org.uk/ helpful-resources/ debt-statistics/ 2010.html (Accessed 8 March 2011).
Credit Action (2010b) ‘Debt statistics: May 2010’ [online] http://www.creditaction.org.uk/ helpful-resources/ debt-statistics/ 2010.html (Accessed 8 March 2011).
Debelle, G. (2004) ‘Household debt and the macroeconomy’, BIS Quarterly Review, March, pp. 51–64.
Del-Rio, A. and Young, G. (2005) ‘The determinants of unsecured borrowing: evidence from the British Household Panel Survey’, Bank of England Working Paper Number 263, London, Bank of England.
Department for Business, Innovation and Skills (BIS) (2010) ‘Over-indebtedness in Britain: a DTI follow-up report’ [online] http://www.bis.gov.uk/ assets/ biscore/ consumer-issues/ docs/ 10-829-over-indebtedeness-first-report.pdf (Accessed 6 April 2011).
Department of Trade and Industry (DTI) (2004) Tackling Over-indebtedness: Action Plan 2004 [online], http://www.dti.gov.uk/ ccp/ topics1/ pdf1/ overdebt0704.pdf (Accessed 20 December 2005).
Department of Trade and Industry (DTI) (2005) Over-Indebtedness in Britain: A DTI Report on the MORI Financial Services Survey 2004 [online], http://www.dti.gov.uk/ ccp/ topics1/ pdf1/ debtdtionmori.pdf (Accessed 20 December 2005).
Furnham, A. and Argle, M. (1998) The Psychology of Money, London, Routledge.
Gross, D.B. and Souleles, N.S. (2002) ‘Do liquidity constraints and interest rates matter for consumer behavior? Evidence from credit card data’, The Quarterly Journal of Economics, vol. 117, pp. 149–85.
Hellebrandt, T. and Young, G. (2008) ‘The financial position of British households: evidence from the 2008 NMG Research survey’, Bank of England Quarterly Bulletin, Quarter 4, pp. 384–2.
HouseWeb (2010) ‘UK interest rates’ [online], http://www.houseweb.co.uk/ house/ market/ irfig.html (Accessed 4 November 2010).
Independent (2010) ‘Debt is a feminist issue: Huge leap in bankruptcy among women’ 25 July http://www.independent.co.uk/ news/ uk/ home-news/ debt-is-a-feminist-issue-huge-leap-in-bankruptcy-among-women-2034991.html# (Accessed 7 march 2011).
Kempson, E., McKay, S. and Willitts, M. (2004) ‘Characteristics of families in debt and the nature of indebtedness’, Research Report No. 211, London, Department for Work and Pensions.
Lury, C. (2004) ‘Everyday life and the economy’, in Bennett, T. and Watson, D. (eds) Understanding Everyday Life, Oxford, Blackwell.
Office of Fair Trading (OFT) (2005) Money and Credit – Tips on Debt [online], http://www.oft.gov.uk/ consumer/ money/ tips.htm (Accessed 19 December 2005).
Office for National Statistics (ONS) (2009) ‘Household wealth in GB £9 trillion in 2006/08’, News Release, 10 December 2009, p. 1. [online] http://www.statistics.gov.uk/ pdfdir/ wealth1209.pdf (Accessed 8 March 2011).
Office for National Statistics (ONS) (2010a) ‘Gross domestic household income’ [online] http://www.statistics.gov.uk/ statbase/ TSDdownload2.asp (Accessed 4 November 2010).
Office for National Statistics (ONS) (2010b), Retail Prices Index: quarterly index numbers of retail prices 1948–2010 (RPI) (RPIX), http://www.statistics.gov.uk/ statbase/ expodata/ files/ 5081012911.csv (Accessed 17 February 2011).
Office for National Statistics (ONS) (2010c) ‘London clearing banks base rate’, http://www.statistics.gov.uk/ statbase/ TSDdownload2.asp (Accessed 17 February 2011).
Oxera (2004) Are UK Households Over-indebted?, Oxford, Oxford Economic Research Associates.
Social Justice Policy Group (2007) ‘Breakthrough Britain: ending the costs of social breakdown’, Volume 5: serious personal debt, p. 13 [online], http://centreforsocialjustice.org.uk/ client/ downloads/ debt.pdf (Accessed 2 November 2010).
The Guardian (2004) ‘Landmark ruling as judge erases couple’s debt’, 28 October [online], http://money.guardian.co.uk/ creditanddebt/ debt/ story/ 0,1456,1338330,00.html (Accessed 21 December 2005).
The Guardian (2005) ‘Court cancels debt that grew from £6,000 to £380,000’, 28 July [online], http://money.guardian.co.uk/ creditanddebt/ story/ 0,1456,1537662,00.html (Accessed 21 December 2005).
The Times (2008) ‘City high-flyers are paid too much, argues Archbishop of Canterbury’, 26 April [online], http://www.timesonline.co.uk/ tol/ comment/ faith/ article3815777.ece (Accessed 17 January 2011).
Tudela, M. and Young, G. (2005) ‘The determinants of household debt and balance sheets in the United Kingdom’, Bank of England Working Paper no. 266, London, Bank of England.
UK Parliament (2003) Report Published on Transparency of Credit Card Charges, Treasury Committee Press Notices, 17 December [online], http://www.parliament.uk/ parliamentary_committees/ treasury_committee/ tc171203_04.cfm (Accessed 20 December 2005).
YouGov (2006) ‘Survey for the Social Justice Policy Group’ cited in Social Policy Justice Group (2007) ‘Breakthrough Britain: ending the costs of social breakdown’, Volume 5: serious personal debt, p. 14 [online], http://centreforsocialjustice.org.uk/ client/ downloads/ debt.pdf (accessed 2 November 2010).
Glossary
- Annual Percentage Rate (APR)
- APR or Annual Percentage Rate is a summary figure for comparing debt costs which brings together interest rates and other charges.
- Assets
- Everything that a person owns that has a monetary value (e.g. property, investments or cash).
- Compounding
- The process by which interest repayments are added to the original amount borrowed to give a higher total figure which, in turn, attracts interest rate charges.
- Credit
- An arrangement to receive cash, goods or services now and to pay for them in the future.
- Cyclical
- A recurring pattern of a variable over time showing peaks and low points at regular intervals.
- Equity
- Equity in a property is the excess of the market value of the property over the outstanding mortgage debt secured against it.
- Equity withdrawal
- The process whereby mortgage levels are increased to release funds for additional spending.
- Interest
- The charge a borrower pays for the use of someone else’s money.
- Interest rate
- The exact price that a borrower pays for debt, normally expressed as an annual percentage.
- Liability
- An amount of money owed at a particular point in time.
- Mortgage
- A loan secured on property or land.
- Net worth/net wealth
- The value of all assets minus all liabilities.
- Overdraft
- A facility provided by banks and some building societies which allows customers to go into debt on their current account.
- Principal sum (or capital sum)
- The original amount of debt taken out.
- Secured debt
- Debt secured against an asset such as a home. If the debtor fails to make adequate repayments, the lender has a right to obtain money by selling the asset.
- Term
- The period of time over which a debt is to be repaid.
- Unsecured debt
- Debt not backed by any asset.
Acknowledgements
This course was written by Martin Upton.
The material acknowledged below is Proprietary, used under licence and not subject to Creative Commons licensing. See terms and conditions. Grateful acknowledgement is made to the following:
Course image: ©Rosemary Calvert/Getty Images.
Photographs
Figure 3: Courtesy of www.moneysupermarket.com; Figure 4: Copyright © Des Jenson/Photoshot; Figure 10: Courtesy of the Advertising Archives; Figure 11: Copyright © Marcus Clackson/iStockphoto.com; Figure 12 left: Courtesy of Consumer Credit Counselling Service www.cccs.co.uk; Figure 12 right: Courtesy of Citizens Advice Bureau.
Don't miss out:
If reading this text has inspired you to learn more, you may be interested in joining the millions of people who discover our free learning resources and qualifications by visiting The Open University - www.open.edu/ openlearn/ free-courses
This free course is adapted from a former Open University course called 'You and your money(DB123)'