Migration
Use 'Print preview' to check the number of pages and printer settings.
Print functionality varies between browsers.
Printable page generated Thursday, 25 April 2024, 3:22 PM
Migration
Introduction
This course introduces migration in animals, with special reference to birds and also introduces the integrated biological themes of movement, selection and homeostasis.
Movement is a facet of the life of animals and many migrate as part of their life cycle. The familiar movements of migratory birds follow a seasonal pattern and individuals complete round trips between different geographical locations. Figure 1 is a word cloud that represents concepts associated with migration.
This OpenLearn course is an adapted extract from the Open University course S295 The biology of survival.

Learning outcomes
After studying this course, you should be able to:
describe some of the migratory journeys made by birds and other animals
explain the process of adaptation by natural selection and how this results in evolution
describe what is meant by homeostasis, with particular reference to how migratory birds regulate body temperature in order to conserve energy
provide examples of the use of celestial and magnetic cues for navigation by migratory birds
1 Introduction to movement and migration
Not all animals migrate in the same way as birds. The mass migrations of locusts do not involve a round trip for any individual, for their life cycle is shorter than the seasonal cycle. The round trip of the monarch butterflies (Danaus plexippus, Video 1) that migrate between North America and Mexico takes more than one generation to complete.
Transcript: Video 1 Monarch butterfly migration.
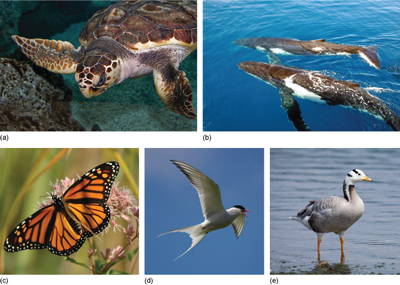
The distances travelled during migration can be immense. Table 1 lists a few of the more spectacular journeys, and the animals that undertake them are shown in Figure 2.
| Record | Species | Distance |
|---|---|---|
| Longest recorded journey in water | leatherback turtle (Dermochelys coriacea) | 20 558 km in 647 days (Indonesia to Oregon, USA) |
| Longest mammal migration | humpback whale (Megaptera novaeangliae) | up to 8500 km each way |
| Longest insect migration | monarch butterfly (Danaus plexippus) | up to 4750 km in the autumn (North America to Mexico) |
| Longest recorded round-trip | arctic tern (Sterna paradisaea) | 70 900 km (North to South Pole) |
| Highest altitude migration | bar-headed goose (Anser indicus) | 9000 m above sea level |
1.1 Examples of animal migration
The humpback whale travels further than any other mammal (Video 2).
Transcript: Video 2 The humpback whale (Megaptera novaeangliae).
Travelling long distances over land may mean coping with a changing terrain. The migratory route of the bar-headed goose (Anser indicus) takes it over the peaks of the Himalayas at an altitude of around 9000 m (Video 3). The altitude record for a bird is 11 227 m, held by a griffon vulture.
Transcript: Video 3 The bar-headed goose.
[MUSIC PLAYING]
[GEESE HONKING]
[HONKING AND CHEEPING]
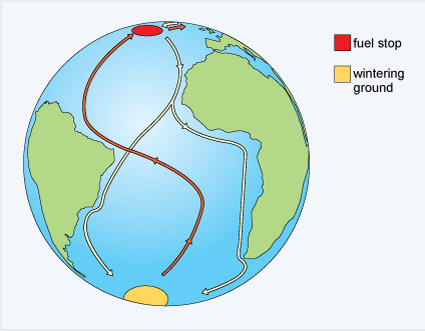
Even with a long distance to cover, the arctic tern does not take a direct route and also makes a stop in the North Atlantic to feed on plankton (Figure 3).
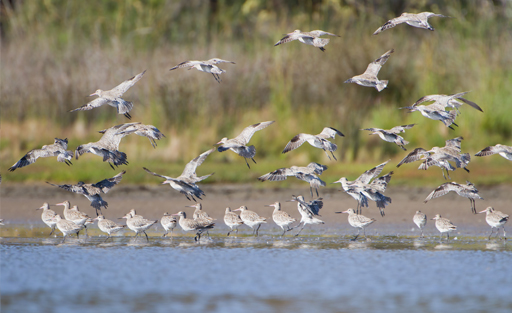
One of the most amazing of all bird migrations is undertaken by the bar-tailed godwit (Limosa lapponica), a wading bird, frequently found in marshes or mudflats where it forages for food (Figure 4).
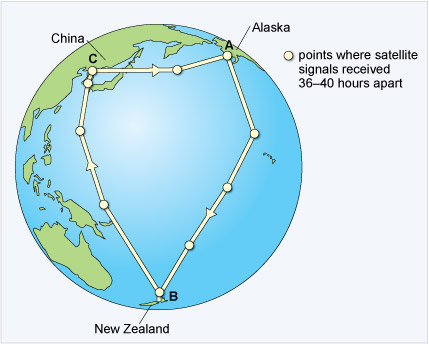
It has been possible to tag individuals with satellite transmitters that encode position data on a radio signal, a process called telemetry. The data obtained from one bird showed that it had travelled 11 680 km (7258 miles), non-stop, over nine days to reach New Zealand from the Alaskan breeding grounds (Figure 6). This bird (E7) flew at an average speed of 56 km per hour (34.8 miles per hour) at an altitude of 3000-4000 m. Along the way, she lost more than half her body mass. The reasons for this extraordinary journey are the same for the majority of bird and other animal migrations - to increase both survival and reproductive success.
For some species, there may be no opportunity to learn a route prior to setting off. Young ospreys born on Martha's Vineyard, an island off the east coast of Massachusetts, do not migrate with their parents but set off alone to spend the winter in Central or South America (Video 4). They are thought to find their way by flying southwards, keeping over land. It may be 18 months before they make the return trip.
Transcript: Video 4 The ospreys of Martha's Vineyard.
[MUSIC PLAYING]
[MUSIC PLAYING]
2 Bird migration
The remarkable migratory behaviours of some bird species provide excellent experimental systems for studying the underlying processes, and the results have a much wider application to the study of migration than just bird behaviour. Studies on genetics, the influence of magnetic fields and physiological processes behind homeostasis illustrate general principles, but as birds have attracted so much scientific attention, they provide some of the best examples of migration studies.
Although migration is widespread amongst bird species, not all species are migratory and in some species, not all populations of the same species migrate and sometimes not all members of a population migrate. For example, in many regions, including the British Isles, some populations of birds are residents all year round and do not migrate. Other populations exhibit partial migration, where some individuals of the population in the same breeding areas remain all year round while others migrate to overwinter elsewhere..
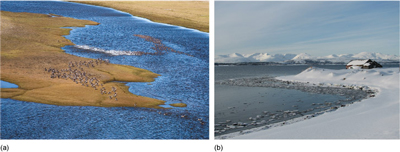
Migration occurs to some degree in most bird species that live in seasonal environments. It is prevalent because in such environments (e.g. the Arctic tundra) food supplies vary markedly throughout the year, changing from abundance during the summer to scarcity during the winter (Figure 6).
Generally speaking, birds time their migrations so that they are present in breeding areas during periods of food abundance and are absent during periods of scarcity.
In lowland tropical forests, where food supplies remain stable throughout the year, many birds that breed there remain all year. However, these forests also receive a seasonal influx of other bird species from higher latitudes which migrate from colder regions for the winter.
This means that worldwide, up to half of the 10 000 or so species of birds, totalling about five billion individuals, are thought to migrate every year on return journeys between breeding and non-breeding areas.
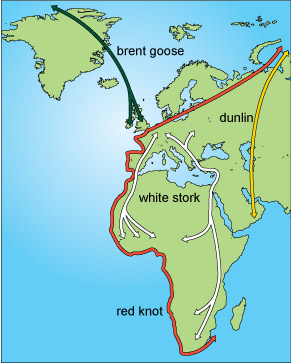
Because migration is between warm and cool habitats, birds move mainly on a north-south axis. Some, however, have an easterly or westerly component to their movements, especially those that breed in the central areas of the northern landmasses and move to the warmer edges for winter. Figure 7 shows some examples of different migration routes used by birds.
The patterns of bird migration are very diverse. Passerines are perching birds (Figure 8). They make up almost half of all bird species and some of the small passerines travel at night.
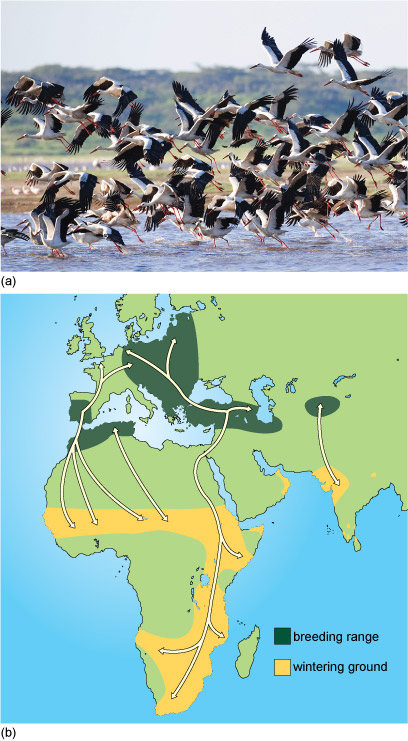
The mass migration of large storks is a spectacular sight during daylight (Figure 9).
In contrast, individuals of some species travel alone.
When the routes taken by migrating birds are plotted on a map, many long-distance migration routes are found to be clustered together, as the next section describes.
2.1 Migration paths and flyways
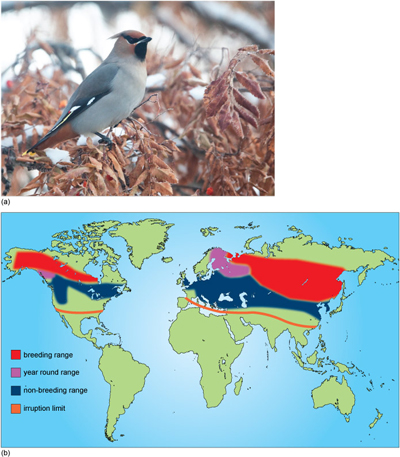
Birds that migrate are generally categorised as short-distance migrants or long-distance migrants. Short-distance migrants (e.g. waxwings) usually fly overland, within continents: for example, across several states in the USA and Canada or within Europe (Figure 10).
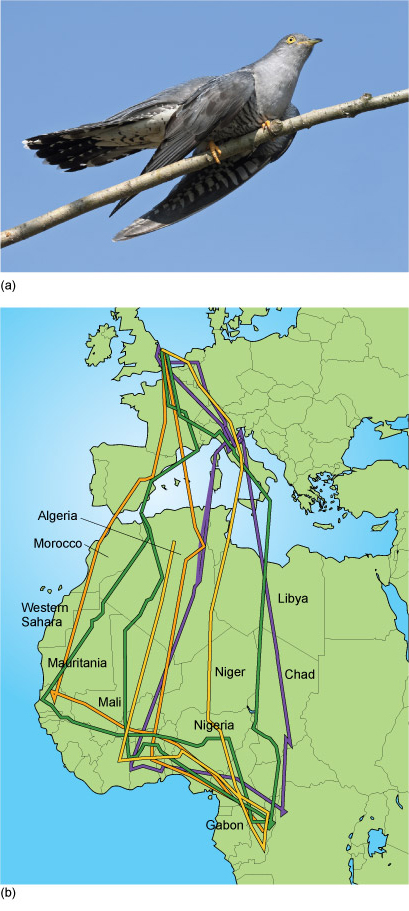
Long-distance migrants, on the other hand, cross continents and their journeys often involve substantial sea crossings (Figure 11).
The division into two categories is really a matter of convenience, since these two categories merge into each other and there is continuum of variation in the distance travelled.
Would you classify white storks (Figure 9) as long- or short-distance migrants?
White storks are long-distance migrants, as they fly mainly from Europe to Africa and hence cross continents.
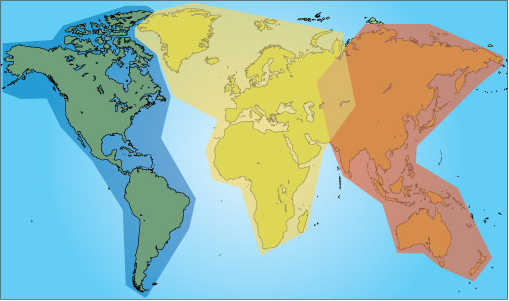
Long-distance migrants commonly use a migration corridor which is known as a flyway. Flyways are invisible highways or corridors which cross several continents. There are three main global flyways for migrating birds (Figure 12).
Although the small number of flyways suggests strong similarities between the behaviour of migrating bird species, there are actually lots of differences in, for example:
- timing of migration
- stops along the way
- triggers for migration.
This variation has been the subject of many studies on the evolution of migratory behaviour. Before examining some of these studies, it is useful to look at the two main processes that underlie all aspects of evolutionary biology: adaptation and natural selection.
Studies have shown that variation in many aspects of migratory behaviour has a genetic basis and are subject to natural selection, including the urge to migrate, the timing and direction of migration and migratory distance. Changes in migratory behaviour are adaptive. The next section looks at the different ways in which natural selection can result in adaptive evolution of behavioural and/or morphological traits.
3 Introduction to natural selection
Evolution is central to biology and natural selection is the mechanism that produces adaptation.
In a single sentence, write down what you understand by the term 'adaptation'.
An adaptation is a morphological, physiological, biochemical, developmental or behavioural trait that gives an organism a greater ability to survive and reproduce in a particular environment.
For selection to occur there must be variation within a population, because if every individual is identical, there is nothing for selection to act upon. So, for example, there is variation in beak size in finches and those individuals with beaks well-suited to a particular size of seed do better than others in the population and therefore are selected for.
Write down a few sentences that illustrate your understanding of natural selection.
Natural selection refers to the differential survival and/or reproduction of organisms due to their physical attributes or phenotype. The concept of selection is central to the theory of evolution by means of natural selection, formulated by Charles Darwin, which forms the cornerstone of many explanations of animal behaviour.
What three criteria must be met within a population of interacting individuals in order for natural selection to occur?
The three criteria are:
- there must be phenotypic variation
- phenotypic variation must be genetically determined (so that it can be inherited)
- phenotypic variation produces variation in some component of fitness, such as survival or mating success, and is ultimately expressed as differential reproductive success.
There are three kinds of natural selection that will be considered in this course. How the frequencies of phenotypes within a population change in response to these forms of natural selection is shown in the accompanying figures.
3.1 Directional selection
Directional selection occurs when conditions favour individuals expressing one extreme of a phenotypic range, thereby shifting a population's frequency distribution for the phenotypic character in one direction or the other. For example, in long tailed widowbirds (Euplectes progne, Figure 13a) males with long tails have a reproductive advantage over males with shorter tails because females prefer to mate with males with long tails. Directional selection therefore favours long tails and may shift the distribution of the population so that tail length increases over time (Figure 13b).
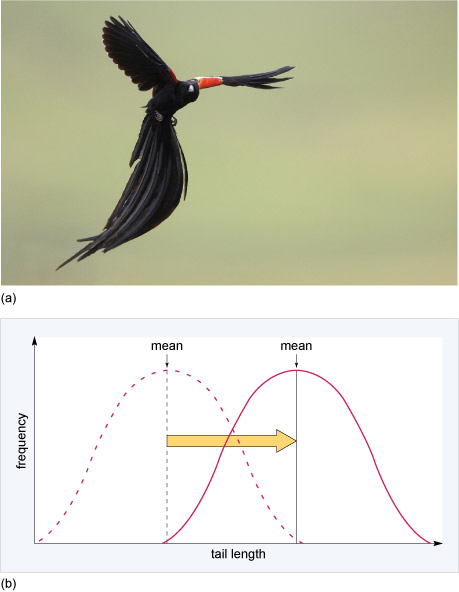
If shorter tailed males were more successful in attracting and mating with females than long tailed males, in which direction would the mean tail length shift?
Tail length would shift to the left, that is, towards shorter tail length.
With respect to migration, studies have shown that under strong directional selection, populations can switch from sedentary to migratory or vice versa relatively quickly and that factors such as climate change could lead to the evolution of sedentariness in many bird populations that are currently migratory.
3.2 Stabilising selection
Stabilising selection occurs where there is an optimal value for the trait of interest. This means that selection acts against both extreme phenotypes and favours intermediate variants which have the highest fitness (survive to reproduce). For example, goldenrod gall flies (Eurosta solidaginis, Figure 14a) lay their eggs individually in developing shoots of the tall goldenrod plant (Solidago sp.). The fly larva that hatches from the egg makes a chemical that causes the plant tissue to swell around it, and the result is a mass of plant tissue called a gall (Figure 14b), which serves as a home for the larva. Downy woodpeckers attack large galls and eat the gall fly larva. Parasitic wasps lay eggs inside small galls and the wasp larvae that hatch from the eggs eat the gall fly larva when it hatches. Only galls of intermediate size remain intact because the wall of the gall is too thick for the ovipositor of a parasitic wasp to penetrate, and the size of the gall and hence the larva within makes it less attractive to woodpeckers than a larger gall containing a larger larva and hence a larger meal. So, selection pressures act on gall size and only larvae in galls of intermediate size survive (Figure 14c).
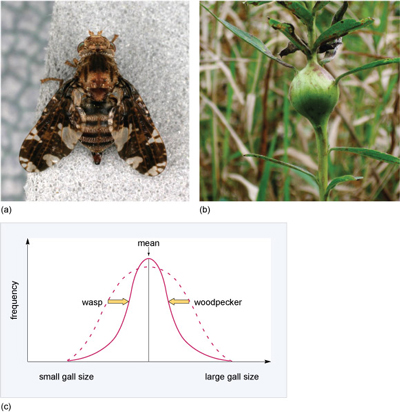
Under stabilising selection, what happens to the amount of variation in the size of galls in the population?
The amount of variation decreases; that is, there is a decrease in the range of gall sizes.
3.3 Disruptive selection
Disruptive selection in which selection favours individuals with the smallest and largest values of the trait. These individuals have the highest fitness and individuals with intermediate values are at a fitness disadvantage. One example of this type of selection involves feather colour in male lazuli buntings (Passerina amoena), a bird species native to North America (Figure 15a). The feather brightness of males varies, ranging from brown to bright blue. In a habitat with limited nesting sites, both the dullest and the brightest yearling males are more successful in obtaining high quality territories and therefore attract females. This is because adult males tolerate non-threatening dull yearlings and also leave brightly coloured yearlings alone. Because of their dominance, both these groups are able to establish territories and attract females but yearling males with intermediate plumage are attacked by adults and therefore fail to obtain territories and mate (Figure 15b).
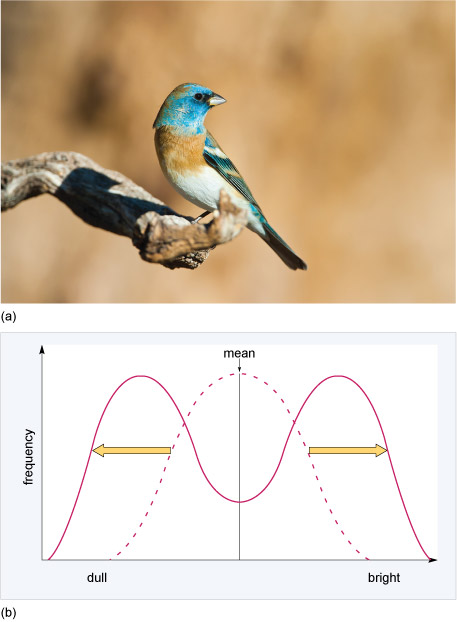
What effect does disruptive selection have on variation in plumage brightness?
It increases variation (increases the range of plumage colour).
Each kind of selection alters the mean of and/or variance in (amount of variation) of the phenotypic trait in a population or species. In the long term, directional selection and disruptive selection can have the most dramatic evolutionary impact and can lead to the formation of a new type from an existing type, the process of speciation.
This contrasts with the action of stabilising selection, which maintains the existing type without change in mean phenotype over long periods of time. Stabilising selection eliminates the extremes in a distribution of phenotypes, and as such it leads to a refinement of the existing type.
Because the trait under selection has a genetic basis, the differential reproduction of individuals carrying the genetic variants - the alleles - that underlie the trait (e.g. body size) results in a change in the frequencies of genetic variants by selection processes. Genetic variants that underlie phenotypes that are reproductively successful will increase in frequency, while those that underlie phenotypes that are not successful in reproducing will decrease. Thus, genetic changes across generations result from differences in reproductive success of genetically determined phenotypes.
3.4 Natural selection in Darwin's finches
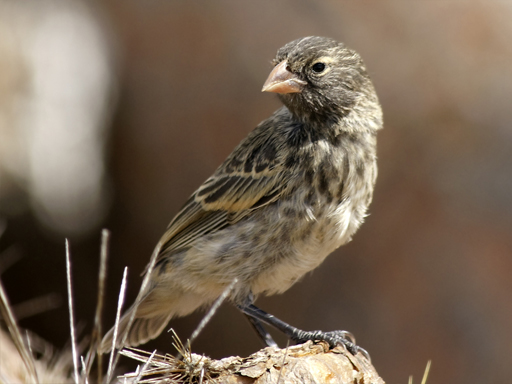
An influential study of natural selection in birds illustrates how effective, and rapid, natural selection can be. Scientists Peter and Rosemary Grant studied the medium ground finch (Geospiza fortis, Figure 16) over a long period of time, on the Galápagos island of Daphne Major. See also Video 5.
Transcript: Video 5 An introduction to Darwin's finches.
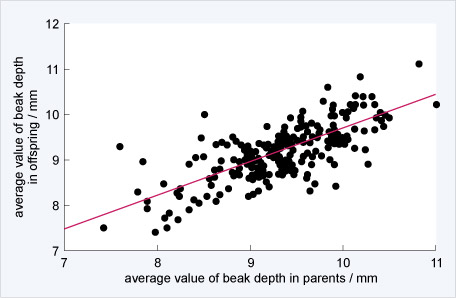
In these finches, beak size is heritable, meaning that adults with large beaks pass large beak size onto their offspring. Figure 17 illustrates this relationship.
During 1977 there was a major drought on Daphne Major and many of the plants on the island produced few or no seeds. The medium ground finch population, which depends on seeds for food, declined drastically from about 1400 individuals to a few hundred in just over two years.
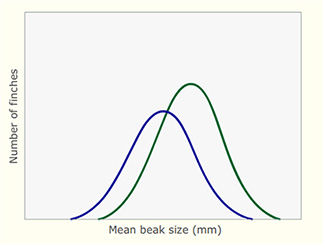
What the Grants' research group observed was that following the drought the population of finches had recovered; but now, the average size of the beaks was larger. The underlying reason for this was that during the drought, small seeds were exceedingly rare but large seeds with thick husks were still available. Only the large birds with large beaks were able to crack open the husks and eat the contents of the seeds. Smaller birds with smaller beaks were unable to do so and therefore starved. From this differential pattern of death, there was a rapid change in the finch population. Figure 18 illustrates how natural selection caused a rapid change in the size of the beaks in the finch population following the drought.
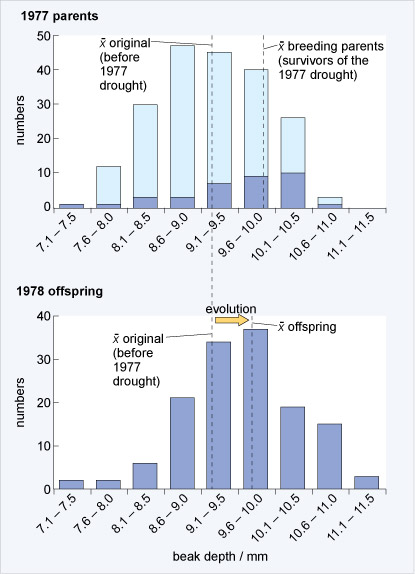
What was the difference in average beak size of all adults before the drought in 1977 and the average beak size of adults that survived the drought?
Before the drought, the average size of adult beaks was 9.2 mm. The average beak size of adults that survived was 9.9 mm.
Explain how the average beak size of birds changed from before the drought in 1977 to after the drought in 1978, once the population had recovered and started to breed again.
Before the drought, the average size was around 9.2 mm. After the drought, it shifted to around 9.7 mm.
Taking the information from Figures 17 and 18 into account, explain how natural selection could have caused an increase in beak size in this population of ground finches.
The adult survivors of the drought were the ones with the largest beaks because they could still crack large seeds. These birds then mated and because beak size is heritable and is passed on to offspring, the chicks from these birds inherited large beak size. Birds with large beaks therefore produced a large fraction of the next generation and because of this, the average size of beaks of medium ground finches increased quickly within the population.
What type of selection is operating in this example?
Directional selection.
What is important to note here is that the genetic variation that underlies differences in beak size was already present in the population. As a consequence of natural selection, the frequency of genetic variants that expressed the larger beak size increased in the population and those variants that expressed smaller beak size declined in frequency and may even be lost from the population.
From this example, you can see how dramatic changes can occur in a population as a result of natural selection. You can also see how careful observation by the Grants over consecutive years allowed them to capture empirical evidence of natural selection.
Activity 1 Finch beak size and population distribution
Use the resources to answer the interactive questions on finch population distributions.
During their migratory journeys, birds encounter extremes of temperature, storms, changes in altitude and shortage of food and water. Birds have evolved a suite of remarkable physiological adaptations to deal with these changes in the external environment. Before discussing some of these adaptations, how organisms in general maintain a constant internal environment is explored, a process known as homeostasis.
4 Introduction to homeostasis
Organisms have the remarkable ability to regulate their internal environment, and maintain a favourable state even if the external environment changes. Normal functioning involves a self-regulating mechanism whereby any deviations from optimum conditions tend to cause responses that return the system to this state. The ability of an organism to regulate its internal environment is the result of a suite of physiological processes, called homeostasis. Homeostatic mechanisms regulate many different aspects of physiology, including temperature, concentrations of dissolved oxygen, carbon dioxide and sugar, osmotic pressure, redox potentials and pH.
The methods used to maintain body temperature can be divided broadly into two types. Animals that rely predominantly on internal metabolic processes as a source of heat energy generally maintain a stable body temperature that is precisely regulated. They are known as endotherms or homeotherms. Those animals that rely on external sources of heat energy may maintain a relatively stable and precisely regulated body temperature, as long as external heat energy is available, but will be unable to do so when it is absent. These ectotherms or poikilotherms are able to tolerate a substantial lowering of body temperature, which endotherms generally cannot. Birds and mammals are endotherms; all other animals are ectotherms, with a few species specific exceptions.
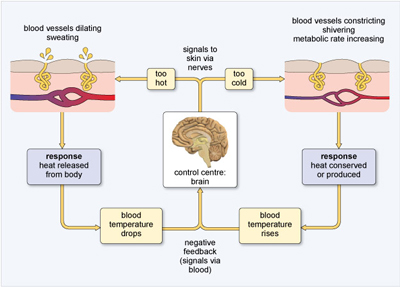
When ambient temperatures fall so low that heat loss to the environment threatens to lower body temperature, endotherms use several strategies to supplement and conserve body heat. Specialised nerve cells detect a drop in temperature and relay this information to the brain. Shivering is initiated in muscles, warming them and the blood flowing through them. This response is an example of negative feedback (Figure 19), where a control mechanism reacts to a change in the output of the system by initiating a restoring action. If the brain detects that body temperature is not optimal, then actions are triggered that will restore homeostasis.
Negative feedback systems maintain a preset state and so are stabilising - an important feature of homeostasis.
The amount of energy an organism uses in a unit of time is called its metabolic rate. Metabolic rate can be determined by the amount of oxygen consumed or carbon dioxide produced by cellular respiration. Organisms must maintain a minimum metabolic rate for basic functions such as cell maintenance, repair and internal transport. The minimum metabolic rate of a homeotherm is known as the basal metabolic rate (BMR).
Basal metabolic rate is measured under a temperature range that does not require the generation or shedding of heat above the minimum. In other words, it does not involve thermoregulation because external temperatures do not diverge from comfortable limits. The range of temperatures over which BMR is maintained comprise the thermoneutral zone (Figure 20). When external temperatures exceed or drop below those within the thermoneutral zone, physiological changes such as those initiated by shivering or sweating are deployed to maintain body temperature within the thermoneutral zone.
However, thermoregulation causes an increase in BMR and this increase in BMR sets the limit of what temperatures can be tolerated beyond the thermoneutral zone. When ambient temperatures fall below the thermoneutral zone (lower critical temperature), heat production must increase and/or heat loss must decrease. Above the thermoneutral zone (upper critical temperature), heat loss must increase and must also cope with the rise in BMR that is a consequence of rising body temperature. Maintaining a constant temperature therefore makes a constant demand on either the biochemical processes of heat production and/or the physical mechanisms for heat loss. Figure 20 illustrates the effect of rising ambient temperature on BMR, shown as oxygen consumption, and heat loss which is a combination of evaporative water loss and peripheral blood flow changes, i.e. dilation.
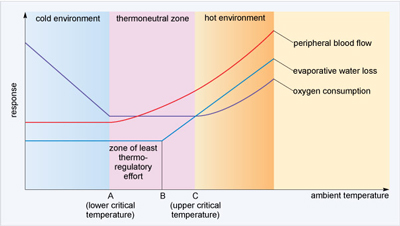
In the thermoneutral zone, what happens to BMR?
It stays constant at a low level. Therefore thermoregulation is achieved at minimal metabolic cost in the thermoneutral zone.
Thermoregulation is critical for survival because most biochemical and physiological processes are sensitive to changes in temperature. For every 10 °C decrease in temperature the rates of most enzyme-mediated reactions decrease two- to threefold. A substantial decrease in temperature (hypothermia) can result in such a decrease in overall metabolic rate that it causes a breakdown in normal cellular function and eventually death. Increase in temperature (hyperthermia) conversely speeds up reactions and causes an increase in metabolic rate. It may also cause proteins (including, of course, enzymes) to become less active through denaturation of their structure.
Rüppell's fox is nocturnal. During the day when the ambient temperature is around 40 °C the fox rests inside the underground den. At night the fox emerges and forages for reptiles and insects. What advantage does the nocturnal life style offer the fox?
Resting in the den during the day avoids the need for physiological thermoregulation such as panting. At night the ambient temperature is much lower. By emerging to hunt at night the fox reduces the need for evaporative water loss and minimises energy consumption for thermoregulation.
4.1 Thermoregulation in migratory birds
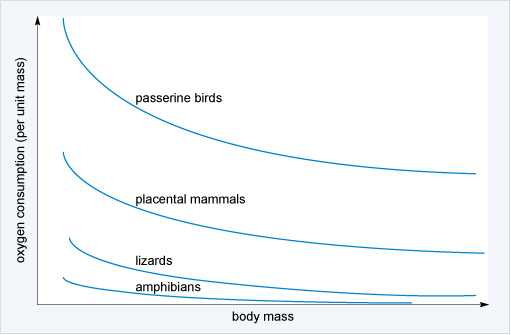
Compared with mammals, birds have high basal metabolic rates, using energy at higher rates (Figure 21), and also higher body temperatures. Metabolic rates lie within a range of values between a minimum value, the basal metabolic rate (BMR), and the summit metabolic rate, when the bird is under the greatest physiological stress. Passerines tend to have higher BMR values than non-passerines. The smallest birds, hummingbirds, have the highest BMRs of all birds. In general, BMR is related to mass per unit surface area, with larger organisms, which have larger mass per unit area, expending less energy per unit mass than smaller ones.
In general, body temperatures of birds range from about 38 °C to 44 °C. Body temperatures of large flightless birds (e.g. emu and ostrich, Figure 22a) and some aquatic birds (e.g. penguins) are at the lower end of this range and within the range of mammals. The house sparrow (Figure 22b) has a body temperature of 43.5 °C.

To maintain temperature within the thermoneutral zone requires energy which for most organisms is a precious resource. Migratory birds in particular have tight energy budgets; to cover long distances without food means that migrating birds need to assimilate and conserve energy as much as possible before and/or during migration. The birds should avoid both heat and cold stress, as these use energy needed for flight, and they do so in a number of different ways.
In cases where individuals travel for long distances without drinking - for example, when crossing oceans or deserts - both thermoregulatory and osmoregulatory (water regulation) adjustments are required in order to conserve energy and water. Before migration, birds increase food intake, sometimes doubling their mass (pre-migratory fattening). Much of this food is stored as lipid, which, when metabolised, produces carbon dioxide and also water (which can contribute to water balance).
Some migrants enter regions where temperatures can become extreme. When crossing deserts, heat stress can become a problem due to the increased heat produced from persistent muscle contraction. To avoid overheating, many birds pant and some species may increase flight altitude to reach cooler conditions. However, some birds, especially small passerines, are unable to cross the Sahara Desert fast enough for a non-stop flight and must land during the heat of the day and rest to avoid overheating and dehydration.
At high latitudes and altitudes, ambient temperatures can be very low and so before migration, changes in feather covering and fat layers may be needed, reducing the energy used for thermoregulation and thus making more available for migration itself.
Some small passerines reach stopover sites that are very cold so that individuals are at risk of hypothermia. Some species have been observed to huddle at stopover sites and it has been suggested that this behaviour reduces energy expenditure and contributes to thermoregulation.
There is now increasing evidence that during and before migration, birds are able to lower their body temperature below ambient in order to conserve energy for the flight. Migrating passerines at stopover sites are thought to lower body temperatures by 8-10 °C during the night, conserving energy. Measurements of daily changes in body temperatures in migrating blackcaps appear to support this. Using radio telemetry at a stopover site at Midreshet Ben-Gurion, Israel, Wojciechowski and Pinshow (2009) showed that while at rest during a stopover, blackcaps can lower their body temperature by up to 10 °C below normal resting temperature at night and become hypothermic (Figure 23).
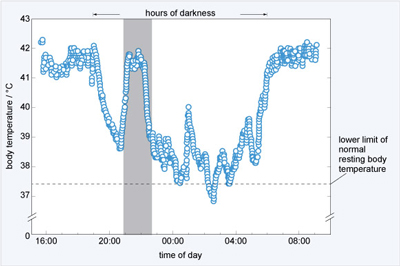
The effect of this is to reduce energy expenditure by as much as 30%. Blackcaps use protein as a fuel source during flight which is derived from the liver, gut, breast and leg muscles. Because of this, they arrive at stopover sites with atrophied liver and gut and during the initial stage of the stopover, their digestive efficiency is significantly lower than in the later part of the stopover. When they arrive therefore, birds may save energy by entering controlled hypothermia during cold nights until they are able to rebuild tissues and energy stores by foraging during the day.
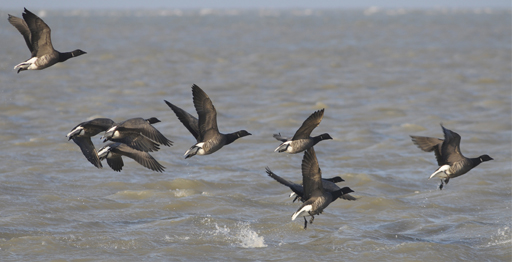
It is now known that many bird species allow body temperature to drop below normal resting levels at night. For example, it has recently been suggested that lowered body temperature might be an important mechanism of energy conservation in migrating brent geese (Branta leucopsis, Figure 24).
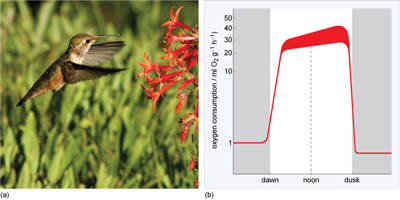
However, none have been observed to lower it to the same extent as hummingbirds, which undergo deep, mammal-like torpor with body temperature decreasing by as much as 30 °C and BMR by a substantial amount, as shown in Figure 25a. Studies on rufous hummingbirds (Selasphorus rufus, Figure 25b) show that they use torpor to conserve energy that can be used later for migration. So, unusually, they go into torpor even when fat reserves are high and they also may go into torpor for periods during migration.
Activity 2 Studying the physiology of migration
Homeostasis introduced the processes concerned with the regulation of body temperature, using migratory birds as an example. How can physiological information be obtained from birds that migrate long distances? Lucy Hawkes discusses her research on bar-headed geese with Brett Westwood, in an interview recorded for the BBC. Listen to the interview and makes notes about the environmental limitations that the bird faces and the adaptations in both behaviour and physiology that enable it to migrate.
Transcript: Audio 1 Heart rate monitoring of migrating geese.
The bar-tailed godwit undertakes a very long migration. How does the bird prepare for the journey? Phil Batley studies migration and has been tagging the birds to follow their progress. He discusses his research in an interview with Philippa Forrester, which you should listen to now. What particular physiological strategy do the birds adopt to prepare for the flight?
Transcript: Audio 2 Satellite tagging of migrating bar-tailed godwits.
One way of countering problems associated with energy expenditure and thermoregulation in migrating birds is to have good orientation and navigational skills. This does not necessarily involve finding the shortest way to a destination; and in fact sometimes physiological difficulties may be avoided by taking a roundabout route. For example, favourable winds and meteorological conditions can conserve energy by reducing the costs of thermoregulation and birds require exceptional navigational skills to take advantage of this. The next section will explore these skills.
5 Navigation
For most migrating birds, their journey is two-way and the need for navigational information is obvious. Sedentary birds that do not migrate do of course make short, localised trips - for example, to and from their nests. Nonetheless, these short trips form the basis from which the longer return movements that characterise migration can develop.
Although short trips may be facilitated by learning landscape features in the local area, travelling over long distances requires something more. Recall from Section 1 the young ospreys leaving Martha's Vineyard with no experience and no help from adult birds. Detailed landscape features would be of no help.
From what you have read, what gross landscape features probably guide the young ospreys?
If they distinguish between land and sea and only fly south over land, they will reach suitable feeding areas.
What other cues might be available to birds to help them navigate?
Possible navigation cues might be:
- celestial cues derived from the Sun, Moon and stars
- magnetic cues from the Earth's magnetic field
- the plane of polarisation of light
- chemical signals detectable as smells.
To navigate effectively, birds need an internal map and a compass. The internal map provides a bird with the general location of where it is relative to its homing or migration goal and the internal compass is required to guide its flight and keep it on course.
Birds are believed to use two kinds of maps for goal-directed orientation. The first of these is an olfactory map, suggested to be used by homing pigeons. This theory is still controversial.
The second hypothesis is that birds use a magnetic map to locate themselves in space. In fact, it is now believed that birds can use the Earth's magnetic field as a map and as a compass based on variation in the strength of the field and its inclination relative to the Earth's surface, respectively.
There are three types of compass that birds can use. The magnetic one has already been mentioned.
What two other compass cues might be available to birds?
The stars and the Sun both provide compass information that birds could use.
5.1 The star compass
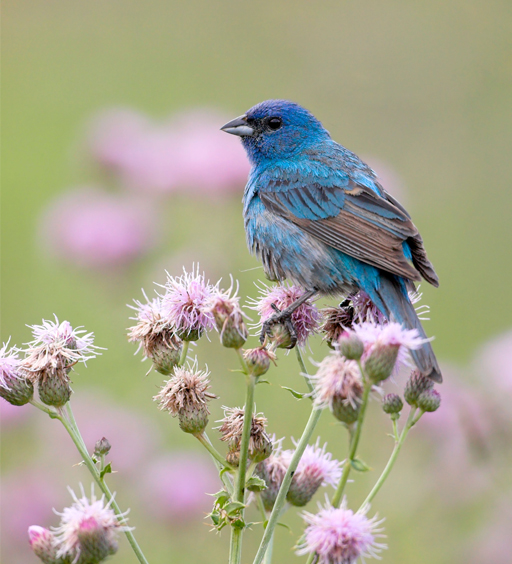
The stars are principally of value to nocturnal migrants and, of course, the sky has to be fairly clear. Experiments using caged birds show that their direction of take-off is correct on starry nights, but not on overcast nights when they become disorientated. In a series of classic experiments on North American indigo buntings (Passerina cyanea, Figure 26) where the location and movements of stars and constellations were manipulated in a planetarium, researchers showed that the buntings derive directional information from the pattern of constellations relative to each other and to the celestial pole. In other words, birds do not learn the star patterns themselves but learn to respond to a star pattern that rotates about a single conspicuous star.
The experiments also showed that birds needed experience of the night sky in order to orientate correctly in the planetarium.
5.2 The Sun compass
The use of the Sun for orientation by birds was first demonstrated in the 1950s with European starlings (Sternus vulgaris). Mirrors were used to alter the apparent position of the Sun and the birds then orientated to the apparent position rather than orienting in the correct compass direction.
Can birds use the Sun alone as a compass guide?
The Sun on its own is not sufficient, because it moves across the sky during the day; so to maintain a constant direction using the Sun as a guide, a bird needs an internal clock.
The internal clock maintains a cycle of about 24 hours and is reset by the light-to-dark cycle of the environment. So, the Sun is playing two roles:
- it acts as a marker from which direction can be deduced
- its regular cycle keeps the internal clock accurate.
The importance of an internal biological clock for use of the Sun compass has been demonstrated by 'shifting' the clock.
For example, the bearings of the flight direction of rock pigeons (Columba livia, Figure 27) kept for several days in a room where the 'artificial' photoperiod was shifted by six hours either forward or backward, differed from those of non-shifted pigeons by about 90 degrees.
6 The challenges of migration
In studying this course it will have become apparent that migration involves a diversity of behaviours and physiological adaptations, many of which are far from being fully understood. Birds such as arctic terns, which have a mass of around 100 g and yet can travel an average of 70 900 km in a year, challenge current understanding. New technology is adding more and more information about these long-distance migrations and arctic terns have been fitted with lightweight geolocators that record data that enables their position to be calculated twice each day. The devices have a mass of just 1.9 g.
Information about rate of travel contributes to an understanding of the energetic costs of migration, but these are still difficult to calculate. However, a full cost-benefit analysis of migration as a strategy for a species could provide a lot of information about the selection pressures that drive the evolution of the behaviour.
The methods used by birds for navigation are becoming clearer, but the physiology of the senses and sensory processing needed to take advantage of natural cues is not well understood. Birds are a good study model, but migration and navigation are part of the life of many animals, and research on bird navigation will have a much wider impact and command a wider interest in biological science.
Conclusion
- Migration is defined as the regular movement of animals each year between separate breeding and wintering grounds.
- There are many different types of migratory behaviour, ranging from completely sedentary populations to populations that are completely migratory (obligate migrants).
- There are three kinds of natural selection that can cause evolutionary change: directional selection, disruptive selection and stabilizing selection.
- The study of Darwin's finches illustrates how rapidly natural selection can result in a change in phenotype.
- Homeostasis is an important mechanism for maintaining internal balance. In achieving homeostasis, animals maintain a relatively constant internal environment even when the external environment changes significantly.
- Birds use both internal maps and compasses to find their way during migration.
- Olfactory maps and magnetic maps are believed to help birds locate themselves in space.
- Three internal compasses allow birds to sense the direction in which they are flying. These are the Sun compass, the star compass and the magnetic compass.
- The mechanisms used by birds to orientate during migration are still largely unknown and are currently the subject of ongoing research.
Glossary
- basal metabolic rate (BMR)
- The minimum metabolic rate of an endotherm.
- directional selection
- Occurs when conditions favour individuals expressing one extreme of a phenotype range, thereby shifting a population's frequency curve for the phenotypic character in one direction.
- disruptive selection
- Selection that favours individuals with the smallest and largest values of a trait. These individuals have the highest fitness and individuals with intermediate values are at a fitness disadvantage.
- ectotherms
- An organism that relies on external heat sources to maintain a body temperature within limits.
- endotherms
- Animals that have a nearly uniform body temperature, maintained independently of ambient temperature, largely by heat derived from metabolism.
- flyway
- A long-distance migration corridor. There are three main global ones for migrating birds.
- homeostasis
- Maintenance of a stable internal state by regulation.
- homeotherms
- Animals that have a nearly uniform body temperature, maintained independently of ambient temperature, largely by heat derived from metabolism. Older term for endotherms.
- metabolic rate
- The amount of energy used by an organism in unit time.
- negative feedback
- A control mechanism that reacts to a change in the output of the system by initiating a restoring action.
- partial migration
- Describes the behaviour of a population on the same breeding grounds where some individuals remain throughout the year and others migrate to avoid adverse condition.
- phenotype
- The characteristics and physical attributes of an organism controlled by the genotype.
- poikilotherms
- An organism that relies on external heat sources to maintain a body temperature within limits Older term for ectotherms.
- stabilising selection
- Occurs where there is an optimal value for the trait of interest. This means that selection acts against both extreme phenotypes and favours intermediate variants which have the highest fitness.
- telemetry
- An automated process for collecting data remotely, for example encoding position data on a radio signal.
- thermoneutral zone
- The range of temperatures over which the metabolic rate is equal to the basal value.
- variation
- Differences between individuals of a species, excluding those associated with sex, age or stage of life cycle.
References
Further reading
Acknowledgements
This course was written by Mandy Dyson and David Robinson.
Except for third party materials and otherwise stated in the acknowledgements section, this content is made available under a Creative Commons Attribution-NonCommercial-ShareAlike 4.0 Licence.
Course image: notspavin in Flickr made available under Creative Commons Attribution-NonCommercial-ShareAlike 2.0 Licence.
The material acknowledged below is Proprietary and used under licence (not subject to Creative Commons Licence). Grateful acknowledgement is made to the following sources for permission to reproduce material in this course:
Figures
Grateful acknowledgement is made to the following sources:
Figure 2a: © iStockphoto.com/red_moon_rise.
Figure 2b: © iStockphoto.com/Jan Kratochvilla.
Figure 2c: © iStockphoto.com/Eric Lawton.
Figure 2d: © iStockphoto.com/Ai-Lan Lee.
Figure 2e: © iStockphoto.com/Frank Leung.
Figure 4: © J.J. Harrison. This file is licensed under the Creative Commons Attribution-Share Alike Licence http://creativecommons.org/licenses/by-sa/3.0/.
Figure 5: © Adrian Riegen.
Figure 6a: © Jeff Schultz/AlaskaStock/Corbis.
Figure 6b: © Mettesd/Dreamstime.com.
Figure 8 Chiffchaff: ©iStockphoto.com/TobyPhotos.
Figure 8 Whinchat: ©iStockphoto.com/geoleo.
Figure 8 Nightingale: ©iStockphoto.com/BorislavFilev.
Figure 8 Blackcap: ©iStockphoto.com/Andrew_Howe.
Figure 8 Ring ouzel: Andreas Trepte. This file is licensed under the Creative Commons Attribution-Share Alike Licence http://creativecommons.org/licenses/by-sa/3.0/.
Figure 8 Wood warbler: Steve Garvie. This file is licensed under the Creative Commons Attribution-Share Alike Licence http://creativecommons.org/licenses/by-sa/3.0/.
Figure 9a: © Arco Images GmbH/Alamy.
Figure 10a:: © iStockphoto.com/The Power of Forever Photography.
Figure 10b: Adapted from a figure created by Melissa Mayntz, www.birding.about.com.
Figures 11a: © iStockphoto.com/Andy Gehrig.
Figure 11b: British Trust for Ornithology, www.bto.org/.
Figure 12: BirdLife International/www.birdlige.org.
Figure 13a: Pyshnyy Maxim Vjacheslavovich/Shutterstock.
Figures 13b, 14c and 15b: Taken from: All About Evolution by alexjiwon. www.allaboutevolution.wordpress.com/.
Figure 14a: Patrick Coin.
Figure 14b: John B. This file is licensed under the Creative Commons Attribution Licence http://creativecommons.org/licenses/by/3.0/.
Figure 15a: © Rinus Baak/Dreamstime.com.
Figure 16: David Cook. This file is licensed under the Creative Commons Attribution-Share Alike Licence http://creativecommons.org/licenses/by-sa/3.0/.
Figures 17 and 18: Zimmer, C. and Emlen, D. J. (2012) Evolution: Making Sense of Life. Roberts and Company Publishers.
Figure 21: Adapted from a figure created by the University of Miami, Department of Biology.
Figure 22a: ©iStockphoto.com/pjmalsbury.
Figure 22b: Fir0002/Flagstaffotos. This file is licensed under the Creative Commons Attribution-Noncommercial Licence http://creativecommons.org/licenses/by-nc/3.0/.
Figure 23: Wojciechowski, M. S. and Pinshow, B. (2009) 'Heterothermy in small, migrating passerine birds during stopover: use of hypothermia at rest accelerates fuel accumulation', Journal of Experimental Biology, vol. 212, The Company of Biologists Ltd.
Figure 24: © iStockphoto.com/dmaroscar.
Figure 25a: Oregon Department of Transportation. This file is licensed under the Creative Commons Attribution Licence http://creativecommons.org/licenses/by/3.0/.
Figure 25b: Adapted from a figure from www.biocyclopedia.com.
Figure 26: © All Canada Photos/Alamy.
Figure 27: © iStockphoto.com/martinspurny.
Tables
Table 1: Adapted from Nebel, S. (2012) 'Animal migration', Nature Education Knowledge, vol. 3, no.10, p. 77, Nature Publishing Group.
Videos and audios
Video 1: Monarch Butterfly migration: from BBC Life, Ep 6 © BBC.
Video 2: The Humpback Whale: from BBC Life, Ep 3 © BBC.
Video 3: Bar-headed geese: from BBC Realm of the Russian Bear, Ep 2 22.11.1992 © BBC.
Video 4: Ospreys of Martha's Vineyard: from BBC Osprey Odyssey, 22.10.06 © BBC.
Video 5: Introduction to Darwin's Finches © The Open University.
Audio 1: Heart rate monitoring of migrating geese © The Open University.
Audio 2: Satellite tagging of migrating bar-tailed godwits - from World on the Move Ep24 29.07.08 © BBC.
Every effort has been made to contact copyright holders. If any have been inadvertently overlooked, the publishers will be pleased to make the necessary arrangements at the first opportunity.
Don't miss out:
If reading this text has inspired you to learn more, you may be interested in joining the millions of people who discover our free learning resources and qualifications by visiting The Open University - www.open.edu/ openlearn/ free-courses