

3.4.2 Technical analysis: reliable sat-nav or bogus science?
The EMH does not rule out the possibility of different traders working with different models, or inputting different data (especially on expected variables) into the same model. However, it does implicitly require traders to believe that assets have a value set by factors that are independent of other traders’ behaviour and beliefs.
Problems arise for market efficiency if there is momentum trading, with the expectation of asset prices based on recent movements in the price. Such traders use technical analysis of stock market charts to treat previous price movements as containing relevant information, which the EMH denies.
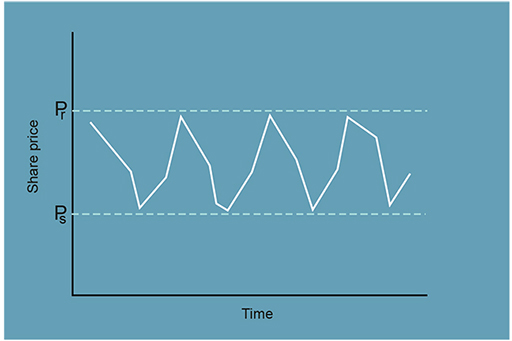
An example of how charts are analysed in technical analysis is provided in Figure 15. A trader might look at the cycle in share prices as taking place in a price channel, as shown by the two horizontal dashed lines. If enough traders believe that there is a support level for the share price, as represented by the price level P s, their belief in the support level price ensures that this price is supported in the market. Similarly, when the share price threatens to break through the resistance level P r, this will also lead to a reaction that pushes the price back into the price channel. Technical traders monitor the pattern of prices using this type of charting analysis.
Technical traders are anticipating that others will make the same trade later, and ‘because their speculation in the stock market is based on what they think other people wish to do, they are working from a slightly different set of information than those who buy or sell based on a firm’s long-term earnings prospects’ (Peters, 1999, p. 81). This potentially undermines the EMH assumption that everyone works from the same information. Although technical traders typically work on very short time-horizons, their behaviour can amplify price movements, causing these to overshoot beyond fundamental values even if they began with arbitrage correcting misalignment – sometimes contributing to ‘bubble’ episodes, which are examined in Week 4.