Earthquakes
Use 'Print preview' to check the number of pages and printer settings.
Print functionality varies between browsers.
Printable page generated Wednesday, 10 June 2026, 2:37 AM
Earthquakes
Introduction
Earthquakes shake the ground surface, can cause buildings to collapse, disrupt transport and services, and can cause fires. They can trigger landslides and tsunami – in short, earthquakes can be very destructive. In this course you will look at why, where and what happens when they occur and also at how earthquakes are assessed qualitatively and quantitatively.
This OpenLearn course provides a sample of level 1 study in Science
Learning outcomes
After studying this course, you should be able to:
Explain the reasons for earthquakes
Understand where in the world earthquakes are most likely to occur
Describe the potential consequences of an earthquake
Differentiate between earthquake intensity and earthquake magnitude
Appreciate the enormous energies released by earthquakes.
1 Earthquakes
1.1 What happens during an earthquake?
The Earth is an active planet, with activity occurring in the oceans, in the atmosphere and in the solid Earth itself. This course looks at a dramatic example of solid Earth activity: earthquakes.
You probably have some idea from newspapers, television or perhaps personal experience, of just how powerful earthquakes can be. In a matter of minutes earthquakes have devastated cities and killed a quarter of a million people. I was in only a medium-sized earthquake in 1978, but even that had the power to throw me out of bed onto the floor and make the building sway from side to side; an awesome experience.
One of the most destructive earthquakes of the 1990s occurred near Kobe, Japan, on 17 January 1995. This killed over 5 000 people, injured 25 000 and made a quarter of a million homeless. It was the most destructive Japanese earthquake since the one that killed 143 000 people in Tokyo in 1923.
Click below to view article from the Guardian on the Kobe earthquake.
Activity 1 Using a newspaper report on the Kobe earthquake
The newspaper article reproduced in the above document, reporting the effects of the Kobe earthquake, was published on the front page of the Guardian on 18 January 1995, the day following the earthquake. You may encounter a lot of scientific information in news reports and other articles. Being able to identify the key points in such articles can help you to make sense of the science (and can help you to judge whether they are reliable reports).
This activity will enable you to identify some of the effects due to earthquakes. To do this, print off and read the article and highlight or underline the text that refers to the effects. After you have finished reading the article, make a list of the highlighted effects. You might find it useful to combine similar types of effect under a suitable heading, such as 'effect on buildings' or 'sounds'. For example, you might note 'sounds: deafening, roaring'. Your completed list will be a record of the key observations made by the eyewitness to the Kobe earthquake.
Answer
Your answer should have included some of the following effects. We have grouped some effects together; you may have chosen some other way of organising your notes.
Sounds: deafening, roaring, creaking and rattling.
Ground motion: violent motion; aftershocks.
Effect on buildings: shuddering; shaking, swaying, collapse.
Effect on objects inside buildings: falling, breakage, shaking.
Effect on transport: derailed trains, bent rail tracks, toppled roads.
Fires.
Death.
1.2 Earthquake-triggered landslides and tsunami
As well as being highly destructive in their own right, earthquakes can also trigger two other very destructive natural hazards. One of these is a landslide. This is a rapid movement of earth materials down a slope, the materials ranging from huge boulders to soil. Landslides can involve the movement of just a small amount of material or enough to bury whole towns in their path. They can have a number of causes, of which earthquakes are just one. The shock of an earthquake may be sufficient to start the slide. One of the most destructive earthquake-induced landslides occurred in Peru in 1970, as described in Box 1, The 1970 Mount Huascaran landslide.
Box 1 The 1970 Mount Huascaran landslide
On 31 May 1970, there was a large earthquake beneath the Pacific Ocean about 25 km from the coast of Peru. The ground shaking produced by the earthquake loosened rocks and ice on Mount Huascaran, one of South America's highest mountains, 130 km away from the earthquake. This initiated a gigantic landslide, which increased in speed and size as it moved down the mountain, reaching a speed of over 200 km h-1. It swept along the valley at the foot of the mountain, filling it with rock, mud and ice, and partially destroying the town of Ranrahirca, 12 km from the mountain. Part of the landslide branched off to one side, swept over a ridge and roared through the village of Yungay. The village was obliterated; only a few of its inhabitants managed to escape by running to higher ground as the landslide approached. Survivors described the landslide as like a gigantic ocean wave with a deafening roar and rumble. The earthquake also triggered many other smaller landslides in the region, destroying thousands of buildings and causing even more deaths. The final toll was 67 000 dead and 800 000 homeless, making this the worst earthquake-induced disaster in the Western Hemisphere.
The second natural hazard that can be triggered by earthquakes is that of tsunami (pronounced 'tsoo-nam-ee'). Tsunami are ocean waves caused by movement of the ocean floor by an earthquake beneath the ocean. The water is moved as if it were being pushed by a giant paddle, producing powerful waves that spread out from the region of the earthquake across the ocean. Tsunami are hardly detectable in the open ocean, having only a low wave height, 1 m or less, but when they reach shallow water at a coastline their wave height increases significantly, reaching over 10 m, with disastrous effects.
Tsunami is a Japanese word meaning bay or harbour wave, and is particularly apt as it is only along the shore that they become noticeable or destructive; in the open ocean they do no harm to ships. The term 'tidal wave' is sometimes used in newspaper reports of tsunami but this is inaccurate as they are not related to tides (which are generated on the Earth's surface by the gravitational attraction of the Moon and the Sun) so scientists use the term 'tsunami'. The Japanese word is particularly appropriate because Japan has suffered greatly from the destructive effects of tsunami. Box 2, The 1964 'Good Friday' tsunami, describes the effects of one of the most damaging tsunami, triggered by an earthquake near Alaska.
Box 2 The 1964 'Good Friday' tsunami
A major earthquake occurred on 27 March 1964 (which happened to be Good Friday) beneath the Pacific Ocean just to the south of Alaska. People on Chenega Island, a mainly fishing and hunting community in the Gulf of Alaska, felt the earthquake and, concerned that a tsunami might follow, looked towards the shoreline. One of the islanders, Nicholas Kompkoff, noticed that water was receding from the beach. He quickly ran to his three young daughters who were down by the island's pier, and ran with them towards higher ground. As they were running, a huge wave arrived, sweeping 30 m up the hillside, carrying away people, the church and every home on the island. Two of Nicholas Kompkoff's daughters were carried away by the wave and killed. Nicholas and the other child were carried further up the hill and knocked unconscious, but miraculously they survived. 23 of the 80 islanders were killed by the tsunami.
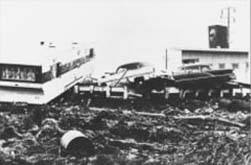
About four hours after the tsunami struck Chenega Island, it reached Crescent City, on the coast of northern California about 2 600 km away. A tsunami warning had been sent out to the county sheriff in Crescent City, and he notified people in the low-lying areas to evacuate. The first wave of the tsunami to arrive rose to a height of only 1 m, and did no damage, so some of the people returned to the waterfront area, thinking that the danger was over. This was a fatal action, as during the next few hours several more tsunami waves arrived, up to 6 m high. The third and fourth waves caused massive destruction, washing more than 500 m inland and killing 11 people. The waves overturned cars (see Figure 1), moved and destroyed houses and sank boats in the harbour.
The tsunami also caused death and damage at ports and coastlines along other parts of the North American coast between Alaska and California, causing 119 deaths and $104 million of damage.
2 Why do earthquakes occur?
What causes the apparently solid and rigid Earth to move and so produce an earthquake? Earthquakes mainly occur when the different blocks or plates that make up the Earth's surface move relative to each other (Figure 2a), causing distortion in the rock (Figure 2b). The distortion builds up very slowly, over tens or hundreds of years. When rocks are distorted very slowly they behave as if they were springs, or pieces of elastic, in being able to store energy when they are stretched or compressed. Prior to an earthquake, the area is like a spring-loaded system waiting to go off. Eventually the distortion is enough to cause the rock to break and move, releasing energy in the form of an earthquake. The break is called a fault. It starts as a small fracture (Figure 2c), but grows rapidly (Figure 2d). In general, the larger the area of the fault, the greater is the size of the earthquake. The fault length (the length of the break along which rocks are displaced) can vary from metres for a small earthquake to about 1 000 km for a very large earthquake.
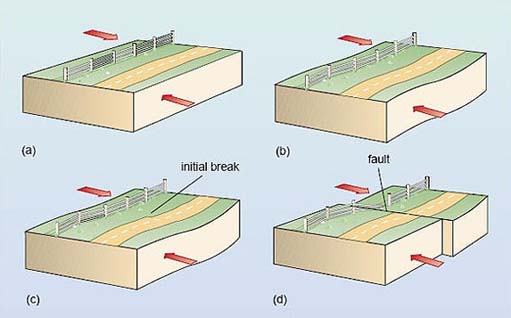
Figure 2 above shows the cause of an earthquake, using block diagrams, illustrating both the surface of the Earth and the Earth in cross-section.
(a)Part of the Earth where forces (shown by arrows) are trying to move the rock in opposite directions.
(b)Before a fault breaks, the rocks stretch.
(c)When the distortion is enough to cause the rocks to break, the break starts at one point
(d)The break spreads rapidly along the fault, releasing energy. Note that faults are not always vertical, and the forces causing movement can sometimes result in the rocks on either side of the fault moving up or down.
Question 1
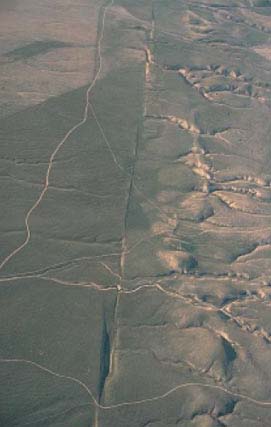
Figure 3 is an aerial view of part of the San Andreas Fault in California.
What is the evidence for a fault in this photograph?
What are the relative directions of motion of the blocks on either side of the fault?
Answer
The rivers and some roads have been displaced across the fault, which is the linear feature running from the top to the bottom of the photograph.
The block on the left (southwest) has moved northwest along the fault, and the block on the right (northeast) has moved in the opposite direction, to the southeast. This is deduced from the sense of displacement of the rivers and roads across the fault.
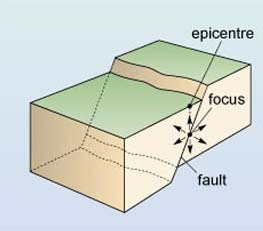
What is the real place of origin of an earthquake? As the initial break propagates, it releases energy along the fault, so in a sense the earthquake originates from the entire fault – which may be 1 000 km long. However, it is useful to refer to one part of the fault as the place of origin of an earthquake, and this is taken as the initial break. It is called the focus (plural foci) of the earthquake. This is usually below (not at) the Earth's surface. The point on the Earth's surface directly above the focus is called the epicentre (Figure 4).
A large earthquake is frequently followed by a series of smaller earthquakes on the same fault, called aftershocks. These can continue for months after the main earthquake. They are caused by readjustment in the positions of the rocks following the main earthquake, releasing smaller, localised buildups of energy on the fault. Sometimes the main earthquake is preceded by one or more smaller foreshocks, although these cannot be identified as foreshocks until after the main earthquake has occurred.
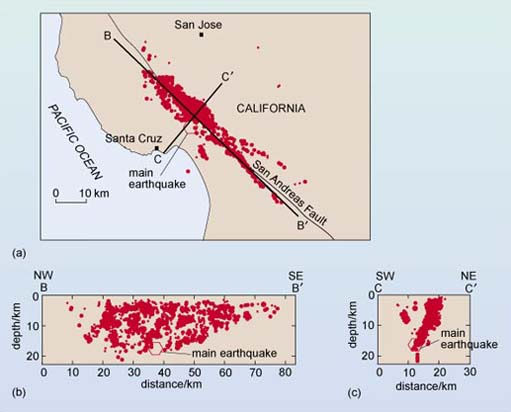
A 1989 earthquake in California had a sequence of aftershocks that revealed the size and orientation of the fault. This earthquake occurred on 17 October 1989 with the epicentre about 100 km southeast of San Francisco, and is usually referred to as 'the Loma Prieta earthquake' after the mountain just to the east of the epicentre. The earthquake involved movement on a fault about 40 km in length. It was large enough to cause destruction not only in the nearby town of Santa Cruz but also in San Francisco and its surroundings, where some buildings, bridges and raised roads collapsed.
Figure 5a is an epicentral map (a map showing the location of the epicentres) for the Loma Prieta earthquake and its aftershocks. The earthquake and aftershocks occurred along a well-known fault in California – the San Andreas Fault (shown in Figure 3). Figure 5b is a vertical cross-section of this area along the fault, from point B to point B′ on Figure 5a. This shows the positions and depths of the earthquake and aftershocks, i.e. their foci.
Over what length of the fault did the aftershocks occur?
Over about 70 km.
What was the depth of the main earthquake, and what was the maximum aftershock depth?
The main earthquake had a depth of 17 km and the maximum depth of the aftershocks was 21 km.
Figure 5c is a cross-section showing the foci on the fault beneath the line joining point C to point C′ on Figure 5a.
Is the fault vertical?
No. The earthquake foci become deeper towards the southwest, indicating that the fault slopes down to the southwest (at about 25° to the vertical).
The San Andreas Fault is the largest and possibly most active of many faults in California. As well as the Loma Prieta earthquake, movement along the fault has caused other large earthquakes, including a major San Francisco earthquake in 1906. This resulted in the almost total destruction of the city by fire, following the rupture of gas mains; rupturing of the water mains made it impossible to put out the fires. The land to the west of the fault moved as much as 6 m north relative to the other side during this earthquake.
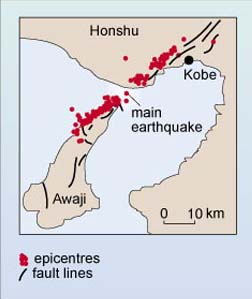
Now we know a bit more about what causes earthquakes, we can return to the first earthquake we considered (Kobe, 1995) to look at it in terms of movement along a fault. The epicentre was about 30 km to the southwest of the city of Kobe (Figure 6). The rocks moved up to 1.5 m horizontally over a 10 km length of a northeast-southwest fault along the northern coast of the island of Awaji. Aftershocks occurred on this fault, and to the northeast, over about 50 km. The only previously recorded significant earthquake along this fault was in 1916, and that was much smaller than the 1995 earthquake. The fault was thought to be moving only very slowly, enough to cause a large earthquake every thousand years or so. Unfortunately for Kobe, 1995 turned out to be the year in a thousand.
3 Where do earthquakes occur?
How deep in the Earth do earthquakes occur? Most earthquake foci are within a few tens of kilometres of the surface. Earthquakes less than 70 km deep are classified as shallow-focus. Earthquakes with foci 70–300 km deep are classified as intermediate-focus and those below 300 km are deep-focus. Shallow-focus earthquakes occur more often than deeper ones; about 75% of the total energy released from earthquakes is from shallow-focus ones. Unfortunately, the shallower an earthquake, the more damage it can produce at the surface; intermediate and deep-focus earthquakes are rarely destructive. No earthquakes are known to have occurred below about 700 km. At greater depths the rocks are very hot and under high pressure so they deform by flowing rather than breaking and faulting.
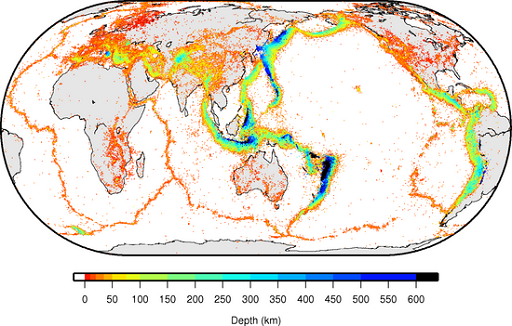
Do earthquakes occur everywhere, or only in some parts of the Earth? So far, this course has discussed earthquakes in Japan and California, and in the Pacific Ocean near Alaska and near Peru. You may also recall hearing of earthquakes in Italy, Armenia, Mexico City, China and even Britain. Figure 7 shows the global distribution of earthquakes.
Activity 2 Geographical distribution
Looking at Figure 7, try to describe the main patterns of the geographical distribution of earthquakes.
Consider also which surface features on the Earth appear to have (i) shallow, and (ii) deep earthquakes associated with them.
Answer
Earthquakes are not distributed evenly across the Earth's surface, so it does not seem sensible to describe the pattern simply as a variation from west to east across the map. The fact that earthquakes occur in distinct regions is reflected in the answer given below:
Earthquakes are concentrated in specific regions of the Earth, and they often occur in linear belts or arcs. One belt surrounds the Pacific Ocean, including Japan, Alaska and the western coast of North, Central and South America. Another region is from southeastern Europe through the Middle East and the Himalayan Mountains. There are also earthquakes in linear zones in the oceans.
The decision to structure the answer in this way was made after looking at Figure 7 specifically. If the question had asked you to look at a different map and describe the variation of something different, such as population, you would probably have ordered your answer in a different way (possibly continent by continent) so as to give the most logical answer.
Looking more closely at depth measurements leads to the following conclusions about the relationship between shallow and deep-focus earthquakes and surface features:
(i) Shallow-focus earthquakes appear to be associated with mid-ocean ridges, with mountain ranges in the interior of the continents of Europe and Asia, and with the mountains and ocean trenches that surround the Pacific Ocean.
(ii) Deep-focus earthquakes appear to be associated mainly with the mountains and ocean trenches that surround the Pacific Ocean (for example, near the coast of South America, or the coast of Japan).
Earthquakes are largely confined to specific areas of the Earth, called seismic zones (derived from seismos, the Greek word for 'shaking'). Most of the rest of the Earth is relatively free of earthquakes, or at least free of large earthquakes. However, even the UK has some small earthquakes (Box 3, Earthquakes in the UK).
Box 3 Earthquakes in the UK
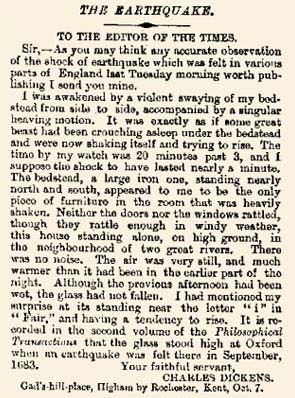
Earthquakes do occur in and around the UK, but they are usually fairly small; the largest one recorded (in 1931) had about a thousand times less energy than the 1906 San Francisco earthquake, for example. This 1931 earthquake occurred under the North Sea but was felt over most of the UK. Two earthquakes just a little smaller occurred in the Dover Straits in 1382 and 1580, causing significant damage in London, the latter killing two apprentices in Newgate. In 1863, Charles Dickens experienced shaking caused by an earthquake and was moved to write to The Times describing its effects (Figure 8).
All UK earthquakes occur at shallow depths; the greatest recorded depth is 42 km.
You will have seen in Activity 2 that most earthquakes are associated with certain features of the Earth's solid surface – mid-ocean ridges, ocean trenches, and some mountain belts. We can also see that deeper earthquakes are characteristic of ocean trenches whereas shallower earthquakes are more typical of mid-ocean ridges. This relationship between the surface features of the Earth, and the movement of blocks of the Earth that causes earthquakes, is one of the observations of the active Earth that can be explained by the theory of plate tectonics. For now, however, we will continue looking specifically at earthquakes.
4 The size of earthquakes
4.1 Earthquake intensity
Why are some earthquakes more destructive than others? There are three main reasons: location (an earthquake with a focus under an ocean at a large distance from land, for example, is not usually destructive, unless it generates a tsunami), depth (shallower earthquakes can be more devastating), but, most importantly, the size of the earthquake.
A straightforward way to measure the size of an earthquake is to look at the damage it caused. This is a measure of the strength of the ground shaking caused by an earthquake, and is called the earthquake intensity. To estimate the intensity of an earthquake at a single place, descriptions of what happened to people and structures during the earthquake are collected, and the description compared to a scale of earthquake effects, such as 'objects fall off shelves' or 'most chimney pots fall off'. The descriptions are given numbers on a 12-point intensity scale, with intensity 1 being not felt, 8 including 'most chimney pots fall off' and 12 being total devastation. The intensity scale is a qualitative scale because it is not based on specific measurements, even though it has numbers.
It is important to realise that intensity refers to the damage caused at a particular place by an earthquake. An earthquake will have different intensities in different places. It is therefore wrong to refer to the intensity of an earthquake; it is necessary to state the intensity in, say, Los Angeles, or 'the maximum intensity'. The intensity at the epicentre of the 1989 Loma Prieta earthquake was intensity 8, but the maximum intensity (and damage) was in parts of San Francisco and Oakland, about 100 km to the northwest of the epicentre, where intensity 9 was recorded. This was mainly due to the presence of a loose sand layer at the ground surface in the San Francisco Bay area which did not support structures as well as the solid rock nearer to the epicentre.
Intensity scales have two major disadvantages; they are no use for earthquakes under the oceans and no use for uninhabited areas. Even in inhabited areas, building standards vary in different areas, so earthquake effects are different. To overcome these problems in measuring the size of earthquakes, a different way of measuring earthquake size, using instruments, is often used instead of intensity.
4.2 Earthquake magnitude
The magnitude of an earthquake is a measure of the amount of seismic energy released by it, so it is a quantitative scale. The scale of earthquake magnitude is called the Richter scale. Its development is described in Box 4, Charles Richter and the Richter earthquake magnitude scale. The Richter magnitude is calculated by first measuring the size of the largest ground motion recorded by a seismometer, a sensitive instrument that detects the ground movements produced by earthquakes. This is then corrected for the distance from the earthquake, since the closer the seismometer is to the earthquake, the larger the ground motion will be.
Box 4 Charles Richter and the Richter earthquake magnitude scale
Many scientists contributed to the evolution of the earthquake magnitude concept, but it was Charles Richter, a professor at the California Institute of Technology, who set up a scale on the basis of many years of observations and applied it to well-known earthquakes. He explained the scale in a now classic paper published in 1935. Professor Richter modestly never attached his own name to the scale. He even refused to call it the Richter scale in his papers, long after the press and public had made 'Richter scale' synonymous with 'earthquake magnitude scale'.
Professor Richter often had trouble explaining to people that the Richter scale is a mathematical scale involving measurements and calculations on paper. 'They seem to think it is some sort of instrument or apparatus. Every year they come by wanting to look at my scale', he once said in an interview. Richter borrowed the term 'magnitude' from astronomy, in which he had an amateur interest. In astronomy the brightness of stars is measured on a magnitude scale.
Unlike earthquake intensity, any earthquake has only one Richter magnitude. The Richter scale is also quantitative, being based on numerical measurement. The Richter scale has no upper limit, but in reality the Earth itself provides an upper limit due to the strength of rocks. The largest earthquakes ever recorded have had Richter magnitudes over 9.
The sizes of earthquakes vary enormously, so the size of the ground motion produced can differ by thousands or even millions from earthquake to earthquake. In order to deal with such enormous variation, the Richter scale is based on powers of ten, which means that an increase of one unit on the scale implies a tenfold increase in the amount of ground motion. For example, a magnitude 2 earthquake produces 10 times more maximum ground motion than a magnitude 1 earthquake. A magnitude 3 earthquake produces 10 times more again, which is 10 × 10 = 100 times greater maximum ground motion than a magnitude 1 earthquake.
What is the difference in maximum ground motion between a magnitude 3 earthquake and a magnitude 6 earthquake?
Magnitude 6 is 3 points more on the Richter scale than magnitude 3, so a magnitude 6 earthquake has 10 × 10 × 10 = 1 000 (or 103) times greater maximum ground motion than a magnitude 3 earthquake.
Similarly, the difference between earthquakes of magnitude 3 and 7 (4 points on the Richter scale) will be 104 in maximum ground motion. What appears at first to be a small change in Richter magnitude of an earthquake (say from 3 to 7, 4 points) really represents a very large change in earthquake size.
Activity 3 Investigating links between earthquake magnitude and location
In Activity 2 you established links between the depths of earthquake foci and the location of the earthquake epicentre. In this activity you will investigate links between magnitude and location.
You saw in Activity 2 that some of the Earth's surface features (the ocean trenches, mid-ocean ridges and certain mountain belts) have earthquakes associated with them, and that some of these features have both deep-focus and shallow-focus earthquakes. In this activity you will investigate whether there is also a relationship between the size of an earthquake and its location relative to the major surface features.
(a) Look at some maps that incorporate magnitude (you can find these with google – example 1, example 2, example 3, example 4), and for each of the surface features (i), (ii) and (iii) listed below, try to determine the highest earthquake magnitude (on the Richter scale) that's usually associated with the feature.
(i) Mountains and ocean trenches surrounding the Pacific Ocean.
(ii) Mountain belts in Europe; mountain belts in Asia.
(iii) Mid-ocean ridges.
(b) Now fill in Table 1, using your answers from part (a) of this activity and the answer to Activity 2. The completed table will provide a summary of the relationship between earthquake depth, size and location.
| Mountains and ocean trenches surrounding the Pacific | Mountain belts | Mid-ocean ridges | ||
|---|---|---|---|---|
| Europe | Asia | |||
| depth (shallow-focus, intermediate-focus or deep-focus) | ||||
| largest magnitude (up to magnitude 7.9, or over magnitude 8) | ||||
Footnotes
For further information, you can examine other earthquake data on the British Geological Survey World Seismicity web siteAnswer
(a) (i) Mountains and ocean trenches surrounding the Pacific Ocean: magnitude 8.0-8.9
(ii) Mountain belts in Europe: magnitude 7.0-7.9; mountain belts in Asia: magnitude 8.0-8.9
(iii) Mid-ocean ridges: magnitude 7.0-7.9. (In fact the maximum magnitude at mid-ocean ridges is 7.5.)
(b) See Table 2 below.
| Mountains and ocean trenches surrounding the Pacific | Mountain belts | Mid-ocean ridges | ||
|---|---|---|---|---|
| Europe | Asia | |||
| depth (shallow-focus, intermediate-focus or deep-focus) | shallow-, intermediate and deep-focus | mainly shallow-focus, a few intermediate | mainly shallow-focus, a few intermediate | shallow-focus |
| largest magnitude (up to magnitude 7.9, or over magnitude 8) | over 8.0 | up to 7.9 | over 8.0 | up to 7.9 |
4.3 Seismic energy
It is also possible to relate magnitude to the seismic energy released by an earthquake. An increase of one unit on the Richter scale represents an increase of about 40 times in the amount of seismic energy released.
Question 2
What increase in (a) the maximum ground motion, and (b) the energy released is involved between an earthquake that measures 6.1 on the Richter scale and one that measures 8.1?
Answer
There is an increase of (8.1-6.1) = 2 units on the Richter scale, which is an increase of:
(a) 102 = 10 × 10 = 100 times in ground motion;
(b) 40 × 40 = 1 600 times in energy released.
Earthquakes with magnitudes of 8 and greater occur rarely, but when they occur they can lead to almost total devastation over a large area (Table 3). Smaller earthquakes occur more frequently, but their combined energy release is small compared with that from one great earthquake; it would take about 3 million earthquakes of magnitude 4 to release as much seismic energy as a single magnitude 8 earthquake. Earthquakes with the highest Richter magnitudes are not necessarily the most devastating, nor do they necessarily cause the greatest loss of life. The damage depends on the depth; as mentioned previously, shallow earthquakes are more destructive than deeper ones. It also depends on other factors such as population density, the rock types, soil conditions and local building standards.
| Richter magnitude | Average number per year | Radius of region of strong ground shaking/km | Effects of shallow earthquake |
|---|---|---|---|
| >8.0 | <1 | 80-160 | almost total destruction |
| 7.0-7.9 | 15 | 50-120 | serious/great damage |
| 6.0-6.9 | 140 | 20-80 | considerable damage |
| 5.0-5.9 | 900 | 5-30 | slight damage |
| 4.0-4.9 | 8 000 | 0-15 | felt by many |
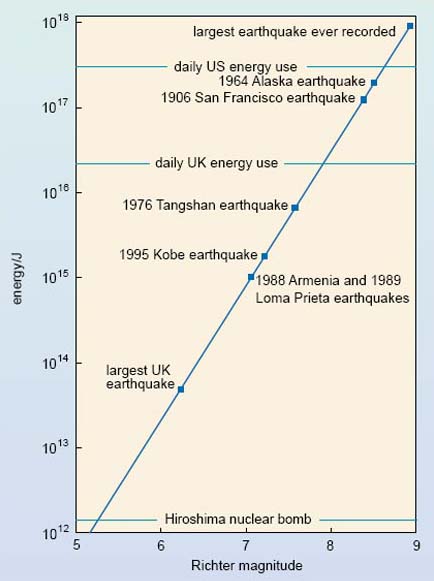
Finally in this section, it is interesting to compare the energy produced by earthquakes with other energy sources. The amount of energy released by the Hiroshima nuclear bomb was about 1012 J, whereas one magnitude 8.9 earthquake released about 1018 J of seismic energy (Figure 9). This is a million times more energy (i.e. a factor of 106) than the Hiroshima bomb. The amount of energy used every day in the UK is somewhat more than 1016 J (Figure 9), and this is more than 100 times greater than the seismic energy released by the largest UK earthquake. However, the seismic energy (responsible for ground motion and the resulting damage) is only a few per cent of the total earthquake energy. The rest is involved in breaking and crushing rocks around the fault, moving the adjoining blocks of the Earth, and heating the rocks.
Conclusion
Earthquakes shake the ground surface, can cause buildings to collapse, disrupt transport and services, and can cause fires. They can trigger landslides and tsunami.
Earthquakes occur mainly as a result of plate tectonics, which involves blocks of the Earth moving about the Earth's surface. The blocks of rock move past each other along a fault. Smaller earthquakes, called foreshocks, may precede the main earthquake, and aftershocks may occur after the main earthquake. Earthquakes are mainly confined to specific areas of the Earth known as seismic zones, which coincide mainly with ocean trenches, mid-ocean ridges, and mountain ranges.
The point of origin of an earthquake is called the focus. The epicentre is the point on the Earth's surface directly above the focus. Most earthquake foci are within a few tens of kilometres of the Earth's surface. Earthquakes less than 70 km deep are classified as shallow-focus. Intermediate-focus earthquakes are 70-300 km deep, and deep-focus earthquakes more than 300 km deep. Shallow-focus earthquakes occur in all of the Earth's seismic zones, but intermediate- and deep-focus earthquakes are almost exclusively associated with seismic zones near ocean trenches.
The destructiveness of an earthquake depends on the size, the depth (shallow ones are more destructive) and the location. Earthquake size can be stated in terms of the damage caused (the intensity) or the amount of ground motion and the energy released by the earthquake (related to the Richter magnitude).
Acknowledgements
Except for third party materials and otherwise stated (see terms and conditions), this content is made available under a Creative Commons Attribution-NonCommercial-ShareAlike 4.0 Licence
Course image: rabiem22 in Flickr made available under Creative Commons Attribution-NonCommercial-ShareAlike 2.0 Licence.
Grateful acknowledgement is made to the following sources for permission to reproduce material within this course.
Figure 1 US Army Corps of Engineers.
Figure 3 John Plafker, G. and Galloway, J.P. (1989) Lessons learned from the Loma Prieta, California, earthquake of October 17th, 1989, USGS Circular 1045, United States Geological Survey.
Figure 6 Adapted from Mestel, R. (1995) Minor fault, major disaster, New Scientist, 28 January 1995, IPC Magazines Ltd.
Figure 7 International Seismological Centre
Don't miss out:
If reading this text has inspired you to learn more, you may be interested in joining the millions of people who discover our free learning resources and qualifications by visiting The Open University - www.open.edu/ openlearn/ free-courses