Surface water
Use 'Print preview' to check the number of pages and printer settings.
Print functionality varies between browsers.
Printable page generated Tuesday, 9 June 2026, 6:20 AM
Surface water
Introduction
We have seen that where precipitation reaches the ground, some runs off the surface into streams and rivers and some of it infiltrates, passing through the soil. Water that reaches the water table to become groundwater may eventually re-emerge at the surface as springs where the water table intersects the surface. Almost all streams and rivers have springs or seepages as their ultimate source, or are fed by them at various points along their courses.
This OpenLearn course provides a sample of level 2 study in Environment & Development
Learning outcomes
After studying this course, you should be able to:
list the types of springs, and how each type relates to a different geological setting
use hydrographs to distinguish overland flow and interflow from baseflow, and make inferences about the climate of an area
expain how various changes in land use in a river catchment will change the hydrograph of a river
distinguish the different types of reservoir construction, and decide whether a particular area would be suitable for a reservoir, suggest the most suitable type of dam for a site, and summarise the side-effects of constructing reservoirs.
1 Springs
We have seen that where precipitation reaches the ground, some runs off the surface into streams and rivers and some of it infiltrates, passing through the soil. Water that reaches the water table to become groundwater may eventually re-emerge at the surface as springs where the water table intersects the surface. Almost all streams and rivers have springs or seepages as their ultimate source, or are fed by them at various points along their courses.
Artesian springs that are associated with confined aquifers. These are most obvious on land, but can also occur on the sea bed, a fact long known to sailors who have used them to fill up with fresh water while still at sea. In such cases, an aquifer has its recharge area on land but extends beyond the coast to underlie the sea bed, where if the geology and topography are favourable, and the aquifer intersects the sea bed, fresh water may emerge.
Most springs, however, are ordinary water-table springs, and these can be of several different kinds depending on the geological setting:
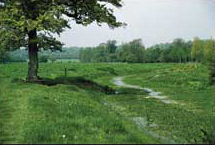
Valley springs develop in valleys where the ground surface intersects the water table. In southern England, a number of seasonal springs occur in the Chalk valleys when the water table rises during a wet winter. These temporary streams are called bournes (Figure 1), reflected in some of the place names in the area, e.g. Winterbourne Stoke in Dorset. These bournes dry up in summer, when the water table drops below the ground surface.
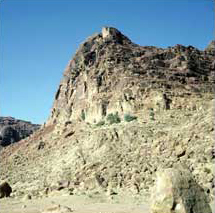
Stratum springs form where the downward flow of groundwater is prevented by an underlying impermeable layer of rock, which can result in a line of springs emerging at the boundary between the two layers (Figure 2).
Solution channel springs typically occur in limestone districts where groundwater has created caves and channels by dissolving calcium carbonate along bedding planes and fractures, and then returned to the surface where impermeable strata prevent further downwards migration.
2 River flow
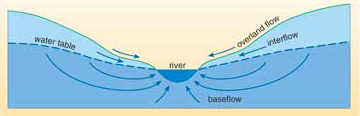
The total land area drained by a river system, including all its tributaries, is called a river catchment. The water in a river comes not only from direct precipitation, springs and overland flow (i.e. water flowing across the ground surface, excluding that in streams and rivers; this is rare in temperate vegetated areas) but also from the underground flow of water, directly to the river. Part of this underground flow is interflow, that part of infiltration which moves through the unsaturated zone without penetrating to the main water table (Figure 3). It occurs because the permeability of the unsaturated zone tends to reduce with depth thereby restricting infiltration. The term also includes water that flows from any perched water tables in the unsaturated.
Below the water table, groundwater can discharge directly into a river, and this is called baseflow (Figure 3). The contribution of baseflow to river flow varies greatly with the geology and topography of the catchment and with the season. The baseflow contribution is low for a river in a catchment of impermeable rocks, where rainfall infiltrates slowly, and the overland flow is consequently high. In contrast, for rivers with a catchment of permeable rocks there may be no water from overland flow in the rivers.All of the river flow in this case will be baseflow. In Britain, baseflow usually forms a higher proportion of the total flow in summer than in winter, because evaporation is higher in summer and overland flow is therefore lower, whereas groundwater is released to rivers as baseflow more consistently throughout the year.
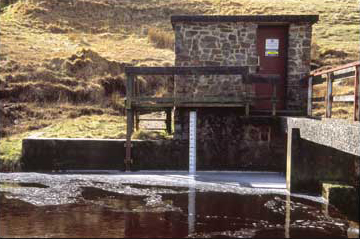
The water level in a river, called the stage, is easy to measure (Figure 4), whereas the discharge of a river, the volume of water that flows past a point in a certain time, cannot be measured directly. However, the measurement, or gauging, of river discharge is necessary for the calculation of surface water resources. Regularly recorded discharge values also give information about the maximum and minimum volumes of water flowing in the river, which is required for planning water supply schemes and for flood-control and hydroelectric projects. The discharge (Q) of a river is related to the speed of flow (v) by the equation:

where A is the cross-sectional area of the river.
The cross-sectional area of a river channel at a discharge measurement point is determined from measurements of the depth of the water taken at known intervals across the river. The speed of the flow can be measured using current meters; these have vanes that are turned by the water flowing past, the rate of rotation giving the water speed. However, the speed is not constant from bank to bank or from the bed to the surface, so a number of speed measurements must be made at different depths at intervals across the river. In order to do this the river cross-section is divided into small areas, and the discharge within each area is calculated from the measured speeds (area × speed across that section). The total discharge is the sum of the individual discharges.
This method is very laborious, as many speed-depth measurements have to be made for each determination of discharge. However, once the discharge at a particular stage (water level) has been measured, the assumption can be made that for the same stage at that location, the discharge will be the same. This means that if the discharge in the river has been measured at different stages, so that the relationship between stage and discharge is known at that location, the river discharge can be estimated from measurement of stage alone; this is read directly from a post in the river. Figure 5 shows a rating curve for a river; it is a plot of discharge values measured at various stages, with a smooth curve drawn through the plotted points. The shapes of rating curves can vary considerably: they may be quite different from the curve in Figure 5.
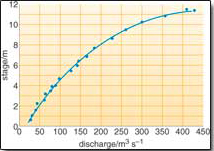
How accurately do you think the discharge can be estimated from the stage, using a rating curve?
Reasonably accurately, as most points lie fairly close to the curve. The differences arise from the errors in measuring the river cross-section and flow rates.Where possible, concrete weirs are built into the river at gauging stations to reduce the errors involved in using rating curves to estimate discharge (Figure 6). These have a straightforward cross-section, with either a horizontal surface, or a V-notch.
A record of the discharge over time is called a discharge hydrograph (usually abbreviated to hydrograph). This is calculated from a stage hydrograph, a record of stage over time.
River discharge is related to the effective precipitation over the catchment. After precipitation begins, the discharge usually increases rapidly to a peak and then decreases more slowly (Figure 7). Initially the increased discharge comes from overland flow, then interflow, but these die away fairly soon after the rain stops falling, eventually leaving only the baseflow contribution to the river.
Hydrographs can be used to show short-term variations (recorded over a few days), such as how discharge from a catchment responds to individual rainstorms (Figure 7), or long-term variations (recorded over a year or more), illustrating a climatic regime. The resultant hydrographs are called short-period and long-period hydrographs, respectively. The shape of a hydrograph depends on several factors:
Short-term variations: the size and shape of the catchment area. Generally, the larger the catchment, the higher the peak discharge for a given rainfall and the longer the time difference (lag) between rainfall maximum and river discharge maximum. The steepness of the slope of the ground is also significant, as gentle slopes produce a longer time difference because the water runs off more slowly.
Short-term variations: vegetation and land use. Vegetation cover and human use of the land affects hydrographs, as described in Box 1.
Short- to medium-term variations: the geology of the catchment, particularly the permeability of the rocks. An impermeable catchment will produce higher peak discharges but lower flows at other times and respond more quickly than a permeable catchment. In a permeable catchment, with a greater baseflow contribution, there is less variation in discharge.
Long-term variations: climatic factors, such as seasonal rainfall and melting snow.
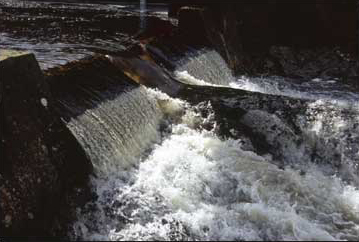
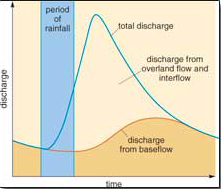
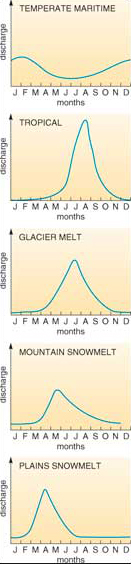
Figure 8 shows the types of long-period hydrograph to be expected from different climatic regimes. (These hydrographs cover a year, whereas the hydrograph in Figure 7 is for a few days only.) In temperate maritime climates, rainfall occurs all the year, but as temperature is higher in summer, evaporation is also greater in summer, so there is a greater discharge in winter than in summer.Within the tropics and in the equatorial zone there are usually wet and dry seasons, or even two wet seasons , and hydrographs are controlled by the effective rainfall pattern.
The other hydrographs in Figure 8 (glacier melt, mountain snowmelt and plains snowmelt) are dependent on seasonal temperature, in particular when it becomes warm enough to melt snow and ice. In the Northern Hemisphere, as melting takes place mainly in the summer, the peak discharges are in June or July. Melting of mountain snow starts earlier in the year, giving a peak discharge in May or June. Snowmelt from plains (the interior regions of large continents) depends on latitude, with the more southerly rivers having peak discharges in April, and more northerly rivers having a peak in June. River hydrographs are often a combination of one or more of the climatic regimes in Figure 8.
Box 1 Land use and river discharge
Changes made in the use of the land surface have varying effects on the overland flow and infiltration characteristics of a catchment, and so can change the river discharge pattern.
Plants, especially trees, intercept precipitation and prevent it reaching the ground. An area that is forested also usually has a thick layer of decaying vegetation on the ground, which absorbs water, so plants, and forests in particular, reduce overland flow to rivers (Figure 9a). The peak discharge is less in a forested area and the lag time is greater. Catchments of many upland reservoirs are forested, but as Figure 9a demonstrates, this may not be ideal for water supply, as afforestation reduces the total volume of water reaching a river, although it makes the flow more uniform.
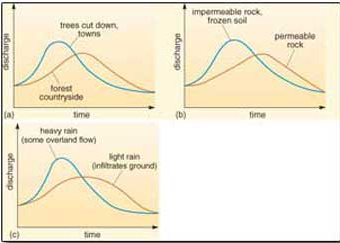
Urbanization of land usually results in less infiltration and faster overland flow from buildings and roads, giving very high peak discharges on hydrographs (Figure 9a) and sometimes the risk of flooding. To reduce this risk, and maintain the water table, balancing lakes are constructed in newly urbanized areas (such as Milton Keynes) to provide an area for increased infiltration.
If the ground is relatively impermeable, which can occur when the soil is frozen or the underlying rock is impermeable, lag time is reduced and peak discharge is increased (Figure 9b). The same effect occurs with heavy rainfall; with light rain there is time to infiltrate the ground, but heavier rainfall causes mostly overland flow (Figure 9c).
Draining wetlands or marshes removes water from such areas more quickly, increasing the peak flow and runoff volume. The rapid discharge of water reduces the time available for infiltration and may lower the water table, modifying the vegetation and changing the discharge characteristics of the area.
Question 1
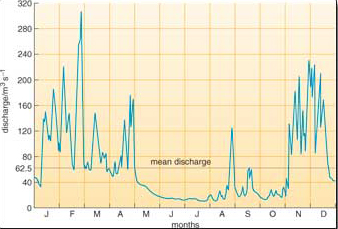
Figure 10 is a hydrograph, covering a period of a year.
a.Which climatic regime or regimes would produce a hydrograph of this shape?
b.What is the maximum discharge and how many times greater than the mean discharge is it?
c.What might be the cause of the high discharge peaks?
Answer
a.The general shape of the hydrograph indicates a temperatemaritime regime, with some contribution from melting snow in April. (The river is a British one, the Severn at Bewdley.)
b.The maximum discharge is about 310 m3 s−1. This is almost five times greater than the mean of 62.5 m3 s−1.
c.The high rates of discharge are caused by periods of heavy rain due to the passage of weather fronts.
The river represented in Figure 10 discharges more water in the winter, whereas demand for water is higher in the hotter summer. To satisfy the summer demand, water must be stored during the winter and spring.
Question 2
Estimate the percentage contributed by the baseflow to the discharge of the River Severn at Bewdley (Figure 10), for (a) the months November-April and (b) the months May-October. Give your answers to the nearest 10%. You may need to refer to Figure 7 to identify the baseflow component of the hydrograph.
Answer
The baseflow contribution on the hydrograph is the consistent flow that is independent of the rainstorm peaks. Both mean baseflow and discharge over a period of months can only be estimated approximately.
a.Mean baseflow is about 80m3 s−1 over the November to April period, and mean discharge during this period is about 120m3 s−1, so baseflow is about 60% of discharge for the winter months.
b.Mean baseflow is about 15m3 s−1 over the May to October period, and mean discharge during this period is about 20m3 s−1, so baseflow is about 75% of discharge for the summer months (when there is little evidence of overland flow, so the proportion contributed by the baseflow is relatively higher).
3 Reservoirs
3.1 Introduction
The simplest and oldest way of storing surface water is in reservoirs and this has been done for thousands of years. Most reservoirs are still built to increase water supplies, but some are also built for other purposes, especially for generating hydroelectric power and for protection against floods. The Tennessee River in the United States, for example, has reservoirs to trap and store water that would otherwise cause floods, the water being released when the height of the river falls to safe levels. The Aswan High Dam in Egypt is used both to generate electricity and reduce flooding, as well as to provide water for irrigation.
Most older reservoirs, particularly in the UK, are direct supply reservoirs; they store water for steady release by pipeline to the public supply. Many of the newer reservoirs are for river regulation (Box 2); stored water is released into rivers when the natural discharge is low, so that it can be abstracted for use further downstream. The river itself transports the water from the reservoir so a pipeline is unnecessary. Unregulated, the discharge in winter exceeds requirements, but by storing winter water the scheme provides more water in summer than would be naturally available in the river. The Clywedog reservoir on a tributary of the River Severn, for example, was built to store up to 50 million m3 of water in winter, releasing it during the summer. This is needed because, as Figure 10 shows, the summer discharge is only around 20 m3 s−1 downstream at Bewdley, whereas in winter about 120 m3 s−1 are discharged. Both direct supply reservoirs and river regulation reservoirs may be pumped storage reservoirs, which do not fill naturally from a river, but have water pumped up to them. Many of the reservoirs in the Thames Valley are pumped storage reservoirs.
Box 2 The Colorado River
The change in river discharge patterns caused by river regulation reservoirs can be seen on a long-period hydrograph of the Colorado River in the USA (Figure 11). The Colorado is a large river (its annual discharge is about ten times greater than the River Severn, Figure 10) and has great seasonal fluctuations: in 1920, for example, its discharge varied from 50 to 2600 m3 s−1. This seasonal variation is caused by mountain snowmelt in the upper parts of the Colorado catchment in Wyoming, Colorado and Utah.
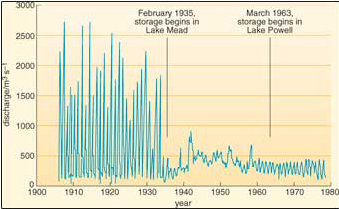
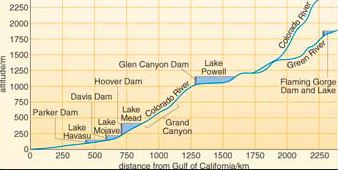
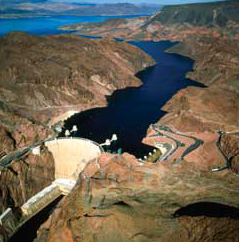
Downstream, the Colorado River flows through desert and its water is very important, but most of this flow was in the winter, when it was less useful for irrigation. Annual flooding was also common. To regulate the river flow, prevent flooding and to generate hydroelectric power, dams were built on the Colorado to create reservoirs (Figure 12). The first major dam, the Hoover Dam (Figure 13), was completed in 1935, forming the reservoir of Lake Mead. This holds most of the spring snowmelt and prevents very high discharges and flooding.
How did the discharge change after the creation of Lake Mead reservoir?
The peak discharge was reduced to about 800 m3 s−1 : much lower than previous highs of up to 2800 m3 s−1 before 1935.
How has Lake Mead affected the lower discharges of the Colorado?
These have increased, from typical values of 100-200 m3 s−1 before 1935, to 300-500 m3 s−1 from 1942 to 1955.
Raised lower discharges are because Lake Mead is a river regulation reservoir: water is released downstream into the river at a more constant rate than in the unregulated flow. Lake Mead is also a direct supply reservoir, supplying water by pipeline to eastern Nevada, and for hydroelectric power generation.
Even after the completion of Lake Mead there were still times when floodwaters filled the lake and were released downstream.
In which years, after 1935, did this happen?
There were peak discharges (although much lower than the pre-1935 peaks) in 1938, 1942, 1953 and 1958.
Another major reservoir, Lake Powell, was created upstream of Lake Mead in 1963 to trap this excess floodwater (Figures 11 and 12). Lake Powell is also used for water supply and hydroelectric power as well as river regulation. Since 1963, although there are still seasonal variations in flow, these are relatively small, with maximum flows of around 400 m3 s−1 and minimum flows of around 200 m3 s−1.
The multipurpose nature of the Colorado dams can cause particular problems. For example, although the dams have mostly eliminated the flooding along the lower Colorado, the reservoirs are often full in winter (with water being held for water supply use in summer) so no longer have the capacity to hold unexpected floodwaters.
The reservoirs trap most of the sediment behind the dams, which not only reduces the reservoir capacity, but also leaves the river below the dam lacking in nutrients and unable to support properly an aquatic ecosystem. The reservoirs are also polluted from heavy metals in the sediment (that would otherwise have been transported out to sea) and by oil, from recreational boats on the reservoirs. These factors have caused serious concerns about the environmental effects of big dams (Section 3.4).
3.2 Sites for reservoirs
The simplest way to create a reservoir is to build a dam across a river where it flows through a narrow, deep valley. This shape of valley would enable a considerable volume of water to be stored without flooding a large area of land or building a long dam. However, it is not always possible to find such a suitable site: a narrow, deep valley may not exist, or it may be too far from where the water is needed. A wide valley needing a long dam may have to be used, or even a flat lowland area that would need a low earth embankment surrounding most, if not all, of a shallow reservoir occupying a large area of land.
In practice, the following factors have to be considered when choosing a site for a water-supply reservoir:
1. an adequate supply of preferably high-quality water;
2. a minimum of detrimental effects on the environment;
3. sufficient elevation to provide a natural flow of water to the distribution system.
Once these general points are satisfied, the specific location of the reservoir requires:
4. a reasonably watertight reservoir base and sides;
5. no geological hazards such as instability of the sides of the valley or the likelihood of earthquakes;
6. a suitable site for the dam, preferably in a narrow valley.
The most important of these requirements are an adequate supply of water (1), preferably though not necessarily of high quality, and minimal environmental implications (2). All the other requirements can often be engineered, although it may be expensive to do so: water can be treated to improve its quality (1), or pumped to a higher level (3), and geological problems such as leakage (4) and instability (5) can be minimized.
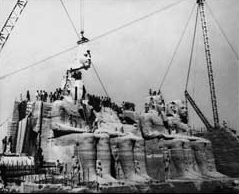
The possibility of detrimental ecological or environmental effects can provoke much opposition to plans for new reservoirs, but if the need for a reservoir is great enough and there are no alternative areas, the reservoir is usually built. For example, the proposal to build the Aswan High Dam in the 1960s provoked opposition not only in Egypt but also world-wide, partly on the ground that it would drown the ancient temples of Abu Simbel. The dam was nevertheless constructed, and some of the temples were moved (Figure 14).
The reservoir requirements that the area should be watertight, have minimal geological hazards, and have a suitable site for a dam, all involve considering the area's geology. Watertightness is affected by the permeability of the underlying rocks, as well as by the geological structure of the area, the nature of any superficial deposits, and the position of the water table.
If the underlying rocks are permeable, water may be lost from the reservoir by infiltration. Rocks with low permeability, suitable for reservoir areas, include clay-rich rocks, and most igneous and metamorphic rocks, provided they are not too highly fractured. However, reservoirs are sometimes built in areas with less suitable, more permeable rocks, such as sandstone or limestone, if no more suitable rocks are available. Such areas can be made more watertight by lining the floor with clay or injecting concrete into permeable zones, although both methods are very expensive and only suitable for small areas.
Most valley floors are covered with superficial deposits such as gravel, clay or peat. These usually have to be removed from the dam site so that the dam can be given a strong foundation in the underlying rock. Peat should be removed from the whole reservoir area as it is acidic and would affect the colour and quality of the water; but clays may be useful, as they are impermeable and can seal any underlying permeable rocks.
Problems caused by geological structures are not so easy to deal with. It is not usually possible to seal faults completely in the rocks under the area and some water may escape through them. If the rocks dip or are folded, water may be lost from the reservoir through the valley sides (Figure 15) or floor, or beneath the dam.
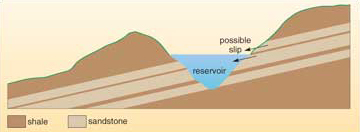
Reservoirs may contribute to the danger of landslides where a reservoir is sited on bedrock strata that dip towards the reservoir. The rocks on the right of the reservoir in Figure 15 are inclined towards it and consist of alternating sandstone and shale bands. The sandstones are permeable, and water in them percolates down to the shale bands. The shale bands are impermeable, so the water builds up above the shale until eventually it may act as a lubricant, allowing the sandstone above to slide downhill into the reservoir. This would displace a large volume of water and could cause flooding, the risk of damage and loss of life (Box 3).
Box 3 The Vaiont reservoir landslip
The Vaiont reservoir in Italy is in an area of limestones with marl bands (marl is a calcareous mudstone). The dam was completed in 1961 and was 262 m high. This was one of the highest dams in existence, and the considerable depth of water created, when the reservoir filled, raised the water table in the surrounding rocks and produced a large increase in pore pressure. This lubricated the beds of rock and, in 1963, after heavy rains, caused a large landslide which dumped enormous amounts of rock (around 2.7 × 10⁸ m3) into the reservoir from the flanking hillside (Figure 16). A huge volume of water was displaced, which surged over the dam and also back up the valley, causing around 2500 deaths in nearby villages. Remarkably, the dam itself remained intact.
3.3 Dams
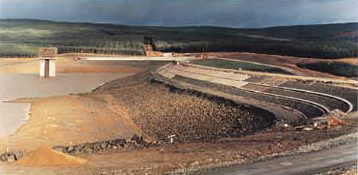
To economize on constructional materials and costs, it is desirable to build a dam at a narrow part of a valley so that the dam can be kept as short as possible. The quantity of constructional materials needed to build dams, and their cost, can be enormous. The Aswan High Dam, built during the 1960s, cost £400 million for a 1.2 km dam. Though shorter than the Aswan High Dam, the longest dam in Britain, the Kielder Dam in Northumberland (Figure 17), which was completed in 1980, was part of a scheme costing £150 million.
There are two fundamental types of dam, which have different ways of withstanding the pressure of water in the reservoir behind them: gravity dams and wall dams. The gravity dam depends on its own weight to prevent deformation or movement, whereas the wall dam is a rigid structure that resists deformation and transfers the pressure of the water to the floor and sides of the valley. Some dams are a combination of both types.
The simplest form of gravity dam is made up of carefully selected unconsolidated material such as clay or broken rock. This is called an earth dam (although it is not made of garden-type earth!). Earth dams usually have an impermeable clay core to reduce the seepage of water through the dam, and the sides are usually covered with broken blocks of rock or concrete to reduce erosion by waves. Gravity dams can also be constructed entirely of piled-up masonry (stone blocks) or concrete. Masonry or concrete gravity dams are usually built if the reservoir site is a narrow valley, but if a reservoir has to be built in a wide valley or in a lowland area, earth dams are used as they are less expensive. Figure 18 shows how the Aswan High Dam, an earth dam, was built. The Kielder Dam is also an earth dam (Figure 17).
Wall dams are usually built only in narrow valleys, when a relatively high dam is needed. They must be strong and impermeable, and are made of masonry or concrete. Their strength is often increased by making them curved in plan (convex towards the reservoir, just as curved arches are used to support heavy roofs in churches), or with buttresses on the downriver side (similar to those used to stop church walls falling outwards), or by reinforcing them internally with steel cables. The Hoover Dam on the Colorado River is an example of a wall dam (Figure 13).
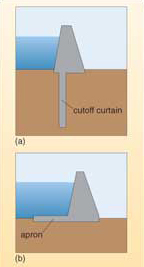
Seepage below dams can be reduced by a cutoff curtain and/or an apron. A cutoff curtain is a narrow impermeable layer, usually made of concrete, extending vertically below the dam, to reduce horizontal seepage of water under the dam (Figures 18 and 19a). The cutoff curtain extends downwards to a depth that is usually greater than the height of the dam, and if possible goes down into impermeable rock. An apron is a horizontal impermeable layer at the foot of the dam wall to reduce downward seepage from the reservoir (Figure 19b).
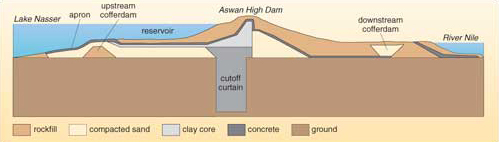
One of the problems of building a dam in the valley of a major river lies in excluding water from the dam site while the dam is being built. Small temporary dams, called cofferdams, are often constructed for this purpose, and are sometimes incorporated into the main dam (Figure 18).
3.4 Environmental effects of reservoir construction
Reservoirs may totally alter the water resources of a country. Before the Aswan Dam was completed in Egypt, more than half of the 8 × 10¹⁰ m3 of water that flowed down the River Nile through Egypt each year ran into the sea. Most of the water can now be used in Egypt, mainly for irrigation, and instead of a single annual crop grown after seasonal flooding, more than one crop can be grown each year. However, advantages such as these must be considered in conjunction with the environmental side-effects of reservoir construction. The major side-effects are detailed below.
3.4.1 Land use
By their very nature, reservoirs occupy large areas of land. Lake Nasser, the reservoir created by the Aswan Dam, has an area of 6000 km2, and even in Britain some 250 km2 of land is covered by reservoirs. The largest in the UK is Kielder Water in Northumberland, which covers about 10.5 km2. British reservoirs are generally in upland areas of scenic beauty that are otherwise suitable only for hiking and related pastimes, and as rough grazing for sheep, but reservoirs may cover up rich farmland or villages, or destroy sites of outstanding natural beauty or of archaeological importance. Land itself is an important resource, and drowning it under a reservoir may not be the best use of that resource, especially if the water can be supplied by alternative means.
3.4.2 Ecological changes
Creation of a reservoir produces ecological changes not only to the area of the reservoir itself, by destroying the natural vegetation, but also upstream and downstream of the reservoir. The gradient of a river upstream of a reservoir may be reduced, so the water will slow down, changing the character of the river, causing deposition of sediment, and changes to the natural vegetation and animal life. Downstream of the reservoir the discharge will change, as well as the sediment load, also affecting the plants and animals. For example, annual flooding may cease.
3.4.3 Dam failure
Dams may collapse, releasing large amounts of water downstream, causing destruction of buildings and killing people and animals. Collapse may be caused by inappropriate construction, failure of the underlying sediments or rock, overfilling or earthquakes. The dam for the Carsington reservoir, in Derbyshire, collapsed during construction in 1984 due to failure of underlying sediments. Earthquake damage to dams is rare but does occur. Although China, for example, has thousands of dams in earthquake areas, none has collapsed in recent years from earthquake damage, but in the UK, an area of low earthquake activity, the Earl's Burn Dam near Stirling failed following an earthquake in 1839.
3.4.4 Sediment filling
The lifetime of reservoirs can vary greatly. Many reservoirs have lasted for over a hundred years, but some may be useful for only a much shorter period—fifty years or so — not because of the general deterioration of the dam as it gets older, but because sediment accumulates in the reservoir. Rivers carry large amounts of mud, silt and sand in suspension, particularly during floods, and when a river enters a reservoir it slows down and the sediment carried in suspension is deposited on the floor of the reservoir. Lake Mead, on the Colorado River, has had its storage capacity reduced by over a half since the dam was completed in 1935. This is less of a problem for UK reservoirs, as rivers here are smaller and carry much less sediment. The Derwent Valley reservoirs in Derbyshire have had their volumes reduced by less than 1% through sedimentation in the 70 years since they were completed. Some water-supply reservoirs are constructed so that sediment-laden floodwaters can bypass the reservoir, but obviously this is not possible where the reservoirs are intended for flood control.
3.4.5 Sediment loss to agriculture
The trapping of sediment behind dams may also affect agriculture. The Nile Valley, for example, used to flood naturally once a year, and the sediment in the waters was deposited on the land, forming a fertile soil. These floodwaters and the sediment they carry are now trapped behind the Aswan Dam, and artificial fertilizers must be used down river in the valley. Without the yearly supply of sediment in floodwater, the banks of the Nile are eroding downstream of the dam, and the Nile delta is reducing in size; the erosion by wave action no longer being counteracted by a fresh supply of sediment.
3.4.6 Soil salinization
The change from annual flooding by a river to perennial irrigation that can be provided from a reservoir can cause soil salinization, if salts normally present in the river water accumulate in the soil as the water evaporates. These salts were previously washed away by the flooding, but the reduced supply of water by irrigation leaves them in the soil. The water is taken in by plants, or evaporated by the sun, leaving the salts behind. This causes a decline in crop yields until eventually the soil becomes useless for agriculture. It can be prevented by using enough irrigation water to wash the salts through the soil, and draining this water from the fields.
3.4.7 Induced earthquakes
Some reservoirs cause earthquakes to occur. This is perhaps not so surprising, as earthquakes are caused by stress in rocks, and the addition of a large mass of water in a reservoir on top of the rocks at the Earth's surface stresses the rocks and can trigger an earthquake. Not all reservoirs induce earthquakes: it is in general only the larger reservoirs, or the deeper ones (over 100m deep), and only if the reservoir is built in an earthquake area, releasing stress already stored in the rocks. Induced earthquakes mainly occur during changes in water level in a reservoir, particularly during initial filling or during seasonal changes of water level.
Reservoirs that have experienced induced earthquakes include Marathon, Greece (1931), Lake Mead, USA (from 1938), Kariba, Zimbabwe (1963), Lake Nasser, Egypt (from 1965), Koyna, India (1967) and Thomson, Australia (1996). So far (2004), none of these induced earthquakes have caused total dam failure, but the largest, at Koyna, was of considerable size (Richter magnitude 6.5, the equivalent of 100 Hiroshima atomic bombs), and led to damage of the dam.
Many of these environmental effects are illustrated by the Narmada Project (Box 4).
Box 4 The Narmada Valley Development Project, India: salvation or environmental disaster?
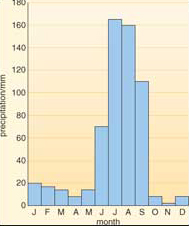
India suffers from widespread water scarcity, mainly because precipitation comes in one seasonal period, the monsoon, which lasts from about June to September (Figure 20). Reservoirs can be used to store the seasonal rain so it can be used year-round or transferred to an area of need. The Narmada River (the name means 'one who endows with bliss') is 1400 km long and is one of India's most sacred rivers. It originates in the centre of India and flows westwards through three states - Madhya Pradesh, Gujarat and Maharastra — and then into the Arabian Sea. These three states are particularly prone to prolonged drought.
A project is under way (the Narmada Valley Development Project, NVDP) to build 30 major dams, along with smaller ones, on the river over the next 50 years, to supply drinking water for the region, for irrigation, to protect the area from flooding and to generate hydroelectric power. Its estimated cost is around $11,400 million, the most expensive construction project undertaken in India. In 1987, work began on the largest dam for the NVDP, Sardar Sarovar. The NVDP, and particularly the building of the giant dam, has caused huge controversy, both in India (Figure 21) and globally. The Sardar Sarovar dam has a planned final height of 139 m and the reservoir length is 214 km. It will displace around half a million people, and destroy forest as well as some of India's most fertile agricultural land.

The main Indian opposition organization to the NVDP, the Narmarda Bachao Andolan (NBA), campaigned strongly against the dam, gaining support from both Indian and world opposition. In the 1980s NBA mobilized the local population, with marches, sit-ins and fasts (resulting in imprisonment for the leaders); caused the World Bank to review its funding of the project and to withdraw funding in 1993; and petitioned the Indian supreme court in 1994, which halted construction in 1995. However, in 2000 the supreme court ruled that the construction should go ahead, and at the time of writing (2004) the dam was near completion.
The scheme is enormously popular with the dam contractors and with political parties in those local Indian states which will benefit from the extra water and electricity. It is also popular with those who have had to walk miles to collect water each day and who do not have enough water to irrigate their crops. It is not popular, however, with those forced to move from villages that will be submerged, or environmental organizations that fear for the ecology of the Narmada.
Opposition to the NVDP is on social, environmental, economic and safety grounds:
Social: huge numbers of people are evicted from their lands, homes, and traditional way of life, to make way for reservoirs. Past resettlement schemes in India have had a very poor record, offering poor land and a reduced standard of living.
Environmental: the loss of agricultural land and forests, the loss of fisheries, contamination of water, a reduction in fertility of the land, and an increase in waterborne diseases.
Economic: the water will be very expensive. Independent analyses by the World Bank, the Central Government of India and the NBA all find that the costs have been underestimated (and the benefits exaggerated).
Safety: the Narmada valley is an earthquake area and has had substantial earthquakes in the past, up to magnitude 6.25. The Sardar Sarovar dam has also been built on a geological fault that may move in an earthquake. Any failure of the dam through an earthquake, unsound foundations, poor construction, failure of an upstream dam or terrorism could wipe out towns and villages downstream, killing hundreds of thousands of people.
The opponents' case is that the same benefits could be gained by a less grandiose scheme of local water projects, which could do the same job at a fraction of the cost, and with minimal environmental damage. This would involve decentralized, small rainwater harvesting schemes, more equitable sharing of water, water conservation, improved efficiency of water supply and irrigation, the restoration of degraded watershed vegetation and less water-intensive farming.
3.5 Big dams in the future?
Throughout the 20th century, reservoir construction to improve water resources was considered a key component of development. It was undertaken universally by industrialized nations, and by the later 20th century, increasingly by developing nations, building bigger and bigger dams. More recently the debate over the environmental impact of big dams and their questionable cost-benefit analysis has been universally recognized. In the 1990s the Narmada scheme caused the World Bank to rethink its policy on financing big dams, and also triggered the formation of the World Commission on Dams in 1998 which published the influential Dams and Development: A New Framework for Decision-Making, in 2000.
There is the question of sustainable development (summarized in Sheldon, 2005). To be sustainable, development must meet the needs of the present without compromising the ability of future generations to meet their own needs. Environmentalist opponents to the Narmada scheme argued that it is non-sustainable, given the environmental side-effects and the fear that the necessary maintenance of the dams, reservoirs and irrigation canals may not be carried out.
Many big dam projects are complicated by their multipurpose nature, for any combination of water supply, flood prevention, and hydroelectric power. These purposes may conflict, as we saw, for example, for the Hoover Dam in the USA. For Narmada, one of the opponents of the scheme, the Booker prize-winning Indian novelist Arundhati Roy, wrote:
The thing about multipurpose dams like the Sardar Sarovar is that their purposes (irrigation, power production, and flood control) conflict with one another. Irrigation uses up the water you need to produce power. Flood control requires you to keep the reservoir empty during the monsoon months to deal with an anticipated surfeit of water. And if there's no surfeit, you're left with an empty dam. And this defeats the purpose of irrigation, which is to store the monsoon water.
(Roy, 1999)
Will sustainable development mean that no new big dams are built for water resources in the 21st century?
Conclusion
Many rivers are fed by springs, which occur at points where groundwater reaches the surface. Springs can occur in different geological settings, forming valley springs, stratum springs or solution channel springs.
The water in a river originates from overland flow, from interflow and from baseflow. Baseflow forms a higher proportion of river water in summer than in winter, and in rivers flowing over good aquifers.
River discharge at a particular point is usually determined by measuring the stage, which is the water level in the river, and then reading off a value for the discharge from the rating curve — a plot of measured discharge for various stages. A river discharge hydrograph is a record of the discharge over a period of time. The shape of a short-period hydrograph (the record for a few days) depends on the size, shape, geology, vegetation and land use of the river catchment. The shape of the long-period hydrograph (e.g. for a year) depends primarily on the type of climate in the river catchment.
Reservoirs increase the amount of water stored on the land surface. They can be used as direct supply reservoirs or for river regulation. Reservoirs may also be built solely or partly for other purposes, such as the generation of hydroelectricity or for flood prevention.
The criteria for selecting sites for water-supply reservoirs are: a good supply of high-quality water, minimum ecological and environmental disturbance, a high elevation, a watertight reservoir area, no geological hazards and a suitable dam site. The most suitable reservoir sites are narrow, deep valleys, but reservoirs often have to be built in wider valleys or in flatter lowland areas.
There are two types of dams, gravity dams and wall dams. The gravity dam depends on its own weight to maintain stability, whereas the wall dam is a rigid structure that transfers the pressure of the water to the floor and sides of a valley.
The environmental effects of constructing a reservoir include the loss of a large area of land, ecological changes, dam failure, sediment filling, sediment loss to agriculture, soil salinization and induced earthquakes.
Reservoir projects involving big dams are becoming increasingly subject to scrutiny, particularly on the grounds of sustainable development.
References
Acknowledgements
Course image: Jim Nix in Flickr made available under Creative Commons Attribution-NonCommercial-ShareAlike 2.0 Licence.
Grateful acknowledgement is made to the following sources for permission to reproduce material in this course:
This content is made available under a Creative Commons Attribution-NonCommercial-ShareAlike 4.0 Licence. See Terms and Conditions.
Figure 1 Copyright © Jos Joslin, National Trails Office
Figure 2 Dr Sandy Smith
Figures 4 and 6 Dr Andy Sutton
Figure 10 National Rivers Authority
Figure 11 Chorley, R.J., Schumm, S.A. and Sugden, D.E.(1984) Geomorphology, Methuen and Co
Figure 12 Graf, W.L/ (1985) The Colorado River, Resource Publications in Geography, Association of American Geographers, Washington, DC
Figure 13 Bernhard Edmaier/Science Photo Library
Figure 14 Copyright © Popperfoto
Figure 17 Photo by Winter and Kidson, courtesy Fairclough Civil Engineering Ltd
Figure 21 © Reuters/Corbis
All other material contained within this course originated at the Open University
This resource was created by the Open University and released in OpenLearn as part of the 'C-change in GEES' project exploring the open licensing of climate change and sustainability resources in the Geography, Earth and Environmental Sciences. The C-change in GEES project was funded by HEFCE as part of the JISC/HE Academy UKOER programme and coordinated by the GEES Subject Centre.
Don't miss out:
If reading this text has inspired you to learn more, you may be interested in joining the millions of people who discover our free learning resources and qualifications by visiting The Open University - www.open.edu/ openlearn/ free-courses