Icy bodies: Europa and elsewhere
Use 'Print preview' to check the number of pages and printer settings.
Print functionality varies between browsers.
Printable page generated Tuesday, 9 June 2026, 8:20 AM
Icy bodies: Europa and elsewhere
Introduction
Until the 1980s, the icy satellites of the outer planets were scarcely thought of as places where life could ever have existed. Few could have imagined that one of them, Europa, would within twenty years have become the rival of Mars as a priority for astrobiological study. This course recounts the history of our changing perceptions of the icy satellites, examines the available evidence for their internal structures, and considers the niches offered for life to begin and to be sustained. In this context, the 'habitable zone' embraces settings devoid of both sunlight and an atmosphere. These are areas where life could survive on the energy from chemical reactions made possible by the discharge of hot chemically enriched fluids through vents on the floor of an ocean capped by a thick layer of ice. Note that 'ice' does not necessarily mean just frozen water. In the outer Solar System, although H2O is usually the dominant component, ice can incorporate other frozen volatiles such as NH3, CO2, CO, CH4 and N2.
This OpenLearn course is an adapted extract from the Open University course S283 Planetary science and the search for life.
Learning outcomes
After studying this course, you should be able to:
discuss processes upon and within, and internal structure of, differentiated icy bodies (primarily large satellites) in comparison with the terrestrial planets
describe the conditions that may be required to originate and foster life in an icy body and discuss the likelihood of their having occurred
recognise the moral and ethical issues of landing spacecraft on potential life-bearing worlds and appreciate the need for appropriate professional codes of conduct in this respect.
1 Icy satellites: introduction
1.1 Satellite discoveries
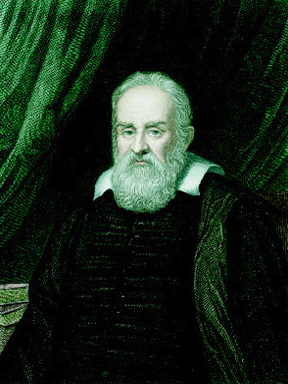
Pisa-born pioneer of the experimental scientific method, Galileo Galilei's analysis of motion paved the way for Isaac Newton's work. He used one of the first telescopes to discover the four largest of Jupiter's satellites and the phases of Venus. His consequent support for the theory that the Earth moves around the Sun led to his imprisonment for heresy in 1633.
All the giant planets have satellites. Jupiter's four largest satellites were discovered in 1610 by Galileo Galilei (Figure 1), using one of the first telescopes to be pointed at the night sky. These are now known as the Galilean satellites. They are much bigger than Jupiter's other satellites, the first of which was not discovered until 1892. Saturn's largest satellite, Titan, was discovered in 1655, and four more had been found by 1700.
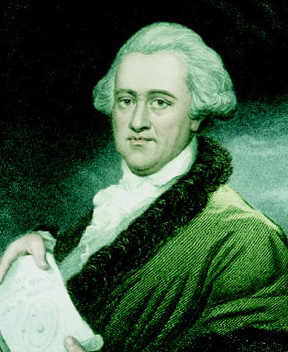
Born in Hanover, Herschel moved to England as a young man to work as a musician. He became an astronomer and was elected a Fellow of the Royal Society in 1781, on the strength of his lunar observations and his discovery of Uranus. Using his own 48-inch (122 cm) reflecting telescope, he discovered Titania and Oberon (satellites of Uranus) in 1787 and then Enceladus and Mimas (satellites of Saturn) in 1789.
Sir William Herschel (Figure 2) discovered the first two of Uranus's satellites in 1787, less than six years after he had discovered the planet itself.
Neptune's largest satellite, Triton, was discovered by William Lassell (Figure 3) in 1846 - within three weeks of the planet being identified. Smaller and fainter satellites continued to be found. By 1950 the known tally of outer planet satellites was Jupiter, eleven; Saturn, nine; Uranus, five; and Neptune, two.
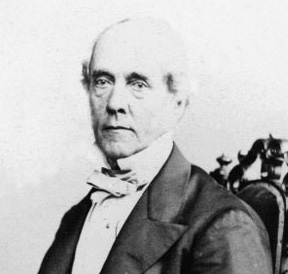
A Liverpool businessman who made his fortune in the brewing trade, William Lassell designed and built his own telescopes, including a 24-inch (61 cm) reflector, with which he discovered Triton in 1846 and two satellites of Uranus (Ariel and Umbriel) in 1851.
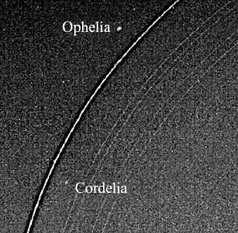
Discoveries of lesser satellites only a few kilometres across continue to be made. In the competition to be the planet with the largest number of known satellites, the lead has changed several times between Jupiter, Saturn and Uranus. However, all the satellites of the giant planets that are large enough for their own gravity to pull them into a near-spherical shape have certainly been found. For an icy body, this means the satellite must have a radius of more than about 200 km. These larger bodies are the satellites of greatest potential for astrobiology, and their basic properties are listed in Table 1. Two of these satellites are larger than the planet Mercury, but not so massive, because their densities are less. Four are bigger and more massive than the Moon, and a total of six are bigger and more massive than Pluto. Pluto itself (discovered in 1930) and its satellite Charon (discovered in 1978) share many of the characteristics of the large icy satellites, and so they are also listed in the table.
| Planet | Satellite | Mean distance from planet/103km | Orbital period/Earth days | Radius/km | Mass/1020kg | Density/103kgm−3 |
| Jupiter | 4 inner | <221.9 | <0.675 | <125 | - | - |
| Io | 421.6 | 1.77 | 1821 | 893 | 3.53 | |
| Europa | 670.9 | 3.55 | 1565 | 480 | 2.99 | |
| Ganymede | 1070 | 7.15 | 2634 | 1482 | 1.94 | |
| Callisto | 1883 | 16.7 | 2403 | 1076 | 1.83 | |
| 55 outer | >7435 | >130 | <85 | - | - | |
| Saturn* | 6 inner | <151.4 | <0.695 | <99 | - | - |
| Mimas | 185.5 | 0.942 | 199 | 0.375 | 1.14 | |
| Enceladus | 238.0 | 1.37 | 249 | 0.649 | 1.00 | |
| Tethys | 294.7 | 1.89 | 530 | 6.28 | 1.00 | |
| Dione | 377.4 | 2.74 | 560 | 10.5 | 1.44 | |
| Rhea | 527.0 | 4.52 | 764 | 23.1 | 1.24 | |
| Titan | 1221.9 | 16.0 | 2575 | 1346 | 1.88 | |
| Hyperion | 1481.1 | 21.3 | 165×113 | 0.11 | 1.1 | |
| Iapetus | 3561.3 | 79.3 | 718 | 16 | 1.0 | |
| Phoebe | 12952 | 551R | 115×105 | 0.007 | 2.3 | |
| 13 outer | >11300 | >449 | <16 | - | - | |
| Uranus | 13 inner | <97.7 | <0.762 | <77 | - | - |
| Miranda | 129.8 | 1.42 | 236 | 0.659 | 1.20 | |
| Ariel | 191.2 | 2.52 | 579 | 13.5 | 1.67 | |
| Umbriel | 266.0 | 4.14 | 585 | 11.7 | 1.40 | |
| Titania | 435.8 | 8.71 | 789 | 35.3 | 1.71 | |
| Oberon | 582.6 | 13.5 | 761 | 30.1 | 1.63 | |
| 9 outer | >4276 | >267 | <190 | - | - | |
| Neptune | 5 inner | <73.5 | <0.55 | <104 | - | - |
| Proteus | 117.6 | 1.12 | 218×208×201 | 0.49 | 1.3 | |
| Triton | 354.7 | 5.88R | 1353 | 215 | 2.05 | |
| Nereid | 5513 | 360 | 170 | 0.3 | 1.5 | |
| 5 outer | >15686 | >1874 | <40 | - | - | |
| Pluto | - | - | 1150 | 131 | 2.0 | |
| Charon | 19.4 | 6.39 | 586 | 16.1 | 1.9 |
1.2 Satellite systems and their origins
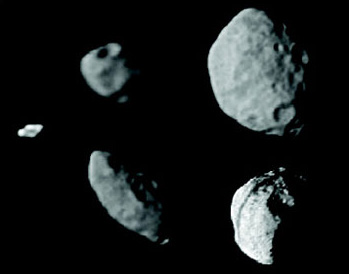
The satellite systems of the giant planets have several features in common. Most satellites are in synchronous rotation, always keeping the same face towards their planet. Irregularly shaped moonlets associated with the ring system orbit closest to the planet. They travel in near-circular prograde orbits in the planet's equatorial plane. ('Prograde' in this sense means orbiting in the same direction as the planet's spin.) These moonlets (like the rings) are believed to be fragments of larger satellites that were destroyed by collisions or tidal forces (Figures 4 and 5). Most are bright and presumed to be icy in composition.
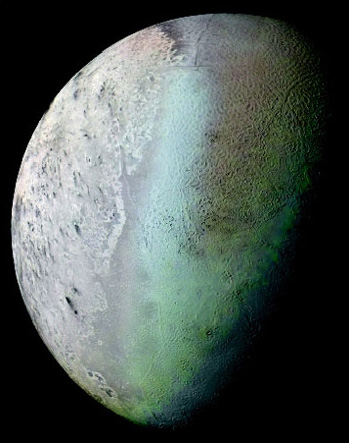
Orbiting further from each planet come all the satellites large enough to be spherical (or nearly so) in shape, typically in near-circular prograde orbits close to the planet's equatorial plane. These satellites probably grew within a disc of gas and dust that surrounded the planet in the later stages of its growth, mimicking in miniature the birth of the terrestrial planets from the solar nebula. Neptune's large satellite, Triton, is an exception (Figure 6). This has a retrograde orbit, and may be a Pluto-like Kuiper Belt object that was captured into orbit around Neptune some billions of years ago. (We have used the term 'Kuiper Belt' but you may also see it called the 'Edgeworth-Kuiper Belt'. Kenneth Edgeworth, a British astronomer, published similar ideas a few years prior to Kuiper, but this only really came to light after the term 'Kuiper Belt' had become widely established.)
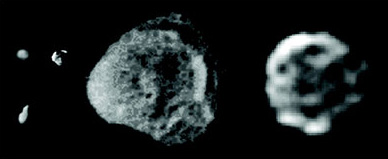
Beyond its large satellites each giant planet has a second collection of small irregular-shaped satellites, travelling in elongated, inclined and in many cases retrograde orbits. Most are dark bodies, rich in silicates and/or carbon compounds. These satellites are likely to be captured comets or asteroids (Figure 7).
1.3 Unravelling the natures of the large satellites
Before the dawn of the space age, relatively little could be discovered about even the large satellites. Their orbits were well known, and from the subtle orbital perturbations caused by neighbouring satellites it was possible to deduce their masses. Measurements of their sizes enabled densities to be calculated to within about 20 per cent of the currently accepted values for the Galilean satellites, and with rather less certainty for the large satellites of the other giant planets. However, it was clear that, except for Io and Europa, these bodies are not dense enough to be composed largely of rock like the terrestrial planets.
During the 1950s, spectroscopic studies by Gerard Kuiper (Figure 8), the discoverer of Titan's atmosphere, showed that the surface of Europa is mostly clean bright water-ice, whereas that of Ganymede (which has a lower albedo) is water-ice darkened by a dusty contaminant. (We use the term 'water-ice' where necessary to make it clear that we mean frozen water, as opposed to any other kind of ice.) Spectroscopic studies have now revealed that ice dominates the surfaces of all the large satellites except Io, which is effectively a terrestrial planet in orbit about Jupiter. In the Jupiter system, the ice is dominantly frozen water, but with increasing distance from the Sun it becomes mixed with more volatile ices. There is indirect evidence for ammonia in the ices of Uranus's satellites, and on Neptune's large satellite Triton spectroscopic observations have detected frozen nitrogen, carbon dioxide, carbon monoxide and methane. A similar mixture to that on Triton coats Pluto's surface.

Gerard Kuiper, a Dutch-born American planetary scientist, discovered Titan's atmosphere in 1944 and subsequently used spectroscopy to identify carbon dioxide in the atmosphere of Mars and ice on the surfaces of Europa and Ganymede. He discovered Miranda (Uranus) in 1948 and Nereid (Neptune) in 1949. In 1951 he suggested that there should be a zone of primordial debris beyond the orbit of Neptune. Although the first body in this zone was not discovered until nearly twenty years after his death, it is generally known as the Kuiper belt.
All of this is consistent with our understanding of the nature of the materials from which the Solar System formed, under conditions of progressively lower temperatures at greater distances from the Sun.
The icy satellites came to be regarded as worlds made of ice mixed with rock because their densities are greater than any variety of ice. This was because the silicate minerals that form rock constitute the most abundant denser material known to exist in the Solar System. Whether these satellites are differentiated bodies with the rock forming a dense core surrounded by a less-dense icy mantle, or whether they are undifferentiated uniform mixtures of rock and ice was assumed to depend on their accretion histories. An undifferentiated structure would imply homogenous accretion (rock and ice simultaneously) combined with insufficient heating to trigger differentiation. A differentiated structure could result from heterogeneous accretion (rock first, then ice) or from homogenous accretion if the rate of energy release during the accretion process generated enough heat to melt or at least mobilise the ice.
Question 1
If a body of average density ρav consists of a mixture of just two components, a dense one with density ρdense and a light one with density ρlight, the way to work out what fraction of the body's volume is made of each is as follows. Let the fraction made of the dense component be x. The fraction made of the light component must then be (1−x).
There is a simple equation relating these values:

(a) Use Equation 1 to calculate the fraction of Callisto's volume occupied by rock, given that Callisto's average density is 1.83×10³ kg m−3. Assume the density of rock to be similar to that of chondritic meteorites, which is about 3.10×10³ kg m−3 and the density of ice to be about 0.95×10³ kg m−3.
(b) Suggest some factors that could make the value calculated in this way unreliable.
Answer
(a) There are various ways to work this out - here is ours. The value we are looking for is ×, so we need to rearrange the equation to isolate all the terms involving × on the same side. First, expand the bracket, to get:

Next, subtract ρlight from each side:

Rearranging this equation:

We can now divide both sides by (ρdense - ρlight) to get:
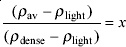
Now we can simply insert the density values we were given. Callisto's average density is ρav, ice density is ρlight and rock density is ρdense, so:
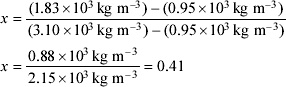
The fraction of Callisto's volume occupied by rock is about 0.41.
(b) One reason the value may be unreliable is that the densities used are for rock and ice at low pressure. In the interior of a large icy satellite the pressure might be high enough for self-compression to lead to significantly higher densities. Another reason is that the method assumes rock and ice only, and ignores the possibility that there could be an even denser component such as an iron-rich inner core.
Irrespective of whether the rock is dispersed or concentrated, the total rock content of these bodies is too low for radiogenic heating, by the decay of radioactive elements contained within the rock, to provide sufficient heat to mobilise their interiors and refresh their surfaces. In the 1960s, the average surface temperatures of the Galilean satellites were established to be lower than −150 °C using infrared telescopes. This is so low that the ice near the surface must have comparable mechanical properties to rock near the surface of a terrestrial planet. Such ice is far too cold to behave like glacier ice on Earth, which is capable of flowing downhill under its own weight. Thus, whatever their internal structure and their mode of origin, all the icy satellites at Jupiter and beyond (where surface temperatures are even lower) were assumed to have long been geologically dead, with the implication that they must be densely covered by impact craters that have built up during the past four billion years.
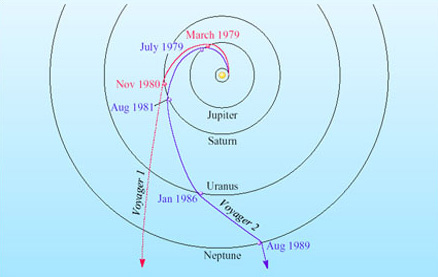
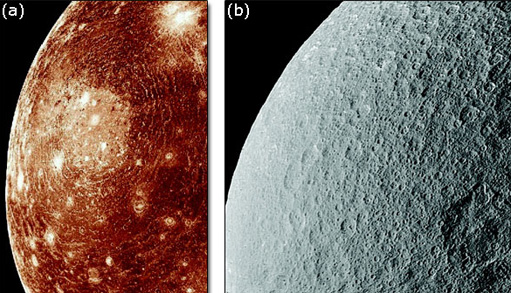
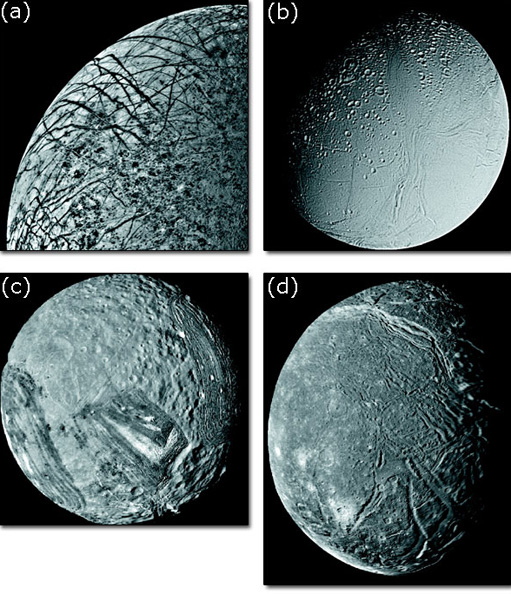
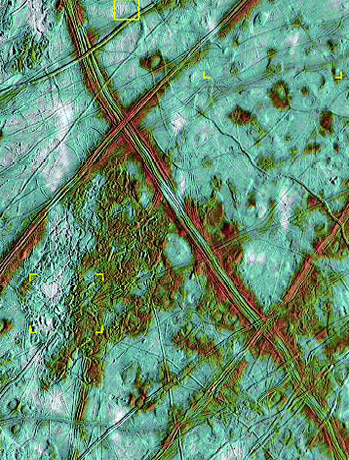
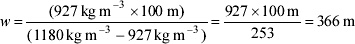
Just how wrong some of these suppositions were did not become apparent until close-up images of the satellites of the outer planets were sent back by spacecraft. Only the merest hints were provided by the blurry images returned by the first probes to visit Jupiter, Pioneers 10 and 11 in 1973 and 1974. The situation became much clearer thanks to the remarkable tours of the outer Solar System accomplished by the two probes of NASA's Voyager series, beginning with Voyager 1's encounter with Jupiter in March 1979 and ending with Voyager 2's fly-by of Neptune in August 1989 (Box 1). These revealed a startling diversity of landscapes on the icy satellites. Some are indeed heavily cratered, and look much like what most people expected (Figure 10).But others have a complex variety of terrain types, showing relatively few impact craters but many signs that faulting, flooding and other resurfacing processes have acted to disrupt or bury any ancient heavily cratered terrains that may formerly have existed (Figure 11).
Box 1: The Voyager project
In 1977, NASA launched two probes named Voyager to explore the outer Solar System (Figure 9). Voyager 1 flew through the Jupiter system in March 1979, and used Jupiter's gravity to redirect its trajectory towards Saturn, which it passed in November 1980. Voyager 2 used the same 'gravity assist' tactics to visit all four giant planets in turn, beginning with Jupiter in July 1979 and concluding with Neptune in August 1989.
Each of the Voyager probes weighed 825 kg, of which 105 kg was scientific instruments. These included cameras, spectrometers, polarimeters (to measure polarisation of reflected radiation) and magnetometers. Because it was designed to travel so far from the Sun, power was provided not by solar panels but by the heat produced by radioactive decay in a plutonium-rich thermoelectric generator.
With the exception of Titan, no satellite has an atmosphere thick enough to protect its surface from bombardment. The surface of an icy satellite scatters sunlight fairly evenly in all directions, which means that not even the youngest surface consists of a continuous sheet of smooth ice. Instead, any ice that was a continuous sheet originally has become broken (presumably by meteorite and micrometeorite impact) into a mass of granular fragments, with a wide range of particle sizes, in the same way that the lunar surface consists of a regolith of rock debris. Presumably the icy regolith is thinner (only a few particles in thickness) on the youngest icy surfaces and thickest (several metres or more) on the oldest surfaces.
Unfortunately, the resurfacing events on satellites such as those in Figure 11 are impossible to date. The lunar cratering timescale, which has been calibrated radiometrically (i.e., using dating methods based on the decay of radioactive isotopes), cannot be applied in the outer Solar System. This is because we can have no expectation that the Moon (1 AU from the Sun) suffered the same rate of impact bombardment as a satellite of Jupiter (5 AU from the Sun) or a satellite of Saturn at a range of nearly 10 AU. Indeed, when the size-frequency distributions of craters on the icy satellites are examined, it is found that the pattern of distribution of craters versus size range differs from the satellites of one giant planet to the next, and that each is different to that found on the Moon. ('Size-frequency distribution' is a term used to describe the relative numbers of objects - in this case, craters - across a range of sizes.) This is convincing proof that different populations of impactors affected each region of the Solar System, so it is likely that cratering rates also behaved differently in each region. We can imagine a general decrease over time, but there may have been localised flurries of cratering, such as would be caused by the impact of debris originating from a nearby satellite that had been broken apart by a single, random, exceptionally large impact. Thus, while we can be reasonably confident that a less densely cratered surface is younger than a more densely cratered surface when comparing between satellites of the same giant planet, we cannot make any such comparison between a less densely cratered surface on a satellite of, say, Jupiter, and a more densely cratered surface of a satellite of, say, Saturn.
On many individual satellites, the differences in crater density between the oldest terrain (which may be a surface that is four billion years old) and the youngest resurfaced terrain suggest that the latter is considerably younger. In order for their surfaces to have been regenerated from within, these satellites must have experienced internal heating.
There are several reasons why radiogenic heating can be ruled out as a significant factor in this heat generation:
The total rock content of these satellites is far too low to generate enough heat, unless the rock has some implausibly weird composition, with ten to a hundred times more radioactive elements than chondritic meteorites.
Any exotic rock composition would have to vary enormously within a single satellite system to explain the geologically complex surface of Enceladus (Figure 11b) in contrast to the passive densely cratered surface of its fellow satellite Rhea (Figure 10b). Rhea is twenty-five times more massive and ought to be producing more radiogenic heat than tiny Enceladus.
Radiogenic heating ought to decay gradually over time, which is not reflected in the resurfacing histories of the more active satellites.
1.4 The discovery of tidal heating
The Voyager fly-bys of the Jupiter system convinced planetary scientists that former preconceptions about 'dead' globes were wrong - even before Voyager 1 had got as far as Saturn, the mission had enabled them to identify a new heating mechanism to explain the discrepancies. The ease with which this revolution in thought was brought about was thanks to some of the Voyager images of Io, Jupiter's innermost Galilean satellite. Io is only a fraction larger and denser than the Moon, and so by rights Io should have been geologically quiet for the past 2-3 billion years. However, Io has a surface so young that (even with the more detailed images obtained subsequently) even the youngest impact craters have been erased and there are usually several volcanoes erupting simultaneously (Figure 12). Some of the eruptions are large enough to track using modern infrared telescopes in high-altitude observatories such as on the summit of Mauna Kea, Hawaii.
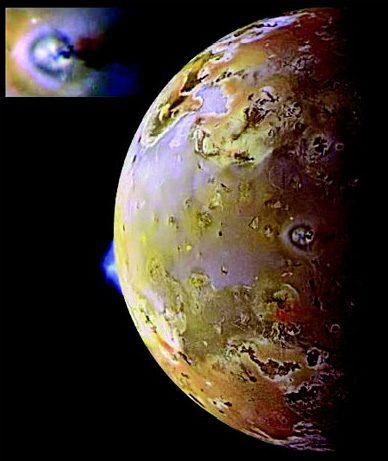
The above image was recorded on 28 June 1997 by the Galileo Orbiter, but it shows similar processes to those revealed 18 years previously by Voyager 1. The surface is dominated by lava flows, stained yellow and red by oxides of sulfur. An eruption plume can be seen rising 140 km above the limb (from a volcano named Pillan Patera), and a second eruption plume at the volcano Prometheus is seen from directly above near the centre of the disc. This is enlarged in the inset at the upper left. The bluish ring is the outline of the plume, which casts a reddish shadow onto the surface to its right. The black surface feature beneath the right-hand part of the plume is a lava flow that has erupted continually since 1979.
Most planetary scientists were staggered to find active volcanoes on Io, but not the authors of a paper that had been published in the journal Science just a few days before Voyager 1 arrived at Jupiter. In this paper, Stanton Peale and colleagues proposed that Io's interior should be largely molten because of heat generated by the tidal stressing experienced by Io as it orbits Jupiter. Although the degree of melting within Io remains open to debate, tidal heating (Box 2) was rapidly accepted as the power source for Io's volcanoes and for the episodes of resurfacing on the icy satellites.
Box 2: Tidal heating of satellites
When a major satellite is orbiting a giant planet, the tidal attraction of the planet distorts the shape of the satellite. This creates a tidal bulge centred on the side facing the planet and an equal bulge centred on the opposite face. The size of these bulges depends on the mass and proximity of the planet (tidal force is inversely proportional to the cube of the orbital radius), and on the strength of the material of which the satellite is made. In the extreme case of Io, the bulges are several kilometres high. Distortion of the globe associated with changes in location or size of the tidal bulges is what leads to tidal heating. The heat is generated by a kind of internal friction. This is the phenomenon that occurs if you take a bar of relatively weak metal and flex it backwards and forwards at a single point. The bent portion soon becomes hot to the touch. You can easily observe this for yourself if you are willing to sacrifice a wire coathanger to the cause of science.
If a satellite were to be rotating faster than its orbital period, the tidal bulges would have to migrate around the satellite in order to try to stay lined up with the planet. The continual distortion of the globe required for this to happen would generate an enormous amount of heat. Such a situation may have occurred very early in a satellite's life (or in the case of Triton, shortly after capture), but in most cases it would take tidal forces only a few million years to slow a satellite's rate of spin until it exactly matched its orbital period. This is why virtually all large satellites are now in synchronous rotation.
Tidal drag also tends to coax a satellite into an exactly circular orbit. This is the fate of any single satellite orbiting a sufficiently massive planet, and when it has been achieved the tidal stresses become constant and there is no more tidal heating. However, while a satellite's orbit is still elliptical then, even with synchronous rotation, there remain two reasons why the tidal stresses continue to vary, which allows tidal heating to continue.
In an elliptical orbit, the distance between planet and satellite is continually changing, and so the strength of the tidal force producing the tidal bulges varies accordingly. The bulges are slightly higher when the satellite is closer to the planet and lower when it is further away.
In an elliptical orbit, a satellite's speed varies with its distance from the planet (in accordance with Kepler's second law). However, the rate of the satellite's axial spin remains constant. Thus although for every orbit completed the satellite rotates exactly once, during the closest part of its orbit its rotation lags slightly behind its orbital motion, and during the furthest part of its orbit its rotation is slightly ahead of its orbital motion. Consequently, as seen from the planet, the satellite does not show exactly the same face throughout its orbit, rather it swings slightly from side to side. The tidal bulges are raised by forces acting directly on a line through the centres of the two bodies, and so their locations oscillate east and west across the satellite's surface.
So, for a satellite in an elliptical orbit, both the continual variation in the heights and the oscillation in the locations of the bulges deform the satellite's interior, and so cause heating. The reason why none of the orbits of the satellites of the giant planets has yet become exactly circular is that every satellite has neighbours. Mutual perturbations each time an inner satellite overtakes an outer (and therefore slower) satellite keep the orbits slightly elliptical, despite the tidal force from the planet.
This effect is magnified when satellites are in a situation of orbital resonance, i.e. where the orbital periods of satellites in adjacent orbits are simple ratios. This is particularly strong among the three inner Galilean satellites: Europa completes exactly one orbit for every two orbits by Io, and Ganymede in turn has exactly twice the orbital period of Europa. The resulting exaggerated eccentricity of the orbits, described as forced eccentricity, is slight (0.04 in the case of Io and 0.01 for Europa), but sufficient to power Io's volcanoes and the young (probably continuing) activity on Europa. It also explains why Ganymede shows plenty of signs of past geological activity, whereas Callisto shows few or no signs. (Although three times Callisto's orbital period is almost exactly seven times Ganymede's orbital period, this 7:3 orbital resonance does not lead to sufficient forced eccentricity of Callisto's orbit to lead to tidal heating, especially as Callisto is relatively far from Jupiter.)
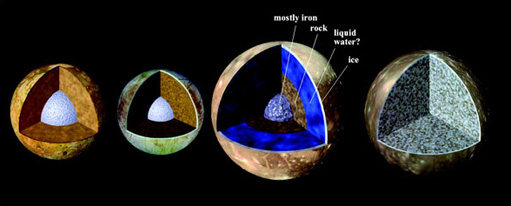
Of the icy satellites, Europa (see Figure 11a in Section 1.3) has the youngest icy surface certainly in the Jupiter system and probably in the entire outer Solar System. Density models, supported now by more specific observations, suggest that Europa has about 100 km of icy material overlying a rocky interior. The rate of tidal heating within Europa must be less than in Io, because Europa is further from Jupiter and has a less eccentric orbit. So, after the Voyager encounters, Europa became regarded as the ice-covered equivalent of a less-active version of Io. Certainly this could explain the fracturing and resurfacing evident on Europa's surface, and speculation abounded as to whether the rate of heat transfer from the rocky part into the base of the ice would be sufficient to maintain an unfrozen ocean sandwiched between the ice and the rock. Essentially, the issue depends on which of the two alternative models in Figure 13 is correct. Europa and its possible ocean are the main focus of the bulk of this course.

The famous science fiction author Arthur C. Clarke was one of the first to realise the astrobiological implications of a tidally heated Europa, by analogy with communities around 'black smoker' hydrothermal vents on the Earth's ocean floor. In 2010: Odyssey Two (published in 1982 as a sequel to the more famous 2001: A Space Odyssey) he imagined an explorer's findings on the floor of the Europan ocean:
…the first oasis filled him with delighted surprise. It extended for almost a kilometre around a tangled mass of pipes and chimneys deposited from mineral brines gushing from the interior. Out of that natural parody of a Gothic castle, black, scalding liquids pulsed in a slow rhythm, as if driven by the beating of some mighty heart. And, like blood, they were the authentic sign of life.
The boiling fluids drove back the deadly cold leaking down from above, and formed an island of warmth on the seabed. Equally important, they brought from Europa's interior all the chemicals of life. There, in an environment where none had expected it, were energy and food, in abundance…
In the tropical zone close to the contorted walls of the 'castle' were delicate, spidery structures that seemed to be the analogy of plants, though almost all were capable of movement. Crawling among these were bizarre slugs and worms, some feeding on the plants, others obtaining their food directly from the mineral-laden waters around them. At greater distances from the source of heat - the submarine fire around which all the creatures warmed themselves - were sturdier, more robust organisms, not unlike crabs or spiders.
Armies of biologists could have spent lifetimes studying that one small oasis.
(Clarke, 1982)
It took several years for speculations such as Clarke's to become acceptable among mainstream scientists. One reason for this is that ocean-floor hydrothermal vents had not yet been recognised as one of the most likely environments where life on Earth could have originated. Another reason is that the Voyager indications of an ocean below Europa's ice were not nearly so compelling as the evidence that has become available subsequently. However, by the late 1990s NASA was presenting Europa's astrobiological potential as the main reason why the US Senate ought to provide funding for a dedicated Europa mission, and both NASA and ESA are considering Europa missions that may launch by 2020.
Question 2
Using the orbital radii given in Table 1 (see Section 1.1), calculate the tidal force of Jupiter on Europa as a proportion of the tidal force of Jupiter on Io.
Answer
Box 2 states that tidal force is inversely proportional to the cube of the orbital radius. Thus (tidal force on Europa)/(tidal force on Io) = (Io orbital radius)3/(Europa orbital radius)3 = 421.63/670.93 = 0.249. Thus the tidal force on Europa is a quarter that on Io. (Note: the amount of tidal heating as a result of this force depends on other factors such as the amount of forced eccentricity and the body's internal properties.)
1.5 The Galileo mission
It was a long time before the Voyager missions were followed up by more detailed surveys of the outer planet satellites. No Uranus or Neptune missions are planned, but a mission to Saturn called Cassini-Huygens was launched in 1997 for arrival at Saturn in 2004. However, the Jupiter system received a similar visitor first. This was Galileo, launched in 1989, which became the first spacecraft to orbit Jupiter in December 1995. It continued to function through 2002, and was destroyed by plunging into Jupiter's atmosphere in September 2003. This was a planetary protection measure, taken to avoid the possibility of the defunct craft eventually colliding with Europa and thereby contaminating it with any unintentional bioload.
Galileo had several close encounters with each of the Galilean satellites, providing more complete and more detailed imaging than was possible during the Voyager fly-bys, using an instrument known as the solid-state imaging (SSI) camera. It also carried a near-infrared imaging spectrometer (NIMS), which was useful for determining surface compositions (and also temperatures of Io's active lava flows), an ultraviolet spectrometer, and magnetometers that revealed the satellites' responses as they move through Jupiter's magnetosphere. (Near-infrared means the part of the infrared spectrum that is nearest to the visible. The actual spectral range covered by NIMS was 0.7-5.2μm.) Perturbations to Galileo's trajectory as it passed close to the satellites placed improved constraints on their internal density distributions, indicating dense, presumably metallic, cores at the centres of Io, Europa and Ganymede. Callisto, by contrast, was proven to be only weakly differentiated, with incomplete segregation of rock and ice (Figure 14). See Box 3 for a discussion of how terms are borrowed from the terrestrial planets to describe the compositional and mechanical layers within icy satellites.
Box 3: Terminology for the layered structure of differentiated icy bodies
In a differentiated terrestrial planet, the term core is used for the dense compositionally distinct inner part, which is rich in iron. This is surrounded by a rocky (silicate) mantle. The extreme outer part of the rocky material is referred to as the crust if its composition has been altered by volcanism and other recycling processes.
In a differentiated icy body, it is logical, by analogy, to regard the rocky interior as the core (and if this is itself differentiated, with an iron-rich centre, to call that the inner core). The icy outer part of such a body is thus the mantle, and if the outer part of the ice differs somewhat in composition from the interior, we can call this the crust. The analogy is particularly apt because Solar System ices share many important properties with silicate rock. Among these are:
At the prevailing near-surface temperatures, the ice is mechanically strong and rigid, like rock near the Earth's surface.
When caused to melt (by heat, or in some cases a decrease in pressure) ice that is water mixed with salt or water mixed with another volatile species undergoes partial melting, just like a mixture of silicate minerals in rock. The melt and the surviving crystals have different compositions, and melting begins at a lower temperature than for pure water-ice.
At sufficient temperatures and pressure, ice will flow without melting, and can undergo solid-state convection, just like rock in the deeper part of the Earth's mantle.
Property 2 in this list makes it likely that the outermost part of a differentiated icy body does indeed differ at least slightly in composition from its mantle, and so we can regard this differentiated ice as a true crust. Property 3 means that we can discriminate the outer rigid ice (upper mantle plus crust) from the deeper more mobile (even though solid) ice, and distinguish these by the terms lithosphere and asthenosphere, respectively, which were originally coined for the Earth.
Relying largely on Galileo observations, we will now take a detailed look at Europa, to see what we can deduce about its recent history and the possibility of a life-bearing ocean below the ice.
2 Europa
2.1 Introduction
Europa's surface is fascinating, if often perplexing, to study. One of its special characteristics is its brightness. It has an albedo of 0.7, which is exceeded among icy satellites only by Enceladus and Triton. (The 'albedo' of a body is simply the fraction of the incident light that is reflected. The higher the albedo, the more light is reflected, and the brighter the body appears.) Overall brightness is one indicator of the youth of an icy surface: the brighter the icy surface, the younger it is. Ganymede (albedo 0.45) and Callisto (albedo 0.2) are much darker. This distinction is not usually apparent when comparing images of their surfaces (for example see Figures 10a and 11a in Section 1.3, Callisto and Europa respectively), because the brightness of each image has usually been adjusted to show features on each to best advantage.
The midday temperature is about 130 K (about −140 °C) at Europa's equator and about 80 K (about −190 °C) at the poles. Europa's axis of rotation is perpendicular to the plane of its orbit, which is tilted at less than half a degree relative to Jupiter's equatorial plane. Europa experiences virtually no 'seasonal' changes in illumination during its orbit about Jupiter or during Jupiter's twelve-year orbit of the Sun, because Jupiter's axial inclination is only about 3° (so Jupiter itself virtually lacks seasons too).
Galileo detected a magnetic field about Europa, which could be generated by motion within its iron core or within a salty (and therefore electrically conducting) ocean beneath the ice. The highest-resolution images of Europa sent back by Galileo have pixels representing areas about 6 m across. Such detailed images cover only a small fraction of the total surface. Nine per cent of Europa was imaged at better than 200 m per pixel and about half the globe was imaged at better than 1 km per pixel. This was a great advance on the coverage provided by Voyager, whose best images of Europa have pixels representing areas 1.9 km across. You will examine plenty of images of Europa shortly, but first it is worth establishing what we know about the composition of the ice.
2.2 Ice and salt
As noted in Section 1.5, Europa's near-infrared reflectance spectrum was used as long ago as the 1950s to demonstrate that its surface is mostly water-ice. More recently, spectroscopic observations by the Hubble Space Telescope and Galileo have revealed some regions where the ice appears to be salty (see below) and have also detected traces of molecular oxygen (O2) and smaller amounts of ozone (O3). The oxygen and ozone almost certainly result from the breakdown of water molecules in the ice brought about by exposure to charged particles (this process is known as radiolysis) that are channelled onto Europa by Jupiter's magnetic field, and by solar ultraviolet radiation (a process called photodissociation or photolysis. Most of the oxygen and ozone is probably held within the ice (as isolated molecules trapped within ice crystals), but some may constitute an extremely tenuous atmosphere.
Question 3
Apart from various forms of oxygen, what else would you expect to be produced when water molecules are broken down by radiation?
Answer
Given that the formula for water is H2O, hydrogen should also be produced.
Box 4 shows a series of reactions that could produce oxygen and hydrogen in Europa's ice.
Box 4: Radiolytic and photolytic breakdown of water molecules in ice
The reactions that occur to generate oxygen and hydrogen within the surface ice of an icy satellite can be summarised, in simplified form, as:

Europa's ozone is likely to be the product of a chain of reactions involving radiolytic and photolytic breakdown and recombination of oxygen molecules, similar to the photolytically driven reactions that generate ozone from oxygen in the Earth's stratosphere.
Hydrogen has not yet been detected on Europa, but on Ganymede, where similar 'space weathering' of exposed ice occurs, hydrogen has been found leaking away into space.
Question 4
Suggest a simple explanation to explain why there is a lot less free hydrogen than oxygen in or above Europa's surface.
Answer
Hydrogen is a much smaller and lighter atom therefore it is easier for hydrogen to escape from within the ice. Once liberated, it is so loosely bound by Europa's weak gravity that it would be lost to space much faster than oxygen or ozone.
Hydrogen peroxide (H2O2), which is an intermediate product of the sequence of reactions in Box 4, has been identified as a trace component of the ice in reflectance spectra obtained using Galileo's near-infrared imaging spectrometer. The same instrument has also revealed distortion of the absorption bands associated with water. This indicates that, in addition to forming ice crystals, some of the water molecules are bound within hydrated salt crystals. The best match to the spectra is from a mixture of magnesium and sodium salts such as magnesium sulfate hexahydrate (MgSO4.6H2O), epsomite (MgSO4.7H2O), bloedite (MgSO4.Na2SO4.4H2O) and natron (Na2CO3.10H2O). The occurrence of sulfates is supported by Galileo ultraviolet spectroscopic data that indicate the presence of compounds containing a sulfur-oxygen bond.
Question 5
Although carbonates and sulfates are fairly common salts on Earth, they are not the most abundant. What kind of salt appears to be missing on Europa, compared with the Earth?
Answer
No chlorides are in the above list - note that sodium chloride (NaCl), which is the most abundant salt dissolved in the Earth's oceans, is absent.
Actually, chlorides produce no spectral features in the available part of the spectrum, so direct observational data cannot tell us whether any chlorine salts occur on Europa's surface. What the spectral mapping by Galileo did achieve, however, was to show that the distribution of salts across Europa's surface is highly non-uniform. Large expanses are relatively salt-free, but in places where the surface has been most recently and most greatly disrupted from below, the surface salt concentration reaches 99 per cent. You will see what these areas look like shortly.
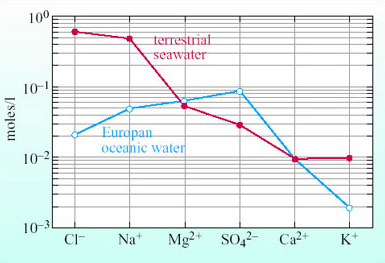
The salts occurring on Europa's surface are unlikely to be a straightforward representation of those dissolved in any ocean beneath Europa's ice - calculations have shown that the freezing process would tend to concentrate sulfates of magnesium and sodium into the ice. This is consistent with the observed preponderance of these salts at the surface. However, the concentrations of elements dissolved in Europa's ocean are largely a matter of speculation. Two of the factors that have to be considered are the composition of Europa's rocky component, and the efficiency with which each element becomes dissolved from it into the ocean. Neither of these factors is known. Although, on average, Europa's rock is likely to be similar to carbonaceous chondrites, geochemical differentiation could mean that the rock nearest to the ice-rock interface might well be very different (as is probably the case in Io's crust, for example). The efficiency with which elements become dissolved (or sometimes reprecipitated) depends upon the temperature at which it occurs, as well as on the overall chemistry of the solution. Despite the uncertainties, attempts have been made to model the likely concentrations of dissolved elements in Europa's ocean. The results of one such model are shown in Figure 15.
Question 6
According to Figure 15, how many more times greater is the concentration of chloride (Cl−) in terrestrial seawater than in Europa's ocean?
Answer
This is an exercise in reading values of a logarithmic scale. The concentration of Cl− in terrestrial seawater is shown as 0.6 moles per litre. The concentration of Cl− in Europa's ocean is shown as 0.02 moles per litre. The ratio between the two is 0.6/0.02 = 30. Thus the concentration of Cl− in terrestrial seawater is thirty times that in Europa's ocean.
2.3 Examining Europa's surface
It is all very well speculating about conditions in an ocean below Europa's ice, but what evidence is there that it actually exists? After all, tidal heating might not result in ice melting on a global scale, and current geophysical models of Europa's internal structure (e.g. Figure 14 in Section 1.5) cannot tell the difference between ice and liquid water. Fortunately, Voyager and Galileo have given us detailed images of Europa that we can use in the same way that a geologist uses aerial photographs or images from space to help decipher the processes that have shaped a particular tract of the Earth's surface.
2.3.1 The general view
Figure 16 shows a Voyager 2 image of a large region of Europa. Examine this image carefully, in order to answer Question 4.
Click here for a larger version of Figure 16.
Box 5: Latitudes and longitudes on satellites
As soon as the first features were discovered on the surfaces of the satellites of the outer planets, it became necessary to define co-ordinate systems to map their locations. Latitude is simple to define; it is measured in degrees north and south of the equator, which lies halfway between the satellite's poles of rotation. By convention (established by the International Astronomical Union), for a synchronously rotating satellite 0° longitude is defined to run through the centre of the planet-facing hemisphere. Longitude is normally quoted in degrees measured westwards from here, and west is always to the left when you look at a body with north towards the top.
Question 7
(a) Study Figure 16 and write a short description of the kinds of features you can see on Europa's surface, noting for example relative brightness and characteristic shapes or textures. Concentrate on a simple description of appearance; we do not expect you to explain the origin or precise nature of what you can see.
(b) Try to deduce the relative ages of the features you have described.
Answer
Answering this question was part of your learning process. Do not worry if you found yourself at a loss. However, we hope that after reading the answer you will be able to tackle a similar task better in the future.
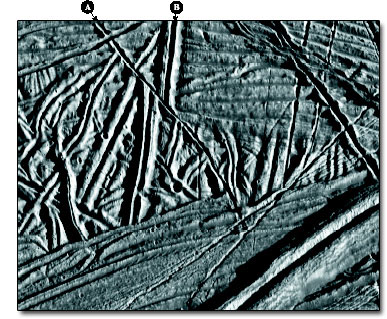
(a) Most of the surface area appears fairly featureless and mid-grey. This is cut by a large number of linear features (bands), up to several tens of kilometres in width. Most of the bands are dark. Some consist of joined segments of straight lines and some are curved. There is one prominent curved bright band near the lower left. The surface pattern is different in the upper right (northeast), where the pattern of bands disappears and the surface takes on a mottled appearance. Topography becomes apparent only near the right hand (eastern) edge of the view, where the Sun was low in the sky. It is difficult to trace the dark bands into this region, but instead a series of curved ridges shows up.
(b) The dark bands must be younger than the pale (mid-grey) surfaces that they cut. The mottled terrain in the upper right is probably younger than most of the bands, because these disappear when they reach the mottled terrain. Some of the curved ridges in the lower right-hand corner appear to run over the bands, and so these curved ridges must also be younger.
In answering Question 4, you should have formed an impression of an original surface that (at the scale of the image) appears relatively featureless, but was subsequently cut across by processes that produced dark bands. Later, the band-disrupted terrain was itself overprinted in places to produce mottled terrain and curved ridges. The dark bands cutting across much of Europa give it the appearance of a thoroughly cracked eggshell, but please be aware that there is no evidence in Figure 16 (nor on any more detailed images) that these 'cracks' are open fissures in the surface. In fact, there is very little topographic relief on Europa. The curved ridges in the lower right corner of Figure 16 are only about 200 m high.
2.3.2 The crater Pwyll
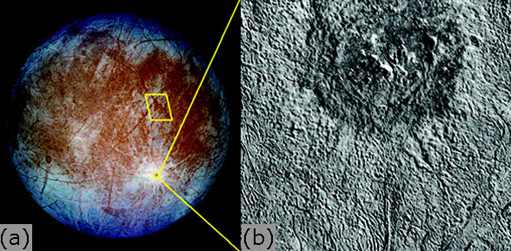
You might also have noted that there are no obvious impact craters visible in Figure 16 (see Section 2.3.1). In fact there are a few. One is a bright spot, 15 km in diameter, surrounded by a dark halo of ejecta that occurs 10 mm from the top edge and 65 mm from the left-hand edge of the figure. Another is a slightly larger pale feature with a discernible central peak 20 mm from the top edge and 45 mm from the right-hand edge. The youngest large crater on Europa occurs at 26° S, 271° W, which is outside the area covered by Figure 16. This is shown in Figure 17, and is named Pwyll (pronounced 'Puh-hl' or 'Poo-eel', after a character from Welsh legend, Box 6). Pwyll is 26 km across, and has a dark floor and a halo of equally dark ejecta extending for about 8 km beyond its rim, which was presumably excavated from below the surface. Much brighter, finely fragmented ejecta in the form of discontinuous rays can be traced for more than 1000 km, and forms the bright region surrounding the crater in the global view in Figure 17a. It is the high visibility of its ejecta rays that shows Pwyll to be the youngest of Europa's large craters. Statistical arguments based on the likely frequency of comet impacts onto Europa suggest that Pwyll is very unlikely to be older than about 20 million years, and is probably about 3 million years old.
Box 6: Names on Europa and other satellites
In order to avoid duplication of the names of features between bodies, and to try to achieve consistency of nomenclature on each body, the International Astronomical Union has established a naming convention for each planetary body in the Solar System. Names on Europa are drawn from Celtic gods, heroes, and myths; people and places associated with the Europa myth; and place names from ancient Egypt.
The crater on Europa called Pwyll is a character from Welsh legend, who appears in the mediaeval collection of tales known as The Mabinogion.
By contrast, features on Io are named after gods and heroes associated with fire, sun, thunder and volcanoes, and also people and places associated with the Io myth and Dante's Inferno.
Incidentally, the Galilean satellites themselves and many of Jupiter's smaller satellites are named after mythological characters (of various genders and species) who, to put it delicately, became 'romantically entangled' with the god Jupiter.
Question 8
Look at the detailed image of Pwyll in Figure 17b. Does Pwyll have the three-dimensional shape that you would expect of a young crater?
Answer
Pwyll is circular in outline, which is to be expected, but its topography appears to be extremely subdued, even on this image that was recorded when the Sun was very low in the sky (to judge from the shadows in the surrounding area). The rim is very poorly expressed, and there is a cluster of central peaks rather than a single central peak such as you might expect in a crater of this size.
Expert analysis shows that most of Pwyll's rim is less than 200 m high, and that (unusually for impact craters) its floor is hardly any lower than the terrain outside. Opinion is divided as to whether the impactor responsible for Pwyll actually penetrated right through the ice, but all are agreed that the crater shows the hallmarks of an impact into relatively thin (about 20 km in thickness) and weak ice.
Thus the paucity of large craters on Europa indicates that its surface is young, and the subdued cross-sectional shape of many of those craters that do occur suggests that the ice was relatively thin when they formed.
2.3.3 Fracturing and motion of the ice shell
If the rigid surface layer of Europa's ice is thin (or, at least, has been thin for some of the time), and overlies either water or some kind of weak and mushy ice as indicated by large craters such as Pwyll, then we might expect to find some evidence for fracturing and motion of the rigid ice shell. This is precisely what the pattern of dark bands such as those on Figure 16 (see Section 2.3.1) appears to be showing us. An area from Figure 16 is enlarged in Figure 18, with an interpretation of how plates bounded by fractures in the rigid ice shell could have moved relative to one another.
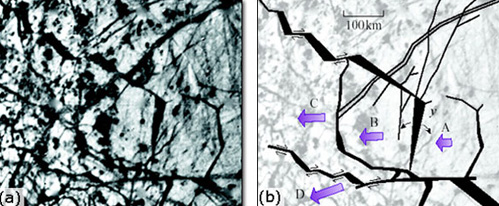
The arrows on Figure 18b suggest that the plates labelled A-D have all moved westwards relative to the ice at the right-hand (eastern) edge of the map. In addition, plate B has rotated about 5° anticlockwise relative to plate A (opening up the intervening wedge-shaped band that extends south from y); plate C has moved west relative to plate B and plate D has moved west relative to plate C.
It is tempting to make an analogy with plate tectonics on Earth, and to regard the stepped dark bands forming the north and south boundaries of plate C as lengths of spreading axis (or mid-ocean ridge) offset by transform faults. However, even if the interpretation in Figure 18b is correct, there are several important differences between plate tectonics on Europa and the Earth. First, Europa's jumble of overlapping dark bands (Figure 16) suggests that old spreading axes are abandoned and replaced by new ones after only a few tens of kilometres of spreading. However, on Earth most spreading axes last for tens to hundreds of millions of years, during which time they add hundreds or even thousands of kilometres of new lithosphere to the edges of the adjacent plates. On Earth, creation of new lithosphere at spreading axes is balanced globally by destruction of lithosphere at subduction zones. (On Earth, a subduction zone is where one lithospheric plate descends at an angle below another.)
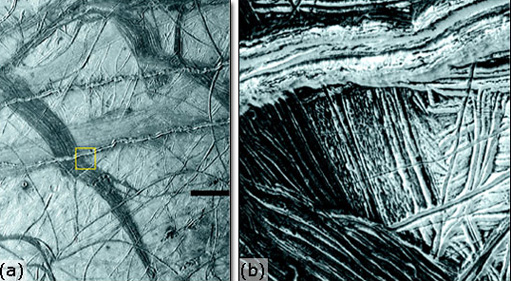
There is no analogue to terrestrial subduction zones on Europa, but it is obvious that if new areas of surface ice are being added to make the dark bands then other areas must be being destroyed at an equal rate. The processes operating on Europa to achieve such a balance remained a mystery until Galileo's more detailed images became available. You will examine this evidence soon, but first it is worth exploring the extra information that Galileo images can give about the dark bands themselves. Figure 19a is one such image. It shows that the pale areas between the dark bands that seemed relatively featureless at the resolution of the Voyager images can be seen at higher resolution to be criss-crossed by low ridges. At this level of detail, Europa's surface has been aptly described as looking like a ball of string. Furthermore, the 'ball of string' ridges also occur within the dark bands (running parallel with their edges). When we move up to even higher resolution, as in Figure 19b, the 'ball of string' ridges are even more obvious (and some can be seen to have central grooves running along them), whereas the distinction between dark bands and pale terrain has become hard to see.
Click here for a bigger version of Figure 19b
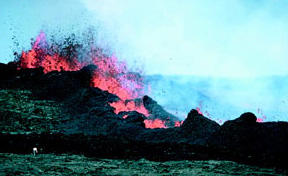
It is uncertain exactly how the ridges on Europa have been built. Each is probably the result of some form of cryovolcanic eruption along a crack or fissure. If this is the case, the material erupted must have been in the form of mushy ice, or perhaps a fountain-like spray of fragmented ice, analogous to a volcanic fissure eruption on Earth (Figure 20) and involving the escape of gaseous volatiles during eruption. Fortunately, the details of ridge-building are not important in order to understand the general surface history and its implications for ice thickness, which appear to be as follows:
Each 'ball of string' ridge is symptomatic of a small amount of surface extension.
The ridges occur in sets of up to about a dozen parallel ridges, and each set can usually be seen to be cut across by a younger set. There are at least four such sets within the portion of the dark band shown in Figure 19b. Although not quite parallel to each other, each set runs lengthways relative to the dark band, and would in total be responsible for the kind of spreading across a dark band indicated in Figure 18b.
In the older pale terrain outside the dark band the ridge sets are oriented more variably, showing a long and complex history of surface creation.
The dark bands are the youngest parts of the 'ball of string' surface, and evidently become paler as they age. (There are many ways in which this could happen. Some involve growth or fragmentation of ice crystals over time, others depend on chemical changes caused by long-term exposure to radiation.)
There are two things to add to finish the story of surface creation in the area covered by Figure 19. First, the bright bands cut across the 'ball of string' texture and so are clearly younger than it. These bands may be a slightly different kind of cryovolcanic feature - their feathery edges, seen at the highest resolution (Figure 19b), could represent debris shed downslope from a central high. Second, there are some very narrow grooves (barely visible in Figure 19b) that also cut both dark and pale 'ball of string' texture, one of which widens towards the east where it becomes an otherwise unremarkable contributor to the texture. Many features such as these are probably cracks where extension occurred without an accompanying eruption. Others are evidently the surface expressions of faults with sideways (instead of extensional) movement (as you will see shortly).
The dark bands and the intervening tracts of pale terrain were constructed by a long and complicated series of events, each of which was associated with spreading on a local scale.
2.3.4 More surface disruption
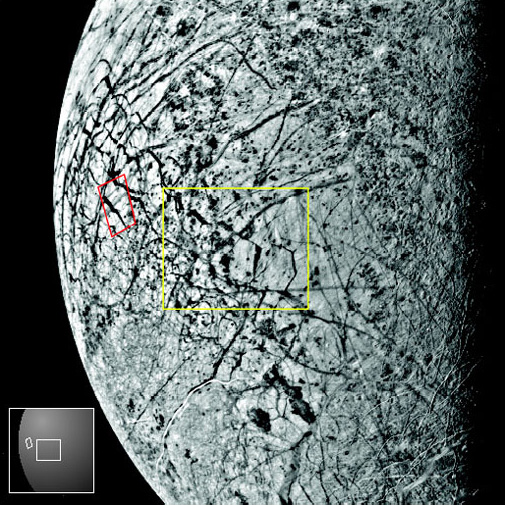
Now let's examine some detailed images of the region of Europa's northern hemisphere that was indicated on Figure 17 (see Section 2.3.2). A medium resolution image is shown in Figure 21, and higher resolution images from within this area are shown in Figures 22-24 (see below).
Click here for a bigger version of Figure 21.
Click here for a bigger version of Figure 22.
Question 9
Study Figure 21. How would you classify the majority of the surface in this region, including the part of it shown in more detail in Figure 22?
Answer
Although Figure 22 includes more variation in size of ridges and grooves than in the comparable sized area shown in Figure 19b (see Section 2.3.3), this and most of the area of Figure 21 has the basic 'ball of string' texture.
Question 10
Look at the two features labelled A and B in Figure 22. A is a groove with a slightly raised rim on either side, running diagonally down to the right from the top of the image. B is a ridge, with a groove down its centre, running almost directly down from the top. Try to account for the relationship between these two features where they cross, and deduce which of these two features is the younger.
Answer
Feature A cuts across feature B, and so feature A must be the younger of the two. Moreover, the parts of feature B on either side of feature A are no longer aligned. They have been displaced to the right by nearly 1 km. The simplest explanation of this is that feature A is a fault with about 1 km of sideways movement across it (a geologist would describe it as a dextral (or right-lateral) strike-slip fault). You can get the same impression of displacement to the right where feature A offsets the edge of the relatively smooth surface in the lower third of the image. (Note that although A is younger than B, A is certainly not the youngest ridge or groove in this area: for example, an even younger groove cuts through A at right angles near the top of the image.)
These images provide clear evidence that tectonics on Europa involve relative sideways movements as well as simple spreading apart of the surface.
If you are familiar with plate tectonics on Earth you will probably not be surprised by this. Now turn your attention to the other parts of Figure 21, notably those covered by Figures 23 and 24.
Click here for a larger version of Figure 23.
Click here for a larger version of Figure 24.
Question 11
What has happened to the 'ball of string' texture in (a) Figure 23, and (b) Figure 24?
Answer
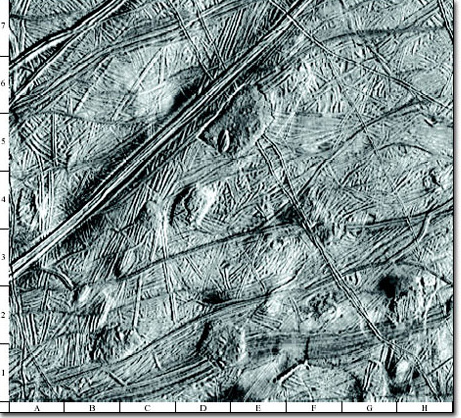
(a) It is obvious that the 'ball of string' texture once covered the whole of the area shown in Figure 23. However, there are many patches about 10 km across where this texture can be seen in various degrees of disruption. For example:
(i) in square D4 the 'ball of string' surface has been warped upwards into a gentle dome, with a zig-zag fracture where its roof has been stretched apart;
(ii) in squares D/E-5/6 the 'ball of string' surface has been destroyed in a roughly rectangular area, except for a 4 km × 2 km fragment that survives near the southwest edge of the disrupted area. The surface of this whole disrupted area is domed upwards, but its edge must be lower than the surrounding terrain because it is surrounded by an inward-facing cliff;
(iii) in squares D/E-l/2 there is a dome that looks like a mushy extrusion across the original surface within which no identifiable traces of 'ball of string' texture remain.
Sites (i)-(iii) can be regarded as progressively more disrupted examples of 'ball of string texture'. A dome intermediate in character between those at sites (ii) and (iii) occurs at B1-B2. You may also be able to make out several more subtle domes within which the surface has not been fractured at all (in Figure 23 and nearby parts of Figure 21).
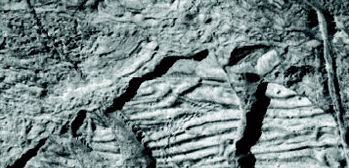
(b) Throughout Figure 24, the 'ball of string' surface has been fractured into slabs, which are bounded by cliffs and so stand higher than the intervening surface, which is occupied by hummocks a few hundred metres across. The slabs still retain their 'ball of string' texture, and by matching prominent ridges and grooves on adjacent slabs it is possible to see that the slabs in the northwest (top left) of the image have been jostled apart by distances of about 1 km. However, the further southeast you look in this image, the harder it is to identify matching slabs and the greater the proportion of new, low-lying, hummocky surface.
The usual explanation for the dome features in regions such as Figure 23 is that they are places where warm buoyant material (which could be warm ice, slush or water) has risen from below. Where injected as an intrusion at shallow depth, the result is a subtle dome (e.g. the example in D4) over which the surface may have been sufficiently stretched to rupture. In more extreme cases the 'ball of string' surface appears to have melted, exposing the risen material, which is surrounded by cliffs that drop down to the new surface (e.g. the example in D/E-5/6). Elsewhere the risen material seems to have spread out across the top of the old 'ball of string' surface (e.g. the example in D/E-1/2). Regions such as the one covering Figure 24 are essentially just more extensive versions of the D/E-5/6 situation, and demonstrate the effects of heating events on a regional scale. There are several examples of this type of terrain on Europa, which is described formally as chaos. Conventionally, within a chaos region, the slabs of 'ball of string' surface are referred to as 'rafts' and the low-lying hummocky material in between is called 'matrix'.
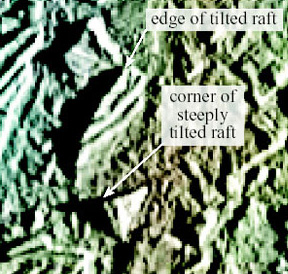
The matrix is most simply interpreted as the (now refrozen) surface of an ocean that was exposed when the overlying ice was removed, presumably by melting caused by an injection of heat from below. Near the edges of chaos, rafts have broken away from the continuous ice sheet and drifted inwards by relatively small distances, and in many cases their original configurations can be deduced. Near the centres of chaos, rafts are less abundant and it is not usually possible to see how they once fitted together. The rafts are analogous to ice floes formed in the Earth's oceans when floating pack-ice breaks up in the spring. The even height of the cliff at the edge of most rafts shows that these rafts are lying horizontally. However, there is one raft, 5 km × 2 km in size, just to the northeast of the centre of Figure 24 with (to judge by the cliff's shadow) an exceptionally high cliff on its northwest side but no sign of a cliff on its southeast side. This raft is shown enlarged in Figure 25. It looks as though the raft has been tilted down towards the southeast. Some of the knobbly hills sticking up out of the matrix may be the corners of smaller or more steeply tilted rafts, the most obvious being a triangular hill with an exceptionally long shadow immediately to the south of the tilted raft in Figure 25.
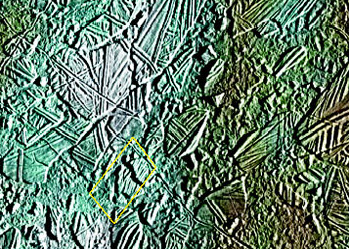
Chaos makes up about a third of the nine per cent of Europa's surface that has been imaged at adequate resolution (less than about 200 m per pixel) to make identification certain. On low-resolution images, both chaos and dome-disrupted regions such as Figure 23 appear as mottled terrain like the area in the northeast of Figure 16 (see Section 2.3.1). The region covered by Figure 24 is named Conamara Chaos, and as you can see on Figure 21 it extends for about 100 km north to south and about 80 km east to west. (Conamara Chaos is named after a region in the west of Galway, Ireland - usually spelt Connemara in English. The name derives from Conmaicne mara, meaning the seaside land of the descendants of Conmac. In Irish legend, Conmac was a son of Fergus Mòr, king of Ulster, and Maedhbh, queen of Connacht.) The largest chaos region on Europa is more than a thousand kilometres across, and the small end of the size spectrum is exemplified by the resurfaced area at D/E-5/6 in Figure 23.
Question 12
If large chaos regions are places where 'ball of string' surface has been destroyed, what could be their significance for the global tectonics of Europa?
Answer
Destruction of surface in chaos regions could balance the spreading implied by the creation of the 'ball-of-string' texture. We noted earlier that such spreading could not occur unless it was matched globally by the surface being destroyed at an equal rate. On Earth, this is achieved where plates are subducted deep into the mantle.
It is hard to imagine how we could prove that formation of chaos in one part of Europa is accompanied simultaneously by addition of new ridges and grooves to 'ball of string' textured regions elsewhere, unless we actually could see it happening. However, recognition of chaos does at least show how a balance could be achieved between the creation and destruction of surface.
So how old is Conamara Chaos?
Question 13
Look carefully at Figure 24. Is the white ejecta from Pwyll visible on top of the matrix as well as on top of the rafts and, if so, what does this tell us about the relative ages of the chaos and Pwyll?
Answer
Both rafts and matrix in the western part of Figure 24 are white, in contrast to redder surfaces in the east. This is because raft and matrix surfaces alike have been overlain by a sprinkling of ray ejecta from Pwyll. This is also apparent on Figure 21. The fact that the matrix has ejecta on top of it means that the chaos existed before Pwyll was formed. As noted earlier in Section 2.3.2, Pwyll is probably about 3 million years old, so this is the likely lower age limit for Conamara Chaos.
In addition to the white ray ejecta, there are quite a few craters less than 1 km in diameter in this region. These are more common within the rays, and so are almost certainly secondary craters produced by impact of the largest blocks of ejecta expelled from Pwyll. On Figure 24, these craters appear more common on the rafts than in the matrix. This difference could be apparent rather than real, because the jumbled surface texture of the matrix would make the craters difficult to see. However, even on the highest resolution images such as Figure 26 craters appear scarcer on the matrix. Some of the small craters on the rafts must pre-date the break-up into chaos, but if most of the small craters we see are Pwyll secondaries then some of those that formed on the matrix since its creation would seem to have been erased. One way this could have happened is if the matrix remained mobile and continued to deform for some millions of years after its surface froze, whereas the surfaces of the rafts were rigid for the whole time.
So, the evidence so far points to Conamara Chaos having formed (probably at least 3 million years ago) by melting of a patch of ice some tens of kilometres across, accompanied by break-up of the adjacent floating ice into rafts, some of which drifted inwards across the temporarily unroofed ocean. A skin of ice or slush would have rapidly covered any exposed water but, depending on the amount of heating from below, this skin could have remained sufficiently pliant to allow the rafts to plough through it for up to several million years. Before the matrix became fully rigid, ejecta from the Pwyll impact was distributed across the area, with the accompanying formation of secondary impact craters. Continuing deformation or local resurfacing of the matrix was sufficient to erase a significant proportion of the Pwyll secondary craters on the matrix.
But that is not quite the end of the story.
Question 14
Examine Figure 24 again, and locate a groove that runs diagonally across the image from just below the northwest (top left) corner. Look closely at the units this groove cuts. Deduce the implications for the age of this groove and the nature of the material that it cuts.
Answer
The groove cuts through rafts and matrix alike. Its appearance on the rafts is unremarkable, and it would be taken for just another element of each raft's 'ball of string' texture if we did not see it also cutting the matrix. Generally speaking, the groove's course is not deflected where it crosses from one surface type to another. This groove must have formed at a time when the matrix had become virtually as rigid as the rafts. It is seen cutting the matrix near the right-hand edge of Figure 26. There are at least two other grooves cutting the matrix in Figure 24. One runs parallel to the first groove, about 5 km to its southwest. The other is at right angles to the first groove, which cuts it about 5 km from the northwest corner of the image.
You have now seen the last major piece of the puzzle. After its matrix has become sufficiently rigid, chaos on Europa begins to experience brittle fracturing, and new grooves form that look similar to some of those on ordinary 'ball of string' terrain. Perhaps, given sufficient time, rafts and matrix alike in a chaos region will become thoroughly overprinted by additional generations of ridges and grooves, and the rafts so split up by successive spreading increments across each crack that they lose their integrity. The entire area will take on the appearance of a ball of string - in fact, it will actually be 'ball of string' terrain. For all we know, areas such as those in Figures 19 (see Section 2.3.3) and 22 could be former chaos of which no recognisable traces remain.
Chaos areas, and in particular the drifted rafts, are compelling evidence that, at least at the time of chaos formation, the 'ball of string' textured surface ice was floating on a liquid. This would not have to be an ocean of global extent, because the underlying liquid would not need to cover an area much wider than the overlying chaos.
In Section 2.5, we will argue that whether the ocean is global, local, permanent or ephemeral is of no great importance for the existence of life. However, first let's see if we can work out how thick the ice is.
2.4 How thick is Europa's ice?
You learned in Section 1.4 that geophysical data show the 'icy' outer part of Europa to be about 100 km thick, but that the information is inadequate to distinguish between the extreme possibilities of solid ice all the way down to the bedrock and a floating sheet of ice supported above a liquid ocean (Figure 13). The subdued topography of craters such as Pwyll and our interpretation of chaos regions both strongly suggest that the latter is more likely. We can determine how thick the ice was at the time of chaos formation, provided we are willing to take the present surface of the matrix to be at roughly the same height (relative to raft surfaces) as the surface of the ocean when it was exposed. The lack of any obvious disturbance of the matrix adjacent to the blocks even in the very high-resolution image in Figure 26 (see Section 2.3.4) indicates that this is a reasonable assumption. If this is correct, then the height of a raft surface above the matrix carries important information.
Question 15
Look at the rafts in Figure 24 (see Section 2.3.4). Do you get the impression that each raft has its surface at a different height above the matrix?
Answer
With the exception of the tilted rafts, they all appear to be at about the same height.
This is just a crude visual impression. However, there are various ways to determine relative heights on spacecraft images. The best way is to use the stereoscopic information contained in two images of the same area taken from different perspectives. Unfortunately, Galileo did not obtain high-resolution stereoscopic images of Europa. Instead, we can measure the widths of the shadows cast by the rafts onto the matrix, and combine this information with knowledge of the angle of the Sun above the local horizon to estimate the height of the cliff. This shows that most of the cliffs at the edges of rafts in Figure 24 are about 100 m high.
Question 16
Why would the surface of a raft (or the top of any object floating in a fluid) be higher than the surface of the matrix (or the fluid in which the object is floating)?
Answer
The only simple explanation is that the rafts are less dense than the fluid in which they were floating.
This is certainly true of ice floating in the Earth's oceans, and gave rise to the metaphor 'only the tip of the iceberg', which refers to the small fraction of something that is apparent when most of it is hidden. On Europa, the height difference can tell us the total thickness of the rafts, if we know the densities of the raft and the ocean. The principle behind this is known to geologists and geophysicists as 'isostasy' (see Box 7). (Isostasy is really just another name for buoyancy.)
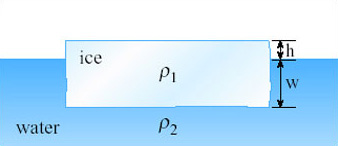
Box 7: The thickness of a floating raft
Figure 27 shows a tabular raft floating at equilibrium (i.e. at its position of neutral buoyancy) in a liquid. In this situation, the pressure at the base of the raft must be the same as the pressure in the liquid immediately adjacent to the base of the raft. The formula for pressure, P, at depth d beneath a substance of density ρ is given by:

where g is the acceleration due to gravity. In the situation illustrated in Figure 27, identical pressures occur at the base of the raft, which occurs below a total raft thickness of (h + w) and at a depth w in the liquid. The difference in any atmospheric pressure between the raft surface and the liquid surface is negligible, so we can ignore this and write:
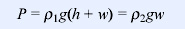
As we are interested in determining the raft thickness, (h + w), we can divide by g, to get:

We do not actually know the density of the raft (impure ice) or of the liquid (likely to be a salt solution, rather than pure water). However, we can assume a reasonable range of values, given that we can be fairly sure that the raft is mostly H2O ice and that the liquid is some kind of salty water. The density of water rich in dissolved sulfates of magnesium and sodium (for example of a composition close to that in Figure 15 in Section 2.2) would be about 1180 kg m−3. Ice freezing from such a solution could have a density as high as 1126 kg m−3 if rich in these salts or as low as 927 kg m−3 if salt-free.
Question 17
(a) Rearrange Equation 3 to find an expression for w.
(b) Use this rearranged equation to determine the maximum and minimum depths to the base of the rafts, and hence the raft thicknesses in Conamara Chaos, given that h is 100 m, ρ1 is not less than 927 kg m−3 and not more than 1126 kg m−3, and ρ2 is 1180 kg m−3.
Answer
(a) Because it is w that we are trying to find, we need to get all the terms involving w into the same side of the equation.
Equation 3 can be expanded as:
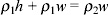
Subtracting ρ1w from both sides of this equation, we get:

And to find w we need to divide both sides by (ρ2 - ρ1):

(b) It might not be immediately obvious whether the maximum raft density will give the maximum or the minimum raft thickness, but it has to be one or the other. Inserting the value of 1126 kg m−3 as ρ1 in this equation and using 100 m as h and ρ2 as 1180kg m−3, we get:

The raft thickness is (h+w), and so we need to add 100 m to this value, giving a raft thickness of 2185 m.
Inserting 927 kg m−3 as ρ1 in the same expression we get:
and hence a raft thickness of 466 m.
The cliff height is certainly not known to three significant figures, so we should not quote these results to more than two significant figures. Thus, according to this method, the raft thickness is not less than about 470 m and not more than about 2200 m.
In fact, the less the density contrast between raft and fluid, the lower the height of the cliffs. If a raft has the same density as the fluid it barely floats at all. If a raft is very much less dense than the fluid, only a relatively small proportion of the raft's volume needs to be immersed in the fluid in order to displace an equivalent mass of fluid.
If you were to assume pure ice floating in pure water, this method would give a raft thickness intermediate between the extremes you calculated in Question 10. Thus, the heights of the cliffs at the edges of rafts show with a fair degree of confidence that when the ice broke up to create the rafts its thickness was not less than a few hundred metres and not more than a few kilometres.
This is not necessarily the long-term ice thickness on Europa. Clearly, it is possible that the local heating event responsible for chaos generation might have melted quite a lot from the base of the continuous ice sheet before this finally broke up. On the other hand, the method we have used to calculate the thickness of the rafts relies on the ice of the re-frozen matrix being both thinner and weaker than the raft ice, at least until cooling-related thickening and ridge and groove development has turned the matrix into 'ball of string' terrain. So we can imagine regions of ice on Europa both thinner and thicker than the values you calculated in Question 10.
2.5 Heat and life
The weight of evidence in the case of Europa points strongly towards ice overlying salty water, at least within the past few millions years although not necessarily today. There are signs that localised heating episodes have melted and fractured the ice. The intensity of tidal heating has probably waxed and waned in step with fluctuations in the amount of forced eccentricity of Europa's orbit, but we can anticipate that conditions on Europa would have varied through a broadly similar range during much of the Solar System's lifetime. What, then, are the prospects for life on Europa?
Let's consider the surface ice first. On Earth, active microbial communities have been found within Antarctic sea ice at temperatures as low as −18 °C. Here, algae and other organisms survive by photosynthesis in summer that is possibly supplemented when there is less light available by metabolising dissolved organic matter, but these are probably survivor species that need liquid water for part of their life cycles.
Question 18
Can you suggest four reasons why Europan surface ice is unlikely to be so hospitable for life as Antarctic sea ice?
Answer
Firstly, Europa's surface temperature of −140 °C even at the equator is far lower than in Antarctic sea ice, and we know of no way for water-based metabolism to proceed in such cold conditions. Secondly, liquid water would occur here far less frequently than within the Antarctic ice shelf. Thirdly, Jupiter is 5.2 AU from the Sun, so (according to the inverse-square law) the sunlight available for photosynthesis on Europa is some 27 times weaker than on Earth. Fourthly, unless there is a thriving ecosystem elsewhere on Europa, there would be no dissolved organic matter food source to supplement the energy available from photosynthesis.
Thanks to the escape of tidal heat, the temperature within Europa's ice is likely to increase with depth. However, even on Earth the light intensity is too low for photosynthesis to continue more than about 20 m deep within the ice. This is only a tiny fraction of Europa's ice thickness. There could be no ice warmer than −20 °C at a shallow enough depth for photosynthesis, except within very young matrix ice of chaos regions, or in the walls of fissures for brief periods during fracturing or ridge building eruptions. It is faintly conceivable that primitive photosynthetic organisms may lie entombed and dormant within Europa's near-surface ice for periods of millions of years, and become active only during relatively brief episodes of local heating (full-blown chaos generation, or above warm dome-forming intrusions as in Figure 23 in Section 2.3.4, or within an active fissure). This would be a pretty marginal existence. It is perhaps to the energy and nutrients that could be provided by hydrothermal vents that we must appeal if we wish to find the basis of a robust and persistent ecology of the kind imagined by Arthur C. Clarke (see Section 1.4).
Whether hydrothermal vents exist on Europa, and, if so, their abundance and their power, depend upon how deep within Europa the tidal heating occurs. This has not been determined, because it depends on unknown factors such as the strength and other properties of Europa's ice and rocky interior. At one extreme, virtually all the tidal energy could be dissipated within the icy shell (in which case chaos formation would be a result of direct heating of the ice). This would mean that the ocean was kept warm largely because of heat from above. Any hydrothermal vents on the ocean floor would be scarce and weak, and powered only by the feeble leakage of radiogenic heat from Europa's rocky interior. On the other hand, if tidal heating were concentrated in Europa's rocky part, flow of heat from the rock into the overlying ocean would be much stronger. As on Earth, ocean water would soak into the underlying hot rock, where it would become heated and react chemically, eventually escaping back into the ocean via hydrothermal vents. A static rocky substrate would not be very favourable for sustaining life because the ocean would deplete the available chemicals over million-year timescales. However, if tidal heating were sufficient to cause partial melting within Europa's rock, hydrothermal circulation would be especially strong over sites where igneous rock was being intruded at shallow depth, and strongest of all at any places where volcanic eruptions occurred onto the ocean floor. Moreover, the repeated arrival of new igneous rock at or a little way below the ocean floor would mean that the chemistry was continually renewed, so that some of the circulating water would always find something with which to react.
Question 19
Can you suggest why the presence of hydrothermal vents on Europa could be particularly important for the origin of life on Europa?
Answer
Phylogenetic evidence, in particular the ribosomal RNA tree, suggests that thermophylic autotrophic microbes dependent on chemosynthesis are the last common ancestor for life on Earth. Therefore life on Earth may well have begun at hot vents. If it did, then it could perhaps have begun with equal ease at hot vents on Europa.
An ocean of global extent would not have been necessary for life to begin. Relatively small pools of water sandwiched between ice and hot rock would have been enough. However an ocean, or at least an extensive body of water, would certainly make it easier for life to survive. Life that was trapped in a single pocket of water would have no escape when the hydrothermal vent that had been feeding it cooled down and ceased to flow. It would have to survive in a frozen state until the unlikely eventuality of a new vent starting up nearby. However, an ocean, or at least an extensive seaway, would mean that organisms (including free-floating larval stages of any multicellular life) could drift from vent to vent, allowing species to survive - even though individual colonies would meet their demise with the extinction of their vent.
The primary producers at hot-vent ecosystems on Earth derive their energy from a redox (oxidation-reduction) reaction. Typically, they exploit a reaction whose equilibrium position depends on temperature. For example if a high temperature (such as where hot fluids react with rock during hydrothermal circulation) drives the reaction in one direction but a low temperature (where vent water mixes back with ocean water) tends to drive the reaction the other way, then an organism can extract energy by getting involved in this 'reverse' reaction. This is only effective when the low-temperature ('reverse') reaction is kinetically inhibited, which provides the opportunity for a biological catalyst to become involved. (A chemical reaction is 'kinetically inhibited' when there is a significant energy barrier to be overcome to enable the reaction to proceed.)
An example of this in ocean-floor hydrothermal systems on Earth is the biological production of methane ('methanogenesis'). During hydrothermal alteration of newly created oceanic crust iron reacts with water. The iron is oxidised and the water reduced to hydrogen. Carbon is discharged in vent fluids as carbon dioxide, arising partly from oxidation of crustal and mantle carbon and partly from breakdown of carbonate rocks that have been drawn into the mantle at subduction zones. Thus, hot vent fluids are rich in carbon dioxide and hydrogen. In solution, these gases are related by the equilibrium reaction:

Note: when a chemical reaction is written this way, (aq) signifies something in aqueous solution, (l) signifies a liquid, (s) signifies a solid and (g) is a gas.
At high temperatures the equilibrium lies well to the left, so that in a hot solution carbon dioxide and hydrogen are stable. At lower temperatures, including those in seawater, the equilibrium position lies well to the right, but in a lifeless ocean an energy barrier would inhibit the reaction from moving in this direction. However, with biological mediation most of the carbon dioxide and hydrogen can react to form methane and water as the temperature falls. This is the reaction that methanogenic bacteria exploit as their source of energy.

Note: (CH2O)n indicates carbohydrate in biological cell material, and the subscript n indicates that the real formula is more complicated than simply CH2O.
In principle, this reaction could be used by Europan equivalents of methanogenic bacteria at hot vents. There are reasons, however, why this particular reaction may not be a viable source of biological energy on Europa. One reason is that without (so far as we know) subduction of oxidised species, Europa's hydrothermal fluids are likely to be considerably more reducing than the Earth's. This would lead to vent fluids being naturally rich in methane rather than carbon dioxide, which would therefore deprive methanogens of their energy source. Another reason is that high pressure drives the reaction in Equation 4 towards the right. Now do Question 11, which compares the pressure on the Earth's ocean floor with that at the floor of Europa's ocean.
Question 20
The pressure on an ocean floor is given by the expression P = ρgd, which you have already met in a slightly different context in Box 7, as Equation 2 (see Section 2.4). For our current purpose, ρ is the average density of the overlying ocean, g is the acceleration due to gravity on the planetary body concerned, and d is the depth of the ocean. On Earth, we can take ρ to be 1030 kg m−3, g to be 9.8 m s−2, and d to be 3.0 km (the approximate depth of a mid-ocean ridge). On Europa, treating the ice thickness as negligible relative to the ocean thickness, we can take ρ to be 1180 kg m−3, g to be 1.3 m s−2, and d to be 100 km. Use these values to calculate the pressure at the exit of a hydrothermal vent on:
(a) the Earth's ocean floor
(b) Europa's ocean floor.
Answer
(a) Inserting the relevant values into Equation 2 (and remembering to convert from km to m), we get:

(kg m s−2 m−2 is force per unit area, which is pressure. The SI unit of pressure is the pascal, abbreviated Pa. Note that kg m s−2 m−2 could be written as kg m−1 s−2 but this would obscure the significance of kg m s−2 being the SI unit of force.)
(b) Similarly, inserting the relevant values into Equation 2 we get:

(or 200 MPa if we treat the 100 km depth to be valid to only one significant figure).
Thus, the pressure on Europa's ocean floor is about five times that at a mid-ocean ridge hydrothermal vent on Earth. This may not seem a big difference, and would be unlikely to have any adverse effect on, say, biological cell structure. However, it would affect the equilibrium in Equation 4, so that carbon tended to be outgassed as methane rather than carbon dioxide. The situation would be even less favourable for methanogenic life if Europa's subduction-deprived mantle is more reduced than the Earth's, because this would make the methane to carbon dioxide ratio very high in the first place. It would also mean that Europa is unlikely to provide favourable habitats for analogues of terrestrial SLiME (subsurface lithautotrophic microbial ecosystems).
Perhaps, then, biological methanogenesis is not viable on Europa. In an extreme case, Europa's hydrothermal fluids could be so reducing that the only plausible oxidants that could provide an energy source for life would be oxidised metals, such as ferric iron (Fe3+). A suitable reaction is represented by:

in which the iron in vent fluids is reduced by reaction with hydrogen. Alternative reducing agents could be hydrogen sulfide or even methane. In all these cases, biological organisms could feed off the energy released during reduction of Fe3+ to Fe2+.
On the other hand, it is conceivable that Europa's ocean may actually be moderately oxidising in character.
Question 21
Can you recall from earlier in this course a mechanism whereby molecular oxygen is known to be generated on Europa?
Answer
In Section 2.2 you learned how exposure to charged particles and solar ultraviolet radiation in the near-surface ice leads to radiolytic and photolytic breakdown of water molecules to produce oxygen and hydrogen.
The hydrogen escapes relatively easily to space, but much of the oxygen is held within the ice crystals. These processes are only effective in the upper few micrometres (μm) of the ice, but 'gardening' by micrometeorites and slightly larger impacts can be expected to mix the products to a depth of about 1 m in the regolith. We do not know how efficiently, if at all, such oxygen is eventually mixed into the ocean, but obviously this could occur from time to time when melting, especially during chaos formation, reaches the surface.
There is actually a radiolytic mechanism whereby oxygen could be generated from either ice or liquid water at any depth below the surface. This is because one of the common elements thought to be dissolved in the Europan ocean has a radioactive isotope.
Question 22
Look back at Figure 15 (see Section 2.2), and see if you can recognise which of these elements has a radioactive isotope.
Answer
The element with a radioactive isotope is potassium.
The radioactive isotope is 40K, which on Earth, and presumably Europa too, makes up about 0.012 per cent of the total potassium today, and would have been about ten times more common shortly after Europa was formed. β-particles and γ-radiation are emitted by 40K as it decays and both can radiolytically break water into hydrogen and oxygen, by means of the series of reactions indicated in Box 4 (see Section 2.2).
This process could yield about 1010 moles of oxygen per year in Europa's ocean. Provided there is sufficient carbon available and a suitable reaction pathway, this would be enough to support about 107-109 kg yr−1 of biomass production. However, the limited availability of carbon in the right form and right place almost certainly means that the actual rate (if any) of biomass production in Europa's ocean is probably less than this. A likely value, allowing for a modest amount of hydrothermal energy, is about 105-106 kg yr−1.
Question 23
Rates of biomass production on the Earth today are about 5 ×10¹³ kg yr−1 by photosynthesis on land, a similar amount by marine photosynthesis (mainly by microscopic plankton), and about 1010 kg yr−1 by chemosynthesis at ocean-floor hydrothermal vents.
How do these rates of biomass production compare (by orders of magnitude) with the value proposed for Europa?
Answer
Europa's annual biomass production is estimated to be at least eight orders of magnitude less than that of present-day Earth (a maximum of 106 yr−1 on Europa versus a total of about 1014 yr−1 on Earth). Even if we compare only chemosynthetic biomass production, Europa is estimated to be at least ten thousand times (four orders of magnitude) less productive.
It is important to remember that the estimates for Europa are very uncertain, and could be underestimates by two or three orders of magnitude - or ridiculous overestimates if Europa supports no life at all. However, Europa could offer sites that are just as favourable for life to have originated as those on the early Earth, and equally hospitable for so-called extremophiles to flourish today, albeit in smaller quantities than on Earth. Europa's small mass (so small that it cannot hold onto an atmosphere) and its distance from the Sun beyond the 'habitable zone' have prevented it from developing a photosynthesis-dominated biosphere, but the viability of any chemosynthetically supported biosphere is independent of this. Thus, according to some assumptions at least, the prospects for life on Europa appear encouraging.
Whether any life has remained at the level of simple single-celled autotrophs or diversified into multicellular forms, and whether any heterotrophic organisms have evolved to prey on these (as imagined by Arthur C. Clarke) remains to be seen.
We will conclude our discussion of Europa with a brief look at plans to gather further data on this intriguing world.
2.6 How can we find out more about Europa?
There are currently no scheduled missions to Jupiter's moons, since NASA's Jupiter Icy Moons Orbiter (JIMO) was cancelled in 2005, but Europa remains a high priority target for both NASA and ESA, so a mission with simlar objectives to JIMO seems likely by about 2020. On arrival at Jupiter, JIMO would have gone into orbit first round Callisto, then Ganymede and finally Europa.
The main objectives of JIMO at Europa would have been to:
Determine the presence or absence of a subsurface ocean.
Characterise the three-dimensional distribution of any subsurface liquid water and its overlying ice layers.
Understand the formation of surface features, including sites of recent or current activity, and identify candidate sites for future lander missions.
Question 24
What techniques do you think a spaceprobe in orbit could use to meet these objectives?
Answer
Perhaps the most obvious technique to use to find out more about Europa is extensive imaging of the surface, at high enough spatial resolution to identify chaos regions and with high enough spectral resolution to identify salts and other contaminants in the ice. You may also have thought of the use of a radar or laser altimeter to map the topography, and thereby contribute to Objective 3. Potentially, a radar instrument could also help significantly with Objectives 1 and 2, as discussed below. Precise tracking of the orbiter's trajectory could give information about the details of Europa's gravity field, and hence its internal structure, which would also help with Objectives 1 and 2.
The answer we gave to Question 13 covers all we expected you to come up with, but there are other techniques that are also likely to be useful. Possible instruments would include an imaging system with spectroscopic capability, a laser altimeter, and an ice-penetrating radar. The laser altimeter would map Europa's topography, and in particular it would determine the height of Europa's tidal bulges. The bulges should be only about 1 m high if the ice is solid throughout, but about 30 m high if there is 10 km of ice floating on water, so altimetry is a neat way of addressing the presence or absence of a subsurface ocean. The radar would be directed directly downwards with the intention of recording echoes from the ice-water interface. Unless the ice is particularly salty, which would tend to attenuate the signal, the radar should detect the ice-water interface wherever it lies at less than about 10 km depth, as is likely to be the case in young chaos areas (see Section 2.4). This, plus any further visual clues to ice thinness or recent activity from the imaging system, would be the main means of selecting landing sites for future lander missions.
An artist's impression of a Europa-orbiting mission in action is shown in Figure 28. The current ambition for a mission (in the distant future) is to have a miniature robotic submarine (a 'hydrobot') capable of exploring the ocean to seek for signs of life. In order to deploy this, a way has to be found to make an access hole in the ice, which presumably must be done either by mechanical drilling or by using heat to melt a borehole. Even after landing on the thinnest ice, the technological challenges of making such a hole would be severe.
There is also another problem, which is the planetary protection issue of how to prevent contamination of Europa's biosphere with organisms inadvertently carried from Earth. It would be foolish to send a sophisticated suite of instruments to Europa unless we could be as certain as possible that any signs of biological activity were not attributable to microbes carried to Europa by the same mission or any previous spacecraft. Contamination of Europa's biosphere (or the accidental establishment of a biosphere where none had previously existed) would undermine any conclusions about the independent origin and evolution of life that could otherwise be drawn following the discovery and study of Europan life. Most investigators would recognise an ethical duty to safeguard the integrity of future studies of Europa's biosphere and to protect against potential harm to any Europan organisms. This duty is codified in legal form by the 1967 United Nations' Treaty on Principles Governing the Activities of States in the Exploration and Use of Outer Space, Including the Moon and Other Celestial Bodies.
Very few terrestrial microbes would survive a journey to Europa, and of these only a tiny proportion would be likely to be able to feed and reproduce on Europa or in its ocean. However, just one viable organism delivered to the right (or wrong!) place that was then able to feed and multiply would do incalculable harm. With this in mind, a report on preventing biological contamination of Europa published in 2000 by the US National Academy of Sciences recommends that the bioload of any Europa-bound mission should be minimised by using levels of cleanliness during assembly and subsequent sterilisation that are at least as stringent as those currently agreed for Mars missions.
Illuminating lessons about preparing to penetrate through a thick ice cover into a body of water may be learned from the case of Lake Vostok. This is a large lake that has been trapped beneath the Antarctic ice for possibly several million years, and is suspected of housing a sealed-in ecosystem. Exploration of Lake Vostok and the proper implementation of anti-contamination protocols are widely held to be realistic rehearsals for exploration of Europa's ocean, as discussed in Box 8.
Box 8: Lake Vostok - an ice conundrum
In 1974, Russian scientists began drilling deep into the ice at their Vostok research base, situated at the geomagnetic south pole in Antarctica. Samples of ice and the gases and other trace materials trapped within it provide a valuable and continuous record of climate changes and large volcanic eruptions during the past 400 000 years. Incidentally, viable micro-organisms were found entombed within the ancient ice too. It was not until 1994, by which time the borehole had reached a depth of about 3 km, that seismic and other studies revealed that the ice overlies the largest subglacial lake in the world, covering about 2 × 10⁵ km2, which is the same area as Lake Ontario. This is known as Lake Vostok (Figure 29).
In places the water depth reaches about 1 km. The oldest ice overlying the water is less than a million years old, but the ice sheet as a whole is slowly flowing across the lake, so the lake itself may have been sealed off from the surface for as long as 14 million years. The lake is suspected of supporting its own ecosystem, subsisting either by a meagre rain of organic matter at places where the overlying ice melts or by chemical energy at suspected hot springs.
These realisations united scientists from many nations in plans to bore through the base of the ice in order to sample the lake water and deploy a probe into the lake. One method suggested to keep the hole sealed and to prevent contamination was that the hole should be drilled to within a few metres of the roof of the lake. A cylindrical probe would then be lowered to the base of the hole that could sterilise itself while waiting for the hole above to freeze over, and then melt its way down into the lake. It would pay out a tether behind itself as it travelled, which would act as a communications link to the surface (Figure 30).
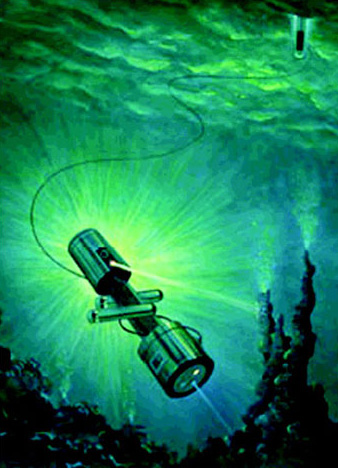
However, two serious objections emerged that put at least a temporary halt to these schemes. First, the self-sterilisation techniques for the probe were untested. Secondly, when the Russians had begun drilling back in the 1970s, they were anxious to stop the hole freezing shut behind the drill bit so they pumped a mixture of aviation fuel and antifreeze (Freon) into the hole. There is now 60 tonnes of this toxic chemical mix in the hole, and no one can be sure that none of this will leak into the lake if the hole is continued. Pressure from a coalition of environmental groups caused drilling to stop in 2001 (Figure 31), and plans for any kind of penetration into the lake were put on hold for maybe a decade.
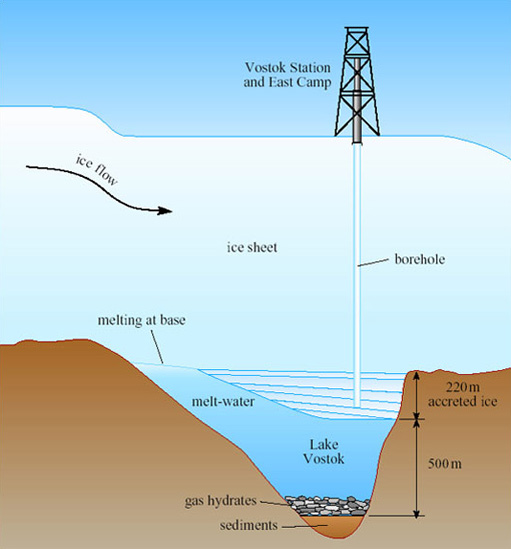
3 Other icy bodies as abodes of life?
You have seen that Europa offers arguably the most promising habitat for present-day life in the Solar System, other than on the Earth itself. This is because ice or water overlying warm rock can lead to hydrothermal circulation, offering hot springs where life could originate in the first place and subsist on chemical energy thereafter. There would not actually have to be a global ocean below the ice, but this would help by allowing organisms to spread from one vent to another.
Question 25
Can you suggest places in the Solar System where conditions might now be, or might formerly have been, sufficiently similar to Europa for life to have got underway there too?
Answer
Any of the tidally heated icy satellites would seem promising, especially those that were at any time heated sufficiently for a global ocean to form below the ice. Of those illustrated earlier in this course, Callisto and Rhea (Figure 10 in Section 1.3) do not seem promising, whereas Enceladus and Ariel (Figure 11b and d in Section 1.3) would seem the likeliest.
Enceladus is particularly intriguing. Voyager obtained useful images of less than half its surface (Figure 11b). Although parts are fairly heavily cratered, other areas seem smooth even on the highest resolution (2 km per pixel) images. The Cassini mission has made several close fly-bys of Enceladus, revealing that the 'smooth' areas are actually finely fractured and, more intriguingly, a zone of warm cracks near the south pole from which jets of water-ice were seen to be sprayed into space. The power source is most likely to be tidal, and this proof of the combination of heat and water has nudged Enceladus up the rankings of potential habitats for life. Click here for the latest news on Enceladus and Saturn's other icy moons.
The surface of Triton (Figure 6 in Section 1.2) shows great variety, with plenty of evidence of cryovolcanic resurfacing. We know from spectroscopic evidence that the surface ice is a mixture of nitrogen, methane, carbon dioxide, carbon monoxide and water, and it is likely that there is some ammonia too. This is probably a true differentiated crust in the geochemical sense, overlying a mantle that is richer in water-ice. Triton's bulk density suggests that a rocky core begins at a depth of about 350 km. There is a fair degree of superimposed impact cratering on all terrain types, so widespread cryovolcanism appears to have ceased - probably at least hundreds of millions of years ago. Apart from seasonal changes in the sizes of the polar caps of frozen nitrogen, and what appear to be solar-powered geysers rupturing the south polar cap, no current or recent activity has been identified. This is consistent with the lack of a known tidal heat source. However, in the aftermath of its capture by Neptune there would have been a period of probably about a billion years while tides acted to force Triton's orbit to become circular. This is probably when most of the cryovolcanism took place. During this period there could have been a Europa-like ocean below the ice with plenty of time for life to become established. If so, life could be clinging on thanks to feeble radiogenic heat - or perhaps future explorers will find nothing but the fossilised remains of an extinct biosphere.
Apart from Enceladus, the icy satellite that may be experiencing the greatest rate of tidal heating today is one that you probably did not consider at all. This is Charon, the only large satellite of Pluto (Table 1 in Section 1.1). We know much less about Charon than the other large icy satellites, because no spaceprobe has been there, so we have to rely on telescopic data, such as spectroscopic information and the albedo maps in Figure 32. Charon orbits in Pluto's equatorial plane, and their rotations are mutually tidally locked so that they permanently keep the same faces towards each other. There would seem little scope here for on-going tidal heating. However, Pluto's axis (and hence Charon's orbit) is tilted over at an angle of 119.6°. This leads to competing tidal pulls on Charon by Pluto and the Sun in such a configuration that, according to some models, there could be substantial tidal heating in Charon's interior today.
Note: the tilt of a planet's axis is conventionally measured relative to the perpendicular to its orbital plane. Pluto's tilt of >90° signifies that its rotation is retrograde.
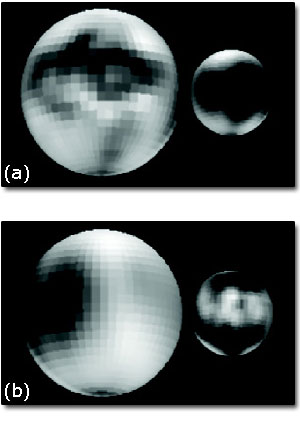
Pluto itself is probably not being heated tidally, but spectroscopy has revealed its surface to consist of at least as rich a cocktail of ices as on Triton. It is likely to be fully differentiated, especially if Charon owes its origin to a giant impact event similar to that which formed the Moon. An ocean, with life-bearing potential, could have persisted below the solid ice for a considerable period until most of the accretional heat from such a collision had leaked away. This heat would have been stoked up by tidal forces until Pluto's rotation became synchronous with Charon's orbital period. Speculation is likely to continue relatively unbounded until a spaceprobe visits Pluto and Charon. This is a much delayed NASA mission currently called New Horizons, which was launched in January 2006. The spaceprobe will fly past Pluto and Charon in 2015 and then explore further into the Kuiper Belt.
In an icy satellite with no tidal heating, we would have to look to other sources of geothermal heat to power hydrothermal vents, such as radiogenic heating or heat left over from the accretion process. Any icy satellite with a differentiated structure must have experienced at least some water-rock geochemical interaction, but this may not necessarily have been strong enough or sufficiently prolonged to favour life.
Finally, what about Jupiter's outer two Galilean satellites?
Question 26
Does the evidence in Figures 10a (see Section 1.3) and 14 (see Section 1.5) make Callisto look like a favourable site for a Europa-style ocean?
Answer
Figure 10a shows a uniformly heavily cratered and, therefore, ancient surface, and Figure 14 shows an interior that is only weakly differentiated. Both these factors suggest that an ocean is unlikely.
It is not thought likely that Callisto experienced significant tidal heating after its rotation became synchronous. Ganymede, however, may have been affected by tidal heating episodes (though not so strongly as Europa) when its degree of forced eccentricity fluctuated as a result of mutual orbital interaction with Europa and Callisto. It bears signs of this in the way that its ancient heavily cratered surface is transected by belts of younger terrain (Figure 33). However, even the youngest belts of cross-cutting terrain on Ganymede have numerous impact craters superimposed on them, and are likely to exceed a billion years in age.
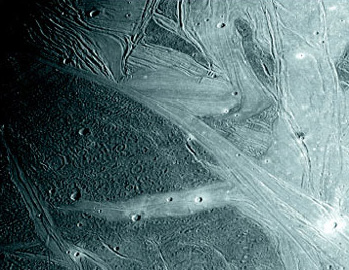
The imaging data would seem to be giving us a clear story. However, the Galileo Orbiter measured magnetic fields apparently induced within both these satellites by their orbital passage through Jupiter's magnetosphere, which complicate the issue. In the case of Ganymede, the induced field could originate in an iron-rich core, but what we know of Callisto's internal density distribution shows fairly robustly that it can have no such core. That being so, the only reasonable explanation remaining seems to be that Callisto has an electrically conducting ocean at least 10 km thick and no more than 100 km deep. A similar ocean could also account for Ganymede's magnetic field.
The proposition that there are relatively shallow oceans beneath the surfaces of Ganymede and Callisto seems totally at odds with the ancient appearances of their surfaces, and allows us to end this course with a caution.
Where there is an ocean there could be life, but we understand far too little about any of the icy satellites. Although there appear to be many reasons why some of them could harbour life, and that most could have done so at times in the past, it may be a long time before we know for sure.
Now test some of the knowledge and skills you have developed in this course by answering the following questions.
Question 27
Examine again the groove in Figure 24 that you looked at in Question 9 (see Section 2.3.4). It is the same groove that you can see near the right-hand edge of Figure 26 (also in Section 2.3.4). On Figure 24, locate where the line of this groove passes between adjacent rafts about 5 km northwestward of the edge of the outline indicating Figure 26 (conveniently, 5 km is approximately the length of a short side of this outline).
(a) What evidence is there for the relative ages of this groove and the matrix between the rafts at this location?
(b) What are the implications for the time period over which the matrix was mobile in Conamara Chaos as a whole?
(c) How can we deduce that the ejecta from the Pwyll impact overlies the matrix at this location, and what does that tell you?
Answer
(a) The matrix between the rafts here is smooth and shows no sign of being cut by the groove. This means that the groove must be older than the matrix. (In case you found it hard to see the necessary detail on Figure 24, it is enlarged in Figure 34.) This is unlike what happens to the northwest and to the southeast, where the groove is clearly seen to cut the matrix (see Question 9).
Thus the matrix between the rafts here appears to be younger than the matrix elsewhere in Figure 24.
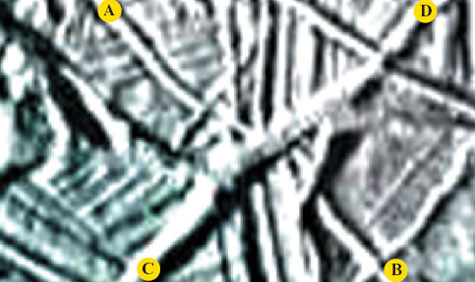
(b) If the matrix between the rafts is younger than the matrix elsewhere, the time sequence of events in the region as a whole must be: chaos formation, freezing and thickening of matrix until it becomes rigid enough for grooves to form on it, formation of this groove, local remobilisation of matrix between the rafts erasing the groove at this location. We can conclude that this part of the matrix has been active over a protracted time period.
(c) The matrix between the rafts here is white, so Pwyll ejecta lies on top of it (see caption for Figure 21 in Section 2.3.4). Remobilisation of the matrix would probably disrupt or destroy such a thin ejecta blanket, so probably the Pwyll impact post-dates this local remobilisation event.
Question 28
In Question 10b (see Section 2.4) you calculated a raft thickness in Conamara Chaos based on the assumption that the heights of the cliffs at the raft edges were a result of rafts floating in quite a dense brine. However, perhaps at the time when the topography became 'frozen in' the rafts were actually floating in some kind of slush, which would be less dense than the brine. What is the implied raft thickness for a raft density of 1126 kg m−3 and a slush density 1140 kg m−3?
Answer
Inserting the new value of 1140 kg m−3 for ρ2 into the method used to answer Question 10b, we get:

The raft thickness is (h + w), and so we need to add 100 m to this, giving a raft thickness of 8143 m, which we ought to quote to no more than two significant figures, i.e. 8100 m.
Question 29
Imagine it is the year 2100, and that the fifth of a series of probes into Europa's ocean has at last detected life in the form of micro-organisms that appear to be based on the same sort of DNA as on Earth. List the alternative implications for the establishment of life on Europa that could be drawn from this discovery, and how you would hope (eventually) to deduce the truth.
Answer
Alternative implications could be:
The site has been contaminated by viable organisms accidentally brought from Earth by an earlier probe.
Life is indigenous to Europa and arose there independently.
Life is indigenous to Europa, and both Earth and Europa were seeded from the same external (for example, cometary) source.
Life is indigenous to Europa, but arrived there as contamination via a meteorite from Earth (or Mars).
Implication 1 would be unlikely if the pre-launch cleaning and sterilisation of all the previous probes was believed with confidence to be sufficiently stringent. However, it could only be ruled out by detailed genetic study of the 'Europan' micro-organisms to prove that they were not closely related to terrestrial species (hard to do using a robotic probe) or if a sufficiently complex ecology (especially with multicellular organisms and heterotrophs preying on the autotrophs) were discovered that could not have had time to develop since the first possible contamination episode.
Implications 2-4 would all be taken as proof of extraterrestrial life, but detailed genetic studies would be necessary to try to establish which was correct. If Europan amino acids were discovered to have right-handed chirality in contrast to the left-handed chirality ubiquitous on Earth, this would point towards implication 2. However, there is at least a 50:50 chance of left-handed chirality arising independently, so discovery of left-handed chirality on Europa would not help us to decide between any of these implications.
Conclusion
Many of the large icy bodies in the outer Solar System are internally differentiated. Thanks largely to tidal heating, some, especially Europa, are likely to have an ocean sandwiched between the icy exterior and the rocky core. Others may have had such an ocean in the past.
Wherever water rests on warm rock, water must percolate into it and become heated. This will cause hydrothermal convection to begin. Hot, chemical-rich water will emerge at vents, where the resulting local chemical disequilibrium provides an opportunity for living organisms to extract energy by acting as mediators (biological catalysts) for redox reactions.
If it is true that life on Earth originated at hydrothermal vents, then it is equally likely that life could have become established around similar vents at the 'ice'-rock interface on icy bodies.
Acknowledgements
Course image: Stuart Rankin in Flickr made available under Creative Commons Attribution-NonCommercial-ShareAlike 2.0 Licence.
Except for third party materials and otherwise stated (see terms and conditions), this content is made available under a Creative Commons Attribution-NonCommercial-ShareAlike 4.0 Licence
The following appears in Introduction to Astrobiology (Planetary Science Book 2: ISBN 0-521-54621-4) which is published in association with Cambridge University Press and forms part of the course material for The Open University course: S283 Planetary science and the search for life.
Grateful acknowledgement is made to the following sources for permission to reproduce material in this course:
Figure 1, 2 and 8: © Science Photo Library;
Figure 3: © National Portrait Gallery;
Figures 4-6, 7, 10a, 11-14, 16, 17, 19, 21-26, 28-29 and 33: © NASA;
Figure 10b: © Calvin J. Hamilton;
Figure 18: from Satellites of the Outer Planets, 2nd edition by David A Rothery, copyright © David A Rothery;
Figure 20: USGS/Cascades Volcano Observatory;
Figure 30: © Rob Wood/Wood Ronsaville Harlin, Inc;
Figure 32: Image courtesy of Marc.W. Buie/Lowell Observatory.
© Rob Wood/Wood Ronsaville Harlin, Inc
Don't miss out:
If reading this text has inspired you to learn more, you may be interested in joining the millions of people who discover our free learning resources and qualifications by visiting The Open University - www.open.edu/ openlearn/ free-courses