Animals at the extremes: The desert environment
Use 'Print preview' to check the number of pages and printer settings.
Print functionality varies between browsers.
Printable page generated Tuesday, 9 June 2026, 10:56 AM
Animals at the extremes: The desert environment
Introduction
This course is the first in a series of three on Animals at the extreme. It is concerned with the integration of behaviour anatomy, physiology and biochemistry in diverse vertebrates that live in deserts. Once you have completed this course, you will be all the more able to appreciate the linked courses that follow, Animals at the extreme: hibernation and torpor and Animals at the extreme: the polar environment. These courses build on and develop some of the science you will study here.
This OpenLearn course provides a sample of Level 3 study in Science.
Learning outcomes
After studying this course, you should be able to:
define and use, or recognise definitions and applications of, each of the bold terms
provide examples that show there is a continuum of desert climates and environments that link to diversity of flora and fauna
explain, with examples, the thermoregulatory strategies of evaders, evaporators and endurers, and interpret relevant data
describe the importance of integration of behaviour, anatomy, physiology and biochemistry in the study of animals that live in deserts
explain physiological mechanisms of water conservation and cooling in named evaders, evaporators and endurers, and interpret relevant data.
1 The desert climate: An introduction
If you have visited a desert you will have noticed the sparse plant cover, or in certain sandy deserts, the almost complete absence of plant life. The low productivity of deserts derives from their defining feature, which is aridity. Scarcity of water restricts the diversity and amount of plant cover, and in turn the diversity and abundance of animals. However, if you were visiting one of the American deserts after rains, you would be rewarded by the sight of the desert ‘in bloom’, as vast swathes of annual plants such as the Mojave aster (Xylorhiza tortifolia) and sand verbena (Abronia villosa) flower simultaneously. You might catch sight of insects such as beetles and locusts, and vertebrates including lizards and occasionally mammalian herbivores, such as gazelle, in African deserts and oryx in the Arabian desert.
Hot deserts located 15°–25° north and south of the Equator have daytime sunshine all year round (Figure 1). The persistent descending air and stable high pressures create the hot climate. While daytime temperatures can be as high as 45°C, night-time temperatures may be close to freezing as heat is lost by radiation into the clear night skies.
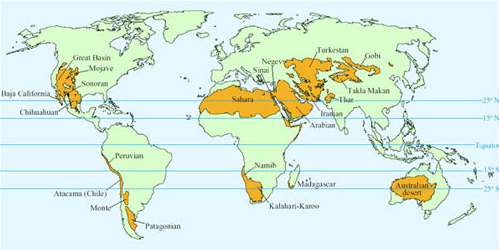
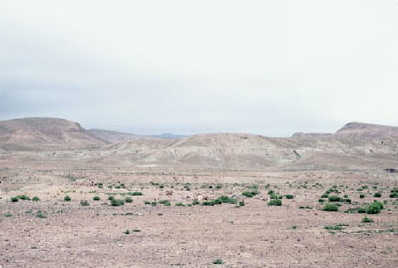
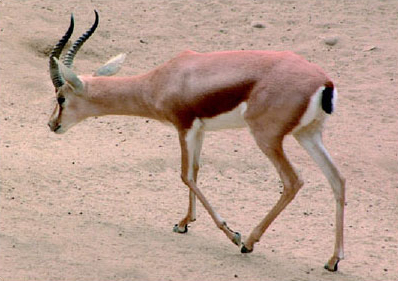
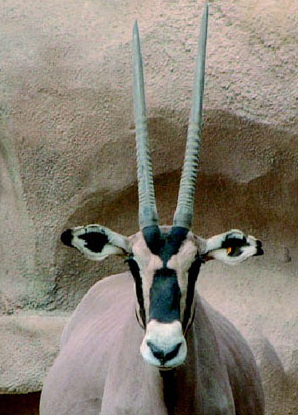
Aridity of deserts has three main causes. The deserts in parts of North and South America are arid because they are located on the leeward side of mountain ranges in rain shadow. Rain falls as moisture-laden air rises up the mountains, so that the air is dry by the time it reaches the leeward side. The Gobi and Turkestan deserts lie in the centre of a large continent and their lack of rainfall is because they are a long distance from the sea. The Sahara (Figure 2) and Arabian deserts are arid because of persistent large high-pressure masses of dry air that prevent penetration of rain-bearing storm systems. A popular concept of deserts is based on the extreme Sahara, where huge areas of sand dunes support little, if any, plant growth. Certain animals such as camels (Camelus spp.; Figure 3), Dorcas gazelle (Gazella dorcas; Figure 4) and oryx (Figure 5) that survive there by browsing on the sparse plant life and drinking very little or no free water, are regarded as typical desert species.

In fact the picture is much more complex; the environment of each desert is unique, and depends on the interaction between T a, precipitation, relative humidity and wind. A useful classification is that of Meigs (1953), who defined deserts according to aridity (Table 1). The aridity of a desert is determined not just by precipitation but also by the evaporation and transpiration of plants. In order to simplify classification of arid and semi-arid areas, various types of aridity index have been devised. De Martonne's aridity index has been used widely and is calculated from the formula:
I a = aridity index
P = mean annual precipitation/mm
T = mean annual temperature/°C
Note that values for average precipitation can be misleading because in arid deserts, especially hyper-arid desert, there are many years that have no rainfall at all. Certain coastal deserts such as the coastal strip of the Arabian Peninsula obtain part of their annual precipitation from thick fog, caused by cold sea breezes that increase humidity sharply. Subdivisions of aridity index are roughly the same as those for average rainfall.
| Rainfall/mm yr−1 | Aridity index | Aridity | Examples |
|---|---|---|---|
| < 25 | < 5 | Hyper-arid | Namib; Arabian |
| 25–200 | 5–20 | Arid | Mojave |
| 200–500 | 20–50 | Semi-arid | Parts of Sonoran |
All deserts have a wide range of T a, but mean annual temperatures vary from desert to desert. Deserts can be defined as hot, mild, cool or cold (Table 2), but the reality is a continuum of desert climates rather than a set of desert climates each with a well-defined rainfall and T a range.
| Climate | % of deserts | Examples | Mean T a coldest month/°C | Mean T a warmest month/°C |
|---|---|---|---|---|
| Hot | 43 | Central Sahara; central Australian | 10–30 | > 30 |
| Mild | 18 | Kalahari-Karoo, Chihuahuan | 10–20 | 10–30 |
| Cool | 15 | Mojave, Namib | 0–10 | 10–30 |
| Cold | 24 | Gobi | < 0 | 10–30 |
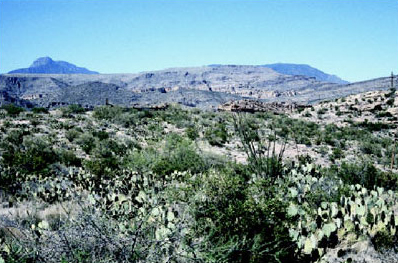
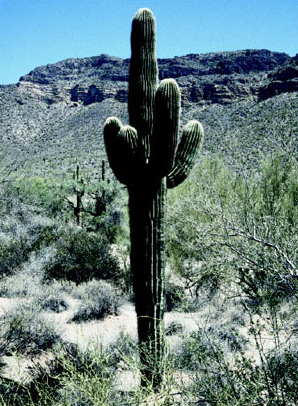
Deserts may have seasonal climates, with winters being much colder than the summers. The Sonoran desert covers about 260 000 km2 and spans the western part of the Mexican state of Sonora, southwest Arizona, southeast California and Baja California. Average rainfall is 120–300 mm yr−1, with the rain falling in two seasons. Storms from the North Pacific bring gentle rain from December to March, and surges of wet tropical air bring in rain storms from May to September. Winter temperatures are cool, averaging 13°C, and summers are extremely hot, reaching 40°C on average, but peaking at 50°C. Ambient temperatures can vary by as much as 40°C in a day. It is also important to appreciate that there are variations in climate, topography and vegetation within a desert. The Lower Colorado River Valley region of the Sonoran desert (Figure 6) is the driest hottest area, where annual rainfall may be < 50 mm and summer daytime temperature 50°C, with surface temperatures reaching 82°C; according to Meigs’ classification this desert would be classed as arid hot. Vegetation there consists of drought-tolerant shrubs and succulent cacti; following winter rainfall there is rapid growth of annual plants, which cover the ground in a mass of blooms. Within the Lower Colorado River Valley there is a large area of sand dunes forming a huge sand sea. In contrast, the Arizona Upland region has an annual rainfall of 70–300 mm, making it an arid or semi-arid desert according to Meigs. There is abundant vegetation including trees such as ironwood, blue paloverde and cat claw acacia. Cacti include 12 species of cholla (Opuntia spp.) and also saguara cactus (Figure 7). Scrub plants include desert saltbush and creosote bush. Winter annuals, e.g. California poppies, bloom in profusion after rain.
The Mojave desert spans the transition between the Sonoran and Great Basin deserts and extends throughout southeastern California, and parts of Nevada, Arizona and Utah, occupying about 100 000 km2. Summers are hot and windy, but during the winter, temperatures can dip to below freezing. The Mojave desert is arid, with only about 130 mm rainfall per year in a winter rainy season, but the rains fail in some years. The plant life in the Mojave desert comprises Yucca species, including the joshua tree, big sage brush, bladder sage and creosote bush and at least 200 other endemic species.
Despite the variations in the environment of different deserts, it is correct to say that all desert animals have to cope with water shortage, and animals living in hot deserts cope with extremely high daytime T a. Physiological problems linked to high T a are those associated with hyperthermia. Mammals and birds have an optimal core T b of around 38°C, and many species cannot tolerate increases > 2°C or so. The denaturation of crucial proteins, such as enzymes, begins at around 40–42°C, so hyperthermia also creates physiological problems for ectotherms. Daytime temperatures in desert environments can be much higher than the optimal T b, e.g. up to 56°C in Death Valley, California. Homeotherms subjected to heat stress use a suite of physiological mechanisms for cooling the body, which we will explore in later sections. Evaporative cooling is the most effective way for an animal to lower T b, yet if water is in short supply, dehydration is a serious problem, and the use of evaporative cooling is restricted. Behavioural mechanisms play an important role in cooling the body, both in desert ectotherms such as lizards, snakes and amphibians, and endotherms, such as birds and mammals.
Summary of Section 1
Despite deserts being diverse, they all have aridity in common as their salient climatic feature. Classification systems attempt to group deserts in terms of their aridity or mean annual temperatures. Major physiological problems for animals living in deserts include hyperthermia due to intense daytime solar radiation, and also hypothermia at night when desert T b can be below freezing. The shortage or lack of drinking water in deserts means that evaporative cooling cannot be used freely for physiological thermoregulation.
2 Environments and populations
2.1 Introduction
The unique climate and topography of each desert links to the unique and characteristic flora and fauna found there. From the brief description of deserts provided in Section 1, you can appreciate that a desert provides a variety of niches for animals and plants. The term ‘niche’ applied to animals describes its role in a particular environment, and includes a number of characteristics such as habitat range, how the animal feeds, its diet, its environmental requirements and also its predators. So a niche is effectively an animal's particular lifestyle within an ecosystem, and encompasses how it interacts with other organisms and the physical environment within that ecosystem. In desert ecosystems, insectivorous, herbivorous and seed-eating niches are occupied by small animals, including arthropods, lizards, small birds, rodents, squirrels and shrews. Medium and large-sized animals such as hares, gazelle, camels and ostrich occupy grazing and browsing niches. Predators include foxes, e.g. kit fox (Vulpes macrotis) and cats, e.g. cougar (Puma concolor) in the deserts of the southern USA and Mexico, and Rüppell's fox (Vulpes rueppelli) in the Arabian desert. Desert vertebrates make use of a variety of microenvironments and their associated microclimates, small-scale areas in which the climate is different from that of the habitat as a whole. For example, in a desert ecosystem, a cavity beneath a rock, a microenvironment, would have a lower T a than the surface and hence a different microclimate. A hyper-arid sandy desert, such as the Arabian desert, has a relatively low variety of microenvironments and associated microclimates available for vertebrates. Nevertheless, the sand at a few centimetres depth is significantly cooler than at the surface, and provides a relatively cool microenvironment for animals. In contrast, American deserts such as the Sonoran have a diverse range of microenvironments, and contain a richer diversity of vertebrate species.
Although our discussion here is restricted to vertebrates, you should be aware that many invertebrates, particularly insects, inhabit desert environments, and they provide an important food supply for many desert birds and mammals.
2.2 How animals interact with the environment is affected by their body size
Willmer et al. (2000) classify desert animals in terms of the range of body sizes and the rate of evaporation (Figure 8).
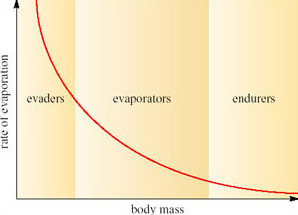
The logic of this classification can be appreciated by the following exercise. If you represent a small animal by a cube, and then make a larger scale model of it twice natural size, the linear dimensions of the larger animal would all be twice as large (Figure 9).
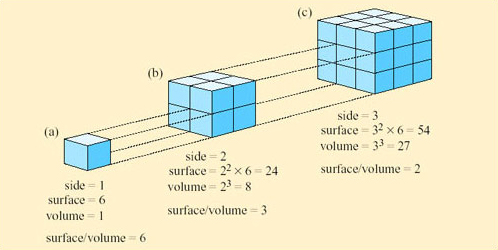
However, the surface area of the model would not be increased by a factor of 2, nor would the volume, as can be seen by comparing Figure 9a and b. If the linear dimensions double; the surface area increases by a factor of 4 (22) and the volume by a factor of 8 (23). So the ratio of surface area to volume is lower in a large animal than a smaller one. Since heat is transferred at the surface, a small animal has greater potential for rapidly gaining and losing heat than a larger one because of its relatively large surface area. A smaller animal also has greater relative potential for evaporative water loss through its greater area of skin.
However, animals are not cube-shaped, and as you will learn in Section 2.5, certain desert species have features that can increase their surface area relative to their volume.
2.3 Behavioural strategies of evaders
Small animals, classified as evaders, include desert amphibians and reptiles, and also mammals, rodents and insectivores. The term ‘evaders’ refers to the animals’ behaviour, which helps to prevent overheating of the body on hot sunny days, and avoids the need for cooling by evaporative water loss, which is not feasible for small animals living in an arid habitat. Evaders make use of microenvironments such as shady rock crevices, underground burrows and shade cast by plants, for behavioural thermoregulation. Evaders also prevent excessive cooling of the body by behaviour, retreating to shelter when T a plummets at night.
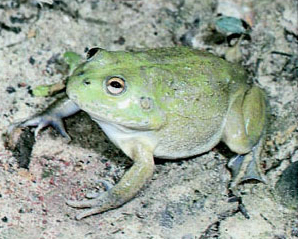
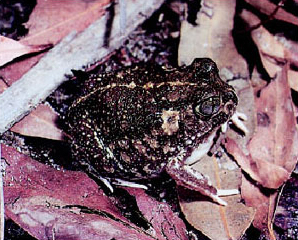
The ultimate evaders are desert frogs such as Cyclorana spp. (Figure 10) and Neobatrachus spp. (Figure 11) from Australia, which spend most of the year in aestivation, inside a burrow. Aestivation is a special kind of dormancy, which enables animals to survive lack of water and high T a during a hot dry season. During the short rainy season, desert frogs accumulate water in the bladder, where it remains during aestivation. A famous example, Cyclorana platycephala (Figure 10), is known as the water-holding frog; aboriginal people used to dig up the aestivating frogs and squeeze them, in order to collect and drink the water.
During aestivation, the frogs are protected from losing water to the dry soil in the burrow by a cocoon. At the end of the rainy season, the frogs burrow into the soil, and the skin undergoes a type of moulting process in which layers of epidermis are separated from the body but not shed, forming a protective cocoon, covering all parts of the body apart from the nostril openings. The cocoon thickens, becoming heavily keratinised, and prevents loss of water from the frog's body during the 9–10 months of aestivation. At the start of the rainy season, heavy rain with consequent seepage of water into the frogs' burrows, stimulates the frogs to emerge. Breeding and feeding occur during the short wet season.
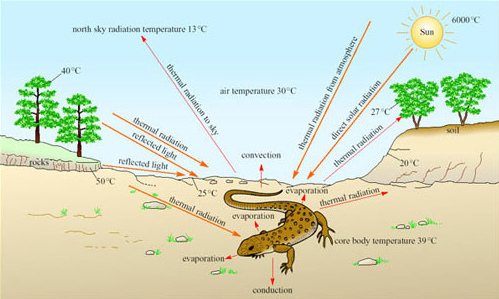
Reptiles with a scaly keratinised skin are not so prone to evaporative water loss as amphibians, and are the vertebrates that you are most likely to see on a visit to a desert. Reptiles are ectotherms and rely on solar radiation for warming the body, and maintaining high T b during the day. Desert reptiles have no problem in gaining heat for maintaining T b at a high level on hot sunny days (Figure 12).
Activity 1
What are the sources of energy gain and routes of heat loss for the lizard?
Answer
The lizard gains heat energy via thermal radiation from the Sun, the atmosphere and the ground. Heat energy is lost via conduction from the body to the ground, by evaporative water loss, convection and thermal radiation to the sky.
On a hot sunny day, more heat is gained than lost, and it is important for a desert reptile to avoid overheating. It is equally important to reduce loss of body heat when T a plummets at night or during the winter.
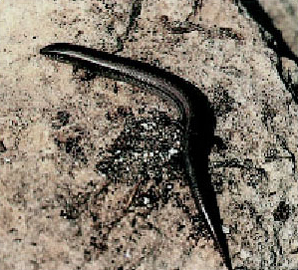
During the day, reptiles may move between warm and cool areas in order to maintain T b. This movement between warm and cool areas for maintaining eccritic temperature is called shuttling. Those species that maintain high stable T b when environmental conditions allow by adopting heliothermic strategies, are called thermal specialists. In contrast, there are some species, known as thermal generalists, which allow their T b to fluctuate and decline, even when they could shuttle between sun and shade to maintain high stable T b during the day, or use their burrow at night to prevent cooling of T b to the outside T a. Bedriagai's skink (Chalcides bedriagai; Figure 13) is a thermal generalist, preferring to spend a lot of time hiding under rocks rather than basking in the sun.
The side-blotched lizard (Uta stansburiana; Figure 14), found in the Sonoran desert, is a typical thermal specialist. It is a small species, only 4–6 cm long when full grown.
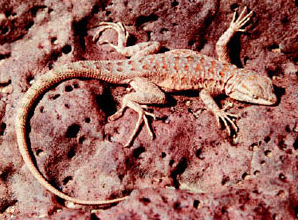
In the morning, Uta warms by basking, initially orientating itself at right angles to the Sun's rays and flattening the body against the substratum for maximum exposure to solar radiation. When warmed Uta turns the body so that it faces the Sun while resting. Uta maintains T b around 36–38°C. Active foraging for insects, scorpions and spiders may overheat the body, and for cooling off, especially around noon, Uta moves to the shade of rocks and scrubby bushes. Shuttling in this way enables this species to stay active during the day for most of the year except in areas where winter temperatures dip to freezing.
A few desert reptiles are nocturnal; the Moorish gecko (Tarentola mauretanica; Figure 15), is found in arid regions in North Africa (also in Spain, France and Greece, so it is not restricted to deserts).
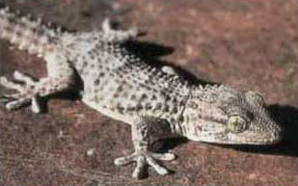
Tarentola is most active for a few hours after sunset. During the night, its T b is as low as 18°C, and can fluctuate by up to 11°C. Recall that lizards that tolerate wide fluctuations in T b, even when they could use features of the environment to maintain a steady T b, are known as thermal generalists. The Moorish gecko is a thermal generalist at night, when it is active rather than resting in its burrow. During the early morning the Moorish gecko basks in the sunlight and its skin darkens until almost black. At night the gecko is very pale.
Activity 2
What advantages do the changes in skin colour give?
Answer
Dark colours absorb and radiate heat better than light colours. At night a light colour should reduce heat loss by radiation, and there is not much heat available to absorb. During the day, dark skin promotes absorption of solar heat. Although radiation to the atmosphere by the dark skin is also promoted, the energy so lost is of little significance compared to the large amount of solar heat absorbed.
The advantage to the gecko of warming up in the morning is uncertain, but it is possible that a physiological process such as digestion of the food eaten during the night requires a higher T b than the gecko can maintain at night.
The ability of the gecko to vary skin colour shows that behavioural thermoregulation in reptiles is supplemented by physiological mechanisms, which we will explore further in Section 3.4.
Sheltering in the available shade in the desert, or being active at night, are simple strategies for keeping T b below lethal levels. In sandy desert areas, the sand itself plays an important role in behavioural thermoregulatory strategies. The Mojave fringe-toed lizard (Uma scoparia) (Figure 16) is restricted to fine, wind-blown sand, e.g. in dunes, dry lake beds and desert scrub in the Mojave desert. Burrows in sand collapse immediately or soon after the animal has moved on, so animals buried in sand rely on air trapped between sand particles for breathing. Uma is a ‘sand-swimmer’ and its dorsoventrally flattened body and shovel-shaped head facilitate movement through the sand, which is especially important when escaping from predators such as snakes and badgers.
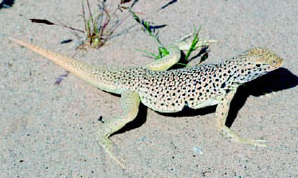
The eyelids are protected from sand by large eyelid fringe scales. The digits have large lamellar fringes, elongated scales, especially long on the hind feet, which enable the lizards to run at speed on the sand surface. Uma grows up to about 110 mm in length, and its activity pattern is diurnal, varying according to ambient temperature. In March and April Uma is active for short periods because of the low spring temperatures in the Mojave. In summer, from May to September, the lizards are active during mornings and late afternoons, feeding on insects and plants. Sand-swimming lizards are also found in the Namib desert and include the wedge-snouted sand lizard (Meroles cuneirostris).
The data in Figure 17 were collected from a sand dune slope in the Namib desert.
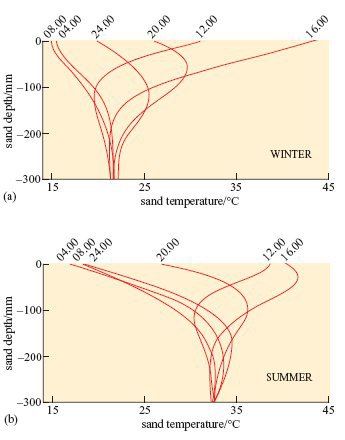
Although the temperatures of sand at various depths in the Mojave desert would not be precisely the same as those in the Namib, the physical characteristics and thermal environment provided by dry sand are broadly the same in all deserts at similar T a.
A benign temperature is available below the surface at all times of the day in both seasons, in spite of extremes on the surface. These surface temperature extremes are not very different in summer and winter. The high afternoon surface temperature in winter is due to hot, dry winds (Berg winds) that reach the desert in the winter months.
Activity 3
Examine the data in Figure 17 and suggest the advantages for a sand-swimming lizard of the following strategies:
The lizard ‘swims’ down to 60 mm depth at 12.00 hours in summer, when surface temperatures can reach 40°C or more.
In winter, the sand-swimmer remains in a state of dormancy for a month at 300 mm depth in the sand, when surface temperature can occasionally drop below freezing at night.
Answer
At 12.00 hours, when T a is 40°C at the surface, by burrowing to a depth of 60 mm the lizard reaches a microenvironment where T a is significantly lower, about 32°C (Figure 17b). The lizard loses body heat by conduction and thereby avoids a dangerous increase in body temperature.
In winter when ambient temperatures can drop to below freezing, the temperature at 300 mm depth remains constant at around 21°C (Figure 17a). The lizard thereby avoids low T a at the surface and is not at risk of freezing when T a drops to < 0°C.
Burrows provide important microenvironments for many desert evaders, and their structure and use vary between species. The desert tortoise (Xerobates agassizii; Figure 18) lives in deserts in the USA and Mexico, and feeds on annual herbs, cacti and shrubs, obtaining most of its water from the plants.
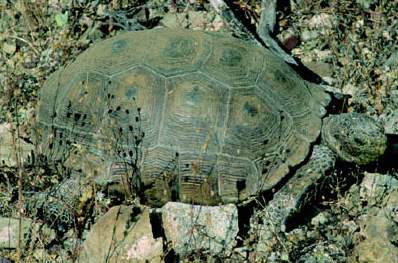
In the Mojave desert, the tortoises live in sandy areas as well as rocky hillsides, including scrub-type vegetation, joshua tree/yucca and creosote bush/ocatillo habitats. For the tortoises, burrows are important refuges for thermoregulation, summer aestivation and winter hibernation. Tortoise burrows in the Mojave desert are extensive and can be up to 12 m long; the same burrows are used for many generations, and are shared with other species such as burrowing owls and ground squirrels. Each desert tortoise may use up to 12 burrows in its home range and each burrow is used by different tortoises at different times. For short rest periods during the day tortoises dig shallow depressions, known as pallets, which barely cover the carapace.
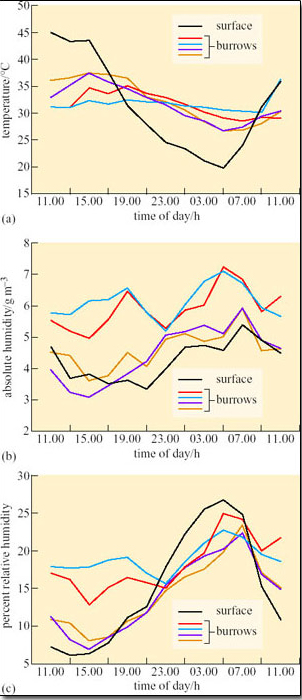
Susan Bulova (2002) compared temperature and humidity in four unoccupied desert tortoise burrows, and the surface over 24 hours on a summer day in the Mojave desert (Figure 19a–c).
Activity 4
Compare the fluctuations in T a (Figure 19a), in the burrows and on the surface.
Compare the fluctuations in absolute humidity (a.h.) and relative humidity (r.h.) (Figures 19b and c) in the burrows and on the surface.
Answer
T a inside each of the burrows fluctuated by about 2–10°C, ranging from about 27–37°C. Surface T a fluctuated from a low of 20°C at 05.00 h to 45°C at 11.00 h. Compared to surface T a, burrow T a remained relatively stable, being cooler than surface T a from 09.00 h–17.00 h and warmer than surface T a from 17.00 h–09.00 h.
Absolute humidity was generally lower on the surface than inside the burrows, but for two of the burrows measured a.h. values were always close to surface a.h. values. Relative humidity was higher in the burrow than on the surface from 09.00 h to 21.00 h but two of the burrows had r.h. values quite close to surface r.h. from 15.00 h to 23.00 h.
Bear in mind that when occupied by a tortoise, a burrow's relative humidity may rise to 40 per cent because of the tortoise's water loss by evaporation from the lungs, exposed skin and eyes. Stable T a and humidity in the burrow protect the tortoise from extremes of high T a and from winter frosts. Bulova noticed that tortoises are fussy about the burrow selected for resting. At the end of foraging, tortoises were observed to enter and leave several burrows before settling. Mojave desert tortoises are active between March and June, a time when the winter rains have stimulated the growth of annual plants, providing abundant food for the tortoises. The tortoises begin foraging during the morning but usually by noon they have moved into pallets and burrows to shelter from high T a. At night, burrows provide shelter from low T a and also protection from nocturnal predators such as kit foxes and badgers. By the end of June, when surface temperature may reach 60°C, and annual plants have dried up, the tortoises retreat to their deep burrows and aestivate, a behaviour that helps to conserve body water. During aestivation, up to a quarter of the tortoises' body mass may be water stored in the bladder. Occasionally an aestivating tortoise emerges to drink during summer thunderstorms. In the eastern Mojave desert tortoises are active for most of the summer because there, summer rainstorms provide sufficient new plant growth. For their winter hibernation, tortoises aggregate in the burrows; up to 25 individuals have been found in one burrow. Hibernation lasts from October to the end of February, and during this time T b of the tortoises is the same temperature as the burrow, around 5–16°C in winter. Note therefore that hibernation in the desert tortoise is not the same physiological process as it is in hibernating mammals . Reptiles do not regulate T b physiologically during hibernation; T b is the same as burrow T a. You will find that in some references, reptile ‘hibernation’ is termed ‘brumation’.
You may be surprised to learn that like desert ectotherms, small desert rodents also depend on burrows for thermoregulation. Merriam's kangaroo rat (Dipodomys merriami; Figure 20) is a typical evader, living in the Sonoran desert, Arizona, and in Death Valley, California, one of the hottest and driest areas in the Western Hemisphere.
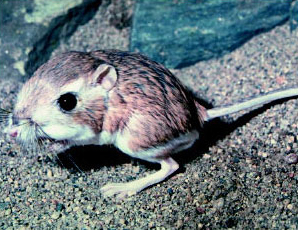
Individuals live in a maze of burrows, which they defend. They remain in their burrows during the day, and often plug the entrance with soil. At night kangaroo rats emerge from their burrows for just two hours to collect seeds, in particular seeds of the creosote bush, which they push into their cheek pouches, returning at intervals to empty the food into their burrow. In this way, food caches are built up; kangaroo rats always eat inside the burrow, drawing on their food cache. Inside the burrow, the air is cooler and more humid than above the ground, as moisture from respiratory water loss accumulates. Measurements made on similar burrows in the Negev desert, Israel, showed T a of around 26°C at 1 metre depth for 24 hours per day when ambient temperature above ground ranged from 16–44°C. However, not all small desert animals can burrow.
The desert wood rat (Neotoma lepida) lives in deserts in the southern USA, including Death Valley, California. Wood rats do not burrow but build elaborate houses around the base of cacti or shrubs, amongst a patch of agaves, or beneath a rock outcrop. Wood rat houses can reach huge sizes and their interior is significantly cooler, by about 5°C, than the outside during the heat of the day. Desert wood rats shelter in their houses during the day, and emerge to forage at night, eating creosote bush, cholla, prickly pear cactus and agave.
2.4 Behavioural strategies of evaporators
Willmer (2000) defines evaporators as animals that depend on sufficient water intake to enable them to cool T b by evaporation. Few of these species can survive in deserts, and those that do either live on the edges of deserts where they can access water, or have behavioural and physiological adaptations that reduce reliance on evaporative cooling. So for evaporators, evasion may be an important part of their thermoregulatory strategy. Evaporators include medium-sized mammals such as jack rabbits, dogs, foxes, and also desert birds such as larks.
The jack rabbit (Lepus californicus; Figure 21) is a hare, living in the Sonoran and Mojave deserts. Jack rabbits do not burrow, although they are quite small, weighing about 2 kg.
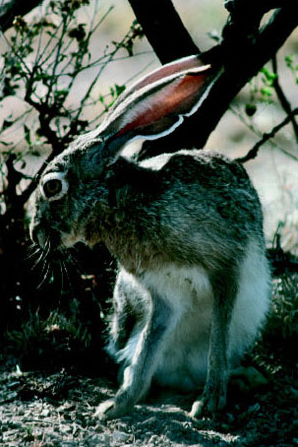
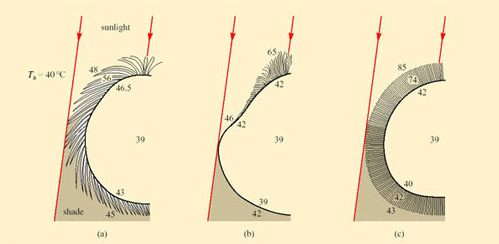
A jack rabbit would need to lose at least four per cent of its body mass per hour to thermoregulate by evaporation. There is little or no free water around; water is obtained from the diet, green plants, including cacti in the summer. Knut Schmidt-Nielsen's work (1967) showed that behaviour is important for the jack rabbit's survival. During the hottest part of the day the animal chooses a shaded depression in the ground, often in the lee of a bush, in which it crouches (Figure 22).
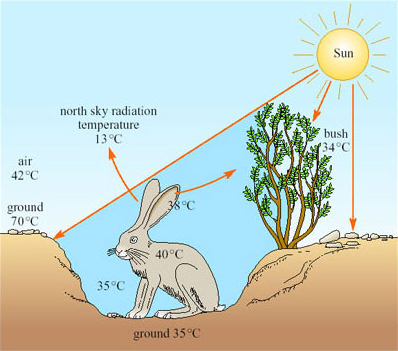
The bottom of such a depression has a much lower temperature than that of the rest of the surface, the hot desert wind and much of the radiation passing over the animal's head. From its sheltered position, the jack rabbit's large radiator-like ears can be exposed, not directly to the Sun, but to a clear blue sky. The radiation temperature of the north sky at midday is only 13°C so if the ears, which are richly vascularised, have a temperature of 38°C, and have a surface area of 400 cm2, are directed towards the sky, they can radiate about 13 kJ h−1, which is about half of the animal's metabolic heat production. The jack rabbit forages during the night.
The kit fox (Vulpes macrotis; Figure 23) lives in the Sonoran, Mojave and Great Basin deserts in southwestern USA. Kit foxes have very large ears, which are thought to provide an increased surface area for cooling the body.
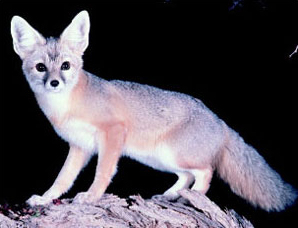
They are carnivores, and hunt at night, preying on kangaroo rats, tortoises and jack rabbits, and occasionally catching ground-nesting birds, reptiles and insects. They reduce evaporative water loss by spending the day in underground dens, emerging at sunset to begin hunting. The physiological importance of dens for desert foxes should not be underestimated. By remaining in the den during the day, a desert fox reduces drastically the need for panting, a mechanism used by foxes and dogs for cooling the body by evaporative water loss (Section 3.3).
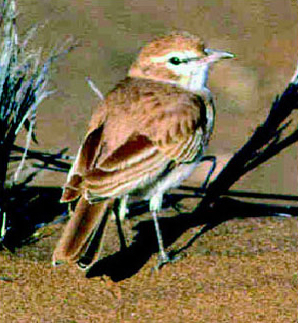
A few species of small birds live in the most extreme deserts. Dune larks (Mirafra erythroclamys; Figure 24) are the only birds that live year round in the Namib sand sea, one of the driest regions of the world. Dune larks feed on insects and spiders, which they collect during the day, while walking over the sand surface; they also peck insects from just below the sand surface. In winter the birds feed on seeds blown in from adjacent grass land. The scarcity of water in the Namib sand sea means that dune larks drink rarely and the birds rely on water in their food and on metabolic water. Birds do not sweat, but they use both cutaneous and respiratory evaporative water loss for cooling the body. During the hottest part of the day, from around 12.00 to 15.00 h, dune larks seek shade and stand still. Presumably this behaviour helps the birds to cool T b and reduces evaporative water loss.
Williams (2001) used taxidermic mounts to determine operative environmental temperature, T e , for the birds. T e is the temperature that an animal would reach in the environment if it was biologically inactive, i.e. only the physical characteristics of the animal are taken into account. It is defined, in physical terms, as the temperature of a black body of uniform temperature, in an identical situation to that which the animal occupies, with the same values for conduction, convection and radiation. As the definition is purely physical, it is possible to make models of animals and to use them to measure T e experimentally. Figure 25 shows three examples of daily profiles for a model of a dune lark made from a copper cast of a bird covered in plumage.
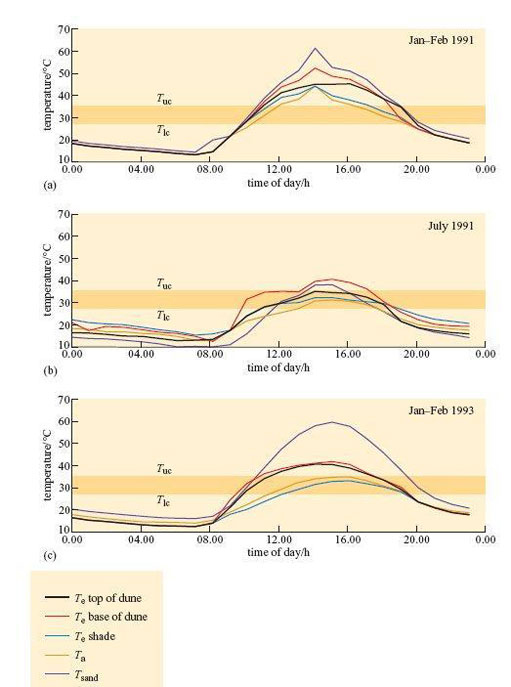
Figure 25b shows that during July 1991 (winter in Namibia) mean T e shade did not exceed T uc (35.1°C) for the larks. The results suggest that in winter, the strategy of finding a shady spot during the hottest part of the day lowers T b sufficiently, so there is no need for physiological cooling, in particular evaporative water loss, for maintaining T b.
Activity 5
Do the results shown in Figures 25a and c suggest that dune larks do not need to use evaporative cooling to maintain T b in the summer? What is the main advantage of resting in the shade for the dune lark? Identify one disadvantage.
Answer
Even in the summer, T e in shade is significantly lower than T e in sun. In Jan–Feb 1991, at midday, all mounts exposed to the sun reached a T e of 46–50°C, higher than T uc of 35.1°C. T e in the shade was significantly lower. In summer 1991, mounts exposed to full sun reached T e values of 40–50°C from about 12.00–20.00 h, whereas those in the shade peaked at 40–45°;C from about 12.00–16.00 h. In summer 1993, T e for mounts in the shade never exceeded T uc. For the dune lark, the simple strategy of standing in shade during the heat of the day provides significant cooling, even in a particularly hot summer like that of 1991. It is likely that by standing in shade, the need for evaporative cooling must be reduced at least.
However, the disadvantage of this strategy is that while standing in the shade, dune larks cannot forage, so the bird has to find a balance between the need for food and the necessity of avoiding excessively high T b.
While desert animals classed as ‘evaporators’ could use evaporative cooling for maintaining T b at high T a, the need for this is avoided by simple behavioural strategies. Nocturnal foraging and daytime use of dens, burrows and shade for cooling reduce the need for physiological cooling by evaporative water loss, thereby conserving water.
2.5 Behavioural strategies of endurers
Endurers are defined as large desert mammals such as oryx and camel, and large desert birds, ostrich and emu. The term ‘endurers’ suggests that these animals are forced to endure the extreme conditions of the desert climate because they cannot shelter from high T a and intense solar radiation during the day or low T a at night, as they are too large to hide in burrows or dens. Nevertheless, in spite of their size, endurers do take advantage of aspects of the environment for cooling by means of behavioural strategies. Large mammals tend to be inactive during the hottest part of the day, thereby reducing metabolic heat production. The Arabian oryx (Oryx leucoryx; Figure 5 in Section 1.1) lives in the Arabian desert, including areas where free-standing water is rarely if ever available. On hot days oryx dig into the sand with their hooves, exposing the cool sand below the surface, and sit in the depressions. Body heat is lost to the cooler sand by conduction. Where possible, the oryx also spends time sitting in the shade of evergreen trees (Maerua crassifolia) during the hottest part of the day. Oryx forage at night during the summer, avoiding exposure to high T a and intense solar radiation. They feed on grasses and rely on the water content of the plants for their intake of water.
Dorcas gazelle (Gazella dorcas; Figure 4 in Section 1.1) live at the borders of the Sahara desert and are the smallest species of gazelle, weighing just 15–20 kg. They have very long limbs in proportion to their body size, and large ears: both features maximise any convective cooling caused by breezes. Dorcas are described as the most desert-adapted of all gazelles, as like the oryx, they are reputed to be able to survive without drinking any water at all. Their feet are splayed, an adaptation for walking and running on sand. Dorcas gazelle graze and browse at night and at dawn and dusk, feeding on leaves, flowers and pods of acacia trees, and using their hooves to dig for bulbs.
Long limbs, tails or necks provide large surface areas from which heat can be dissipated, and behaviour patterns may maximise loss of heat from these areas. The ostrich (Struthio camelus) is the largest living bird, weighing up to 150 kg. Ostriches forage during the day. The birds select plants with high water content when grazing, especially during times of water shortage. The naked neck of the ostrich and its long naked legs provide a large surface area for convective and radiative cooling, especially in breezy conditions. The ostrich uses behaviour to enhance the cooling effects of feather erection at a high ambient temperature and incident solar radiation. Sparsely distributed long feathers on the dorsal surface of the bird erect in response to warming of the skin, thereby increasing the thickness of the insulation between solar radiation and skin. The gaps between the feathers allow through air movements, which cool the skin by convection. The birds supplement the physiological response during the hottest part of the day by orientating themselves towards the Sun and bowing out their wings away from the thorax, forming an ‘umbrella’ which shades the exposed thorax. The naked skin of the thorax acts as a surface for heat loss by both radiation and convection. At night when ambient temperatures plummet, ostriches conserve heat by folding the wings close to the thorax and tucking the naked legs under the body while they sit on the ground. The dorsal feathers respond to low T a by flattening and interlocking, which traps an insulating layer of air next to the skin, and keeps most of the skin at 34.5°C.
Evaporative water loss is the most effective means of reducing body temperature during heat stress. However, in deserts, very little, if any, free-standing water is available. For all groups of desert vertebrates, behavioural strategies for maintaining T b play a crucial role in preventing overheating of the body, which reduces the need for evaporative cooling and thereby conserves water. In the following section, we will see how in desert vertebrates, behavioural strategies for controlling body temperature are integrated closely with biochemical and physiological mechanisms.
2.5.1 Summary of Section 2
Desert animals are classified in terms of their body size and physiology into three groups: evaders, evaporators and endurers. The logic for this classification is that the smaller the animal, the larger its surface area to volume ratio. Small animals therefore gain and lose heat faster than large animals, warming rapidly when exposed to intense solar radiation, and cooling rapidly at night. Small endothermic evaders, e.g. kangaroo rats, rest in cool microenvironments, e.g. shade or burrows, during the day. Lizards, ectothermic evaders, regulate T b during the day by shuttling between sun and shelter. They avoid night-time hypothermia by resting in burrows. Nocturnal evaporators, e.g. kit foxes, remain in cool dens during the day. Some endurers, large species such as the oryx, graze nocturnally in summer, sitting in shade during the day. Behavioural strategies for avoiding intense solar radiation link intimately to physiology. Such behaviour prevents large fluctuations in T b and conserves water by removing the need for evaporative cooling, which is of crucial importance in deserts where water is scarce.
3 Integrating across levels of analysis
3.1 Introduction
In mammals and birds, homeostasis, the provision of a stable internal environment, includes keeping certain physiological variables, T b, cellular and extracellular water and blood glucose at near constant levels. T b of reptiles varies with T a, but reptiles can only function over a limited range of T b. Nevertheless, vertebrate species live successfully in deserts, which are arid, have low productivity and extremes of T a. Our approach to understanding animals’ physiological responses and genotypic adaptations linked to environmental features of deserts is study and integration of different levels of analysis, covering behaviour, anatomy, physiology and biochemistry. Grouping desert animals into evaders, evaporators and endurers is useful for our purpose. We describe just a few examples here, but the principles identified can help in interpreting data derived from other species.
3.2 Integration of anatomy and behaviour with biochemical and physiological strategies in evaders
We know from Section 2.3 that small desert rodents remain cool by staying in their burrows for all or part of the day. Kangaroo rats (Dipodomys spp.; see Figure 20 in Section 2.3) depend on metabolic water as there is little or no water available in their diet of seeds. Kangaroo rats appear to be ill-adapted for life in a desert; like other rodents they neither sweat nor pant. Nevertheless, inside the burrow, they could lose water by evaporation from the lungs, which would be enhanced by T b being higher than burrow T a. As the water-carrying capacity of air increases with temperature, warm expired air contains more water than the cooler inhaled air.
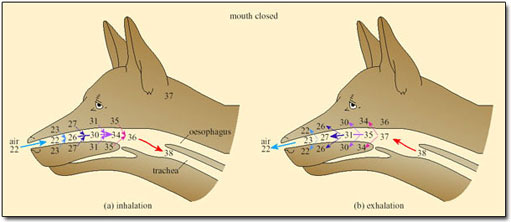
However, the temperature of the exhaled air in kangaroo rats is lower than that of T b, and often close to T a (Figure 26). This is because the nasal passages (turbinates) of kangaroo rats are extremely narrow and convoluted and provide a temporal counter-current cooling system, which operates as a heat exchanger (Figure 27).
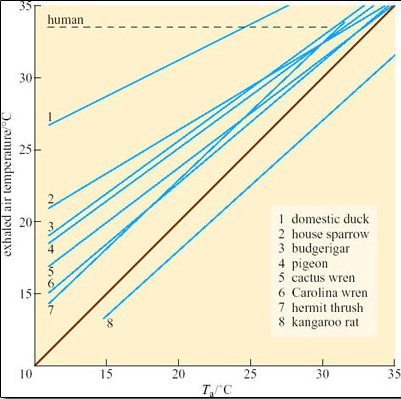
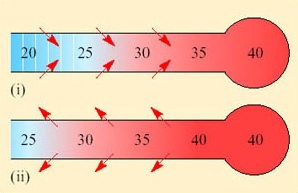
Both inspired and expired air pass over the same surface, the nasal mucosa. Air entering the nasal passages takes up both heat and moisture from the mucosa and is therefore both warmed and moistened before entering the lungs. In the short interval between inhalation and exhalation, the thermal gradient between nose and trachea is maintained. When air is exhaled from the lungs, initially its temperature is 37–38°C and it is humidified by heat and moisture derived from the warm tissues in the nasal passages, trachea and bronchi. As the exhaled air approaches the nasal passages, the temperature and vapour pressure gradients between the mucosa and the adjacent air are reversed and heat is lost from air to the mucosa. During cooling, water condenses on the mucosal surfaces. At the tip of the nose, the air is expired at ambient temperature, still saturated with water vapour, but because its temperature is reduced, it carries much less water. The efficiency of the heat and water exchanger reflects the large surface area to bore ratio of the nasal passages of a small animal like the kangaroo rat. When the kangaroo rat breathes air at 25 per cent relative humidity, the temperature of the expired air ranges from 31°C at T a 35°C to 13°C at T a 15°C. About 54 per cent of the water vapour derived from evaporation from the respiratory surfaces is thereby conserved at 30°C and 83 per cent at 15° C. In contrast, humans, with short wide nasal passages, cannot recover more than 16 per cent water vapour at T a ranging from 12 to 35°C.
The following material gives some important background on kidney function and to appreciate this you need to revise the concept of osmosis. Osmosis is the movement of water between two solutions which have different solute concentrations, and which are separated by a semi-permeable membrane. Water will move from the side that has lower solute concentration to the side that has the higher solute concentration. Osmolarity is an expression of the osmotic concentration of the solution. You may find texts where solutions with a high osmolarity are referred to as having a high osmotic pressure. You can think of this in terms of the pressure that would have to be applied to the solution on the side with a high solute concentration to prevent the movement of water by osmosis. The greater the solute concentration, the greater the pressure needed to prevent osmosis.
Kangaroo rats and other desert rodents, e.g. the Australian hopping mouse Notomys, conserve water by producing extremely hyperosmotic urine, on average 5500 mOsmol l−1 in Dipodomys and 9000 mOsmol l−1 in Notomys. Compare the osmolarity of the urine of Dipodomys with that of other mammalian species (Table 3), and note how small xeric mammals produce more highly concentrated urine than do species living in mesic habitats. Note also that large mammals living in xeric habitats, e.g. camels, do not produce urine as concentrated as that produced by small xeric mammals. Values for the net ratios of osmolarity for urine and plasma (U/P ratios) are provided to demonstrate the concentration of urine relative to that of the blood. Osmolarity is the concentration of solute particles, not the concentration of moles, although the two are related. For example, a solution containing 1 mol I−1 sodium chloride has an osmolarity of 2 Osmol I−1, because in solution, sodium chloride molecules break down into equal numbers of sodium and chloride ions. In contrast, molarity and osmolarity for a glucose solution are the same because glucose molecules remain intact in solution.
The ability of the kangaroo rat and other desert rodents to produce a hyper-concentrated urine is attributed to their possession of extremely long loops of Henle, which is often quoted as an extreme adaptation for life in parched deserts. But is the ability to produce a concentrated urine an ‘extreme adaptation’? Mammalian kidneys are effector organs that maintain the concentration of salts and excretory products, especially urea, in the blood within very narrow limits.
| Mammal | Habitat | Urine concentration/mOsmol I−1 | U/P ratio |
|---|---|---|---|
| Small mammals | |||
| rat | mesic | 2900 | 9 |
| domestic cat | mesic | 3100 | 10 |
| kangaroo rat | xeric | 5500 | 16 |
| Large mammals | |||
| beaver | freshwater/land | 520 | 1.7 |
| human | mesic | 1400 | 4–5 |
| porpoise | marine | 1800 | 5 |
| eland | xeric | 1880 | 6 |
| camel | xeric | 2800 | 8 |
The mammalian kidney is a compact organ consisting of an outer dark cortex and an inner pale medulla (Figure 28). The kidney tissue is made up of nephrons, which are thin-walled tubules (not to scale in this figure). The nephrons are concentrated in areas known as pyramids. Ducts that collect the urine and transfer it to the ureter are located in the papilla areas.
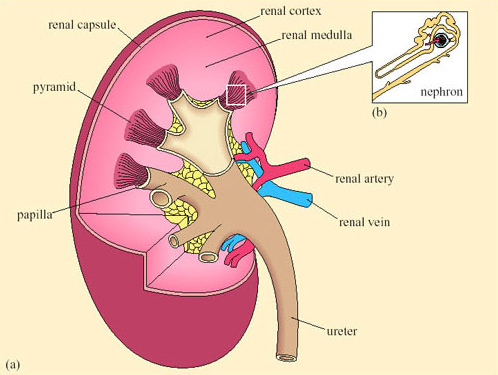
Each nephron begins with a cup-shaped structure, the Bowman's capsule. This encloses the glomerulus, a cluster of capillaries. (The Bowman's capsule and the glomerulus together are sometimes referred to as the Malpighian body.) Bowman's capsule opens into the coiled proximal convoluted tubule, which leads to the loop of Henle (Figure 29). There are two types of nephron, distinguished by the length of their loops of Henle.
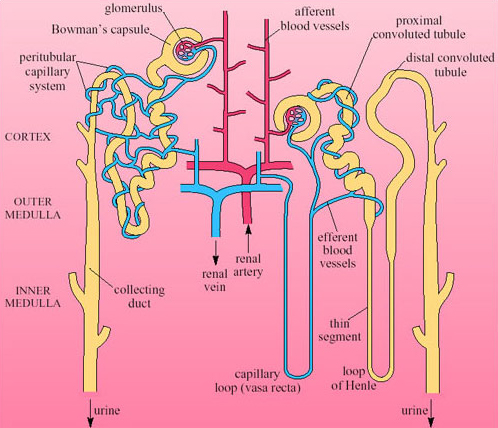
Cortical nephrons have short-reach loops that just penetrate the boundary between the inner and outer zones of the medulla. Juxtamedullary nephrons have long-reach loops that penetrate deep into the medulla. In humans about 15 per cent of nephrons are juxtamedullary and 85 per cent are cortical. Blood reaching the Bowman's capsule undergoes ultrafiltration. The blood pressure in the glomerular capillaries is high, and it is maintained by the pumping of the heart and the mechanical properties of the blood vessels. Consequently blood in the glomerulus is filtered through the basement membrane of the capsule. Blood cells and proteins remain in the blood, so that the filtrate that enters the nephron tubule has a similar composition to plasma minus its proteins and large lipids. Osmolarity of plasma and filtrate are the same, 300 mOsmol l−1.
As the filtrate travels through the nephron its composition undergoes considerable modification. The movements of sodium, chloride and water are summarised in Figure 30.
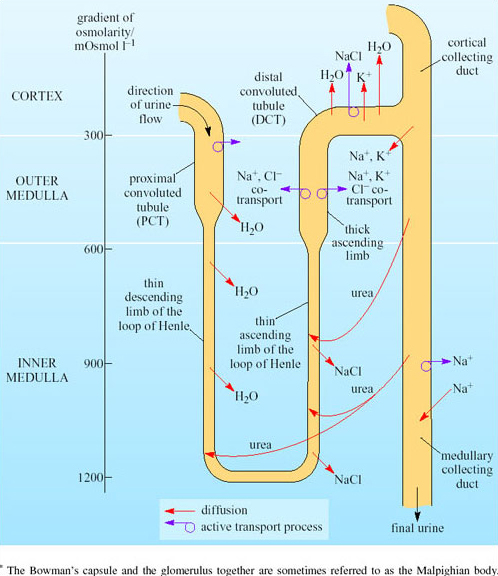
The values on the left in Figure 30 are the osmolarity of the interstitial tissue. You can see a gradient of osmolarity from 300 mOsmol l−1 in the cortex to 1200 mOsmol l−1 in the inner medulla. The fluid in the loop of Henle has about the same osmolarity as the fluids in the surrounding tissue. Movements from the tubules of Na+, K+, Cl−, urea and water occur as shown. Relatively small amounts of salt moving from the ascending limb to the interstitial tissues will cause osmotic movement of water out of the descending limb. Due to the principles of counter-current multiplication, a small difference in the concentration between adjacent points on the two limbs leads to a large difference in concentration between the top and bottom of the loop. Since the collecting tubule is very permeable to urea, urea moves into the interstitial tissues. This will increase the osmolarity in the medulla. The thin ascending limb has some permeability for urea so you can view the collecting duct and ascending limb as ‘recycling’ urea. As urea is moving through the medulla, this increases the osmolarity in this region of the kidney.
The process begins in the proximal convoluted tubule (PCT), where the epithelial cells absorb much of the filtrate passing it back into the blood flowing in the surrounding vessels. Active transport of sodium out of the PCT epithelial cells into the interstitial tissues increases the osmolarity in the tissue. Thus water moves by osmosis out of the PCT. Movement of glucose, amino acids and water is coupled to movement of Na+ out of the tubules. The water permeability of the PCT is high because of the abundance of special membrane channel proteins, aquaporins, in the cell membrane. Permeability of PCT epithelial cells is relatively low for urea, so the 75 per cent reduction in fluid volume in the PCT results in a four-fold increase in urea concentration.
The counter-current system of loop of Henle concentrates the urine. Figure 30 shows that the hairpin-like loop of Henle lies between the proximal convoluted tubule and the distal convoluted tubule. Fluid entering the loop flows down the descending limb and then turns the corner, before flowing up the ascending limb. The loop of Henle functions as a counter-current multiplier system as a result of the opposing direction of fluid flow in the descending and ascending limbs. Although the filtered liquid flows into the descending limb of the loop of Henle first, we need to look at processes in the ascending limb so that we can understand what happens in the descending limb. In the ascending limb, sodium and chloride ions are reabsorbed into the medullary interstitial tissues, passively in the lower part of the limb and actively by means of Na+-K+ ATPase pumps in the thick upper part of the ascending limb. The active transport of Na+ out of the tubule cells creates low [Na+] and [Cl−] in the cell cytoplasm; this creates a concentration gradient drawing in Na+ and Cl− ions from the lumen of the tubule into the tubule epithelial cells via luminal membrane transport molecules in the upper part of the limb. Unlike the descending limb, the ascending limb is relatively impermeable to water, so little water follows the salt. The interstitial fluid of the medulla thereby becomes hyperosmotic compared with the fluid in the ascending limb. The apical membranes of the epithelial cells lining the descending loop of Henle have a very low permeability to ions and urea but a very high permeability to water. Water therefore diffuses out of the fluid in the tubule and into the epithelial cells and then into the interstitial fluid. Water diffuses out of the descending limb into the more concentrated interstitial fluid until the osmolarity between ascending and descending limbs is equal. As the ascending limb is continually pumping sodium and chloride ions, the concentration difference between it and the interstitial fluid is maintained. The osmolarity difference of 200 mOsmol l−1 is multiplied to 1400 mOsmol l−1 at the bend in the loop.
When the fluid reaches the distal convoluted tubule (DCT) its osmolarity has become reduced to just 100 mOsmol l−1. The fluid is diluted further in the DCT, where active transport in the epithelium removes more sodium and chloride from the tubular fluid into the epithelial cells. As the epithelial cell membranes are impermeable to water, the tubular fluid is hypo-osmotic by the time it reaches the cortical collecting duct.
As in the PCT, basal and apical membranes of the epithelial cells of the collecting ducts have aquaporins. Normally, these membrane channel proteins are configured to limit water reabsorption. If the blood osmolarity rises, antidiuretic hormone (ADH) is released from the posterior pituitary. This hormone acts directly on the aquaporins in the collecting duct epithelia so that the membrane channels are fully ‘opened’ and water moves by osmosis out into the interstitial tissues. This reduces the urine flow. If the blood osmolarity decreases, secretion of ADH stops and the membrane channels close, so water is retained in the collecting ducts. The blood vessels in the medulla, the vasa recta, are arranged as hairpin loops that run close to and parallel to the loops of Henle and collecting ducts. Water reabsorbed from the collecting ducts enters the blood capillaries and leaves the kidneys in venous blood, which maintains the concentration gradients in the medulla. As water is reabsorbed along the entire lengths of the medullary collecting ducts, fluid emerging from the medullary collecting ducts has the same osmolarity as the interstitial fluid around the bend of the loop of Henle at the bottom of the medulla. The longer the loop of Henle relative to the overall depth of the cortex, the higher is the osmolarity of the fluid in the bend. The kidney thereby retains as much water as possible, minimising loss of water during water shortage.
The relationship between the ability to concentrate urine and the length of the loops of Henle is not straightforward. There is no clear relationship between actual loop lengths and urine concentration in mammals. Average lengths of loops of Henle are not directly proportional to urine concentration when comparing large with small species of mammals. Notomys has a loop length of 5.2 mm and produces urine of up to 9000 mOsmol l−1 in contrast to the horse with a loop length of 36 mm producing urine of 1900 mOsmol l−1. How can we explain this data in relation to the hypothesis that the length of the loop of Henle does affect final urine concentration?
Small mammals have much higher mass-specific metabolic rates than large mammals. Compared with large mammals, the apical membranes in the kidney tubules of small mammal epithelial cells have more infoldings, increasing surface area for absorption.
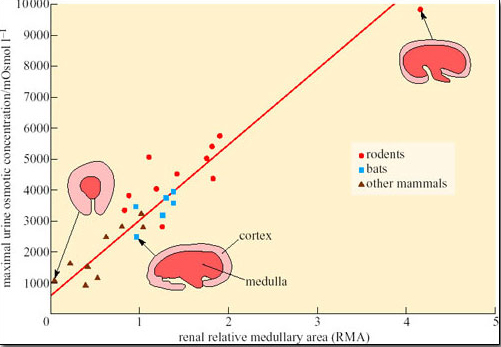
Increased metabolism will lead to more waste products and a greater demand on the filtration capacity of the kidneys. Therefore the number of nephrons must increase as body size increases, which in turn increases the relative amount of cortex (the area of the kidney where most of the nephron is located), at the expense of the medulla. The relative thickness of the medulla is related to urine-concentrating ability because the medulla contains the loops of Henle. Hence larger animals, even the camel, cannot produce urine as concentrated as that of smaller mammals, because their kidney medulla is relatively small compared with its cortex. Small mammals such as rodents and bats tend to have relatively thicker medullas than larger mammals, which can be correlated with their production of concentrated urine (Figure 31).
Activity 6
What conclusions could you draw from the data shown in Figure 31?
Answer
Rodents generally have kidneys with a larger medullary area and produce more concentrated urine than bats and other mammals.
The thicker medulla of small desert rodents could therefore be viewed as a desert adaptation superimposed on a basic body-size-dependent pattern. Most loops of Henle in desert rodents are of the juxtamedullary type, and the epithelial cells have densely packed mitochondria with more cristae per unit volume than a horse's loop of Henle.
Activity 7
What is the significance of the greater concentration of mitochondria and more cristae per unit volume of mitochondria in the epithelial cells of loops of Henle in desert rodents compared with those of the horse?
Answer
The greater numbers of mitochondria and cristae in epithelial cells of the loops of Henle of desert rodents suggest a higher capacity for ATP synthesis and therefore active transport of Na+ and Cl− ions in the kidney of desert rodents.
Conservation of water by the kidney is of crucial importance for the kangaroo rat, which does not drink and can obtain water only from catabolism.
Other desert rodents obtain water from their diet. The degu (Octodon degus), found in Northern Chile, lives in semi-arid desert country, known as matorral, which is characterised by evergreen scrub plants. Degus survive on limited amounts of water obtained primarily from their food, which comprises scrub foliage, grass and seeds. There is seasonal variation in the water content of plants; in summer the plant foliage dries out and contains just 3–6 per cent water; in winter, foliage contains 70–80 per cent water. Bozinovic et al. (2003) studied the phenotypic flexibility of water flux rate in Octodon degus. Water intake and efflux were measured by use of the doubly-labelled water technique in degus kept in a secure enclosure within the matorral. Urine osmolality was measured in wild-captured degus using microhaematocrit capillary tubes to obtain samples from the urethra. (Note: whereas osmolarity measures the number of osmotically active particles of a particular substance in a volume of fluid, osmolality measures the equivalent number in a mass weight of fluid. For most biological systems the molarity and molality of a solution are nearly exactly equal. For our purposes osmolarity and osmolality can be regarded as equivalent.)
| Measurement | Winter (June–August) | Summer (Dec–March) |
|---|---|---|
| Mean rainfall/mm | 245 | 12 |
| Body mass/g | 119.7 | 124.8 |
| Water intake/ml day−1 | 40.4 ± 91* | 10.3 ± 2.3 |
| Urine osmolality/mOsmol kg−1 | 1123 ± 472* | 3137 ± 472 |
Activity 8
Drawing on the data provided in Table 4, summarise the physiological strategy for water economy in the degu.
Answer
In winter when water content of plants is 70–80 per cent, the rate of water intake is relatively high at 40.4 ml day−1. Urine osmolality is correspondingly low at 1123 mOsmol kg−1. In contrast, in the summer the rate of water intake is relatively low at 10.3 ml day−1 and the degus produce a more concentrated urine, with an osmolality at 3137 mOsmol kg−1. The kidney is able to concentrate urine, thereby reducing water loss in the summer when the diet provides very little water.
Bozinovic et al. interpret the ability of the kidney of the degu to concentrate urine to 3137 mOsmol kg−1 as an example of phenotypic flexibility in the degu, in response to a lack of water during the summer. Variation in the osmolality of urine is not in itself unusual. After drinking a large volume of water, humans produce a dilute urine; the average osmolality in water-loaded volunteers has been measured at 101 mOsmol kg−1. Following 20 hours of dehydration, urine osmolality in the volunteers increased to 1004 mOsmol kg−1. Such responses result from the physiological regulation of body water content. Recall that the permeability of the epithelium of cortical and medullary collecting ducts is controlled by the hormone ADH (antidiuretic hormone, also known as vasopressin). (Figure 39 in Section 3.4 shows the feedback control of secretion of ADH, which results in the regulation of body fluid volume.)
3.3 Integration of anatomical features and biochemical and physiological strategies in evaporators
Birds and larger desert mammals that use evaporative cooling risk dehydration because of the difficulty of finding sufficient drinking water. For mammals, evaporative heat loss includes panting and sweating.
In small mammals and birds the temperature of exhaled air is often lower than T b, resulting in condensation of water on the nasal mucosa. Small desert mammals rely on this mechanism for water conservation, while resting in their cool burrows during the heat of the day. However, for mammals and birds exposed to high T a, the nasal counter-current heat exchanger minimises water loss, and so works against the need to increase heat loss by evaporation of water (Figure 32).
Only when T a approaches T b and the temperature of the inspired air reaches that of the body core, is the heat exchanger abolished. Even then, and for dry air, only about 12 per cent of metabolic heat is dissipated at T b of 38°C. As humidity increases, the proportion of metabolic heat dissipated declines.
Increasing the rate of ventilation of the nasal mucosa increases the rate of evaporation, but risks over-ventilating the lungs and blowing out too much carbon dioxide.
In dogs, foxes and other species that pant, evaporative cooling is promoted by opening the mouth; a simple mechanical device further increases the effectiveness of cooling by respiratory water loss. A valve at the back of the throat, driven by breathing movements, directs a large proportion of the air that was inhaled through the nose out through the mouth, thereby bypassing the nasal heat exchanger (Figure 33).
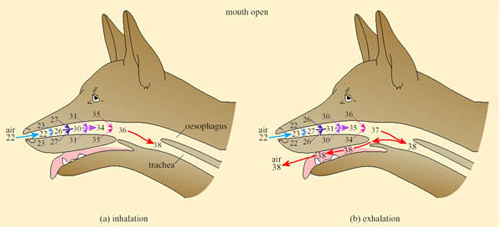
This mechanism can be used to modulate the rate of evaporative heat loss without affecting the respiratory frequency or volume and is exploited to the full during thermal panting under most heat loads.
During severe heat stress, breathing changes to a slower deeper second-phase panting, in which air passes out through nose and mouth. The dog's tongue is richly vascularised and the rate of blood flow increases with a rise in body temperature. Exposure of the buccal area means that there is no significant heat exchange in the mouth (unlike that shown in Figure 32) so the rate of evaporation is maximised during second-stage panting. Second-stage panting normally occurs in the dog during exercise, when both enhanced cooling and increased gaseous exchange in the lungs are required.
Panting is an important cooling mechanism for foxes and dogs that chase prey. The fennec fox (Fenecus zerda), a species found in the Sahara desert, is reputed to pant at 690 times per minute after chasing prey. Kit foxes reduce the need for panting by staying in dens during the day and hunting at night, or at dawn and dusk (Section 2.4). Rüppell's foxes (Vulpes rueppelli; Figure 34) live in the Rub' al-Khali of Arabia, the largest existing sand sea, which is an extremely arid desert with no permanent sources of drinking water.
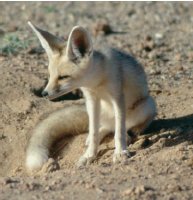
Rüppell's foxes do not drink, but obtain all their pre-formed water from their food, supplemented by metabolic water production. By avoiding the need for panting during the day, Rüppell's foxes might be expected to have a reduced total evaporative water loss (TEWL) in comparison to fox species living in mesic habitats. Resting in a den during the day would reduce TEWL, but Rüppell's foxes would have to travel long distances at night while hunting prey, mainly rodents, birds and arthropods which would increase the need for evaporative cooling. Williams et al. (2002) measured TEWL of individual foxes in a specially designed metabolic chamber. Field water flux (the water flux under natural conditions in the field) was determined in individual foxes using the doubly-labelled water technique. The mean whole body TEWL for six foxes at 35°C at their basal metabolic rate was measured as 50.1 g water day−1. This value is about 55 per cent lower than expected from comparisons with other mammalian species of similar body mass. The researchers suggest that Rüppell's foxes are particularly efficient at reducing either cutaneous or respiratory water loss. Mean field water flux (FWF) per day in the six foxes was 123 ml day−1 with 26.1 ml water day−1 provided from catabolism.
Comparison of mass-adjusted values for water flux in Rüppell's foxes with values obtained for swift foxes living in grass prairie where water is more readily available, showed that water flux is 34 per cent greater in this mesic species. However, care is needed when making such comparisons between just two species, as we shall see in Section 4. The water flux of Rüppell's foxes is about 30 per cent less than that predicted by physiologists for a desert mammalian carnivore; the prediction assumed that desert carnivores would have higher rates of water flux than mesic species because of their higher rates of TEWL. It is tempting to suggest that the nocturnal habits of Rüppell's fox with consequent reduction in TEWL account for the low TEWL in this species.
Because birds of all sizes tolerate hot arid conditions, physiologists considered that desert birds, being diurnal animals exposed to extremes of ambient temperature and aridity in deserts, are successful because of their avian physiology, not because of specific adaptations. For example, as the normal range of core body temperature in birds (41–42°C) is higher than that in mammals, the need for evaporative cooling may not be as great as that in mammals. Because birds are uricotelic, that is, they excrete uric acid rather than urea, relatively little water is required for the excretion of nitrogenous waste. Uric acid is excreted as a paste, with a very low water content. It is relevant to note that carnivores, which have a high protein diet, produce relatively large quantities of urea as a waste product. This urea increases the osmolarity in the kidney and helps reduce water loss via the urine.
However, recent work suggests that specific adaptations for life in hot and dry desert climates may have evolved in desert birds. Tieleman and Williams (2000) compiled available values for basal metabolic rate (BMR), field metabolic rate (FMR) and field water flux (FWF), for 21 small bird species living in Old World deserts, and compared these data with the equivalent values for 61 species living in mesic habitats with higher rainfall and denser vegetation cover. The desert species included desert larks, sparrows and finches; the mesic species included owls, finches and sparrows, so there was a wide spread of groups. Two different methods of analysis were used, one for simple comparisons between the two groups, and the other based on phylogenetic contrasts involving the inclusion of phylogenetic relationships in the analysis. Significant differences in BMR and FMR between desert and mesic birds support evolution of reduced BMR and FMR in desert species. Low BMR and FMR might be expected to be an advantage for desert birds because of the associated lower energy demand, and lower release of metabolic heat, and hence lower TEWL, required for dissipating metabolic heat at high T a. Low FMR values can be linked to the habit in many desert species of resting in the shade or in burrows during the hottest part of the day (recall dune larks from Section 2.4). Values for FWF were significantly reduced in desert birds in comparison to mesic birds, but the difference was not related significantly to phylogeny.
Desert birds use panting for cooling, thereby incurring increased evaporative water loss. Female dune larks incubating their eggs pant during midday to regulate their own body temperature and hence that in their eggs. Desert grouse (Pterocles spp.), use gular flutter, a rapid vibration of the floor of the mouth that provides rapid evaporative heat loss with up to 2°C cooling in the mouth. Pterocles spp. can afford to lose water in this way, as these birds fly long distances every day to drink water from pools. Other birds such as desert larks do not show this behaviour and they may rely entirely on water obtained from their food, so they could not afford to lose so much water by evaporation.
Caution is advisable when using interspecific comparisons to support the view that physiological traits are adaptations. Physiological traits measured in species at different times of year or in different areas may vary, not because of genetic differences, but because of acclimatisation. A study of phenotypic flexibility of BMR and TEWL in 12 hoopoe larks (Alaemon alaudipes; Figure 35), captured from the Arabian desert provides a salutary example.
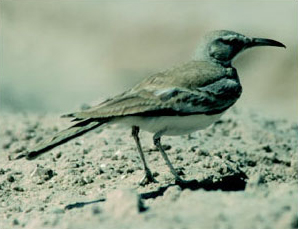
Two groups of six wild-captured larks were kept respectively at ambient temperatures of 15°C and 36°C, fed ad libitum and exposed to 12-hour day and 12-hour night regimes. After 3 weeks of acclimation, each bird was placed in a metabolic chamber at 35°C, a temperature within the thermoneutral range for the hoopoe lark. BMR was measured as the basal rate of oxygen consumption, and TEWL determined from water content of air expired from the chamber. The results are summarised in Table 5.
Initially there was no significant difference (P> 0.25) in the mean body mass of the two groups of larks. After 3 weeks of acclimation, mean body mass of the group acclimated at 15°C was significantly higher than that of the group acclimated at 36°C (P< 0.04).
| T a for acclimation | Body mass pre-acclimation/g | Body mass post-acclimation/g | BMR/kJ day−1 | BMR/kJ day−1 g−1* | TEWL at 35° C/g H2O day−1 | TEWL at 25° C/g H2O day−1 |
|---|---|---|---|---|---|---|
| 15°C | 41.3 ± 7.0 | 44.1 ± 6.5 | 46.8 ± 6.9 | 3.55 ± 0.60 | 3.11 ± 0.4 | |
| 36°C | 37.2 ± 4.7 | 36.6 ± 3.6 | 32.9 ± 6.3 | 2.23 ± 0.28 | 2.17 ± 0.7 | |
| P for difference between means | > 0.25 | < 0.04 | < 0.03 | < 0.003 | < 0.008 |
Activity 9
Compare the mean values for whole body BMR in the two acclimated groups of larks.
Answer
Larks acclimated at 15°C had a greater mean BMR, 46.8 kJ day−1, than the mean BMR, 32.9 kJ day−1, measured for birds acclimated at 36°C. The increase in BMR is statistically significant (P< 0.03).
The BMR of hoopoe larks acclimated to T a = 15°C approaches that reported for a temperate species, the woodlark (Lullula arborea): 49.4 kJ day−1.
Activity 10
You may argue that BMR expressed as kJ day−1 g−1 is likely to be the same for the two groups of hoopoe larks because body mass for the 36°C group is greater than that of the cold-acclimated group. Note down the values for BMR as kJ day−1 g−1 (see the empty column in the table) and state whether the BMR expressed per gram is still lower in the warm-acclimated larks.
Answer
Mean BMR value, 0.89, for the 36°C group is still lower when expressed as kJ day−1 g−1 than the equivalent mean value for the 15°C group, 1.06 kJ day−1 g−1.
Activity 11
Compare the mean values for TEWL in the two acclimated groups of larks.
Answer
Larks acclimated at 15°C had a greater mean TEWL at 35° C, 3.55 g day−1, than the mean TEWL 2.23 g day−1, measured for birds acclimated at 36°C. The increase in TEWL is statistically significant (P< 0.003). Similar results were obtained for TEWL measured at T a = 25°C.
Those larks acclimated to 15°C had significantly larger liver, kidney and intestine than larks in the 36°C group. Birds in the 15°C group consumed about 420 g food per day, more than three times as much as the 120 g food per day eaten by the birds kept at 36°C. The overall picture is that the hoopoe lark has high phenotypic flexibility, an advantageous feature for an animal living in a very variable environment. The environment of the Arabian desert has long periods of drought with scarce food resources available but unpredictable periods of rain temporarily increase food supply. The ability to minimise energy expenditure and requirement for water is important for survival of the birds. You may argue that the reduction in TEWL at 36°C derives from a lower BMR and therefore reduced respiratory evaporative water loss (REWL). Williams and Tieleman (2000) determined that REWL accounts for 31.7 per cent of TEWL at 35°C with cutaneous evaporative water loss (CEWL) accounting for the remaining 68.3 per cent. If it is assumed that the increase of 42.2 per cent in BMR in 15°C-acclimated birds results in an equal increase in REWL but no increase in CEWL, then TEWL would have increased by 13.4 per cent. The finding that TEWL increased by 59.2 per cent in the birds in the cold-exposure group indicates that they altered the permeability of their skin to diffusion of water vapour. Williams and Tieleman suggest that desert birds may reduce their CEWL by increasing their skin resistance, either by varying diffusion path length across the skin, or by altering the permeability of skin to water vapour. Diffusion path length can be reduced by vasodilation of subcutaneous capillary beds. Changes in lipid of the skin and increased epidermal thickness may reduce permeability of the skin to water in desert birds.
Studies on small desert birds suggest that lower BMR, FMR and TEWL are typical physiological responses to hot arid environments. Williams and Tieleman suggest that reduced BMR and TEWL may have evolved in desert birds, even though phenotypic adjustments in these physiological variables may be considerable, as demonstrated by their work on hoopoe larks. Whether reduced BMR and TEWL in desert birds results from physiological acclimation, phenotypic plasticity or an inherited feature is investigated further in Section 5. We should also be aware that phenotypic plasticity and the ability to acclimatise physiologically are under genetic control.
3.4 Integration of anatomical features and biochemical and physiological strategies in endurers
The endurers, large animals with a relatively low surface area: volume ratio, have problems in losing heat from the body when exposed to high T a. Certain large lizard species behave like endurers, but they are evaders and evaporators too, a salutary reminder that we should not apply classification criteria too rigidly.
Dipsosaurus dorsalis, the desert iguana, lives in the Sonoran desert and is found most commonly in dry sandy areas where creosote bushes grow (Section 1.1).
Dipsosaurus is a plant eater, and it feeds on creosote bush leaves and flowers during the day, often being exposed to high solar radiation for up to 45 minutes.
The species was a puzzle to physiologists because it can attain a T b of up to 46°C, without any apparent ill-effects.
Activity 12
Why would a T b of 46°C appear to be incompatible with life in a complex vertebrate species such as Dipsosaurus?
Answer
The complex globular and fibrous proteins of most vertebrates are denatured at temperatures greater than 40°C.
Comparison of ATPase activity at different temperatures in a number of different lizard species showed that for a temperate species, Gerrhonotus multicarinatus, optimal temperature for ATPase activity is 30°C whereas for Dipsosaurus, it is about 41°C (Figure 36) and is still functional up to 43°C or 44°C.
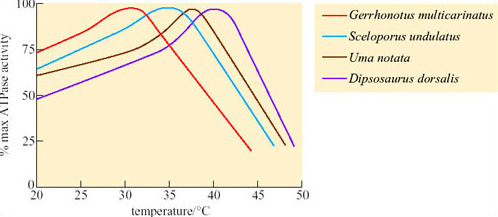
Since Dipsosaurus has enzymes that are stable even at high T b it needs to expend less energy for thermoregulation, e.g. by shuttling, and can forage for longer during the day. By foraging during the day, Dipsosaurus avoids nocturnal predators such as foxes. Dipsosaurus relies on the moisture content of its diet for water. Reptiles do not have loops of Henle, but most are uricotelic, excreting uric acid and urate salts, not urea, which means that little water is excreted in these end products of protein metabolism.
Reptiles have some degree of physiological capacity to control their rate of change of body temperature. In Dipsosaurus dorsalis, radiant heating results in local cutaneous vasodilation, and local cooling results in cutaneous vasoconstriction. Panting and gaping have been observed in heat-stressed lizards such as Dipsosaurus dorsalis and Sauromalus obesus. When T b of Sauromalus exceeds 40°C, the mouth gapes, there is a five-fold increase in breathing rate, lung tidal volume decreases by two-thirds, and TEWL increases. Panting has significantly greater cooling effects on the brain than on the rest of the body, probably because of the proximity of the mouth to the carotid arteries in the neck that supply blood to the brain.
The best-known examples of desert endurers include the camel, the oryx and desert sheep; in fact most desert endurers are large mammals. Their relatively low surface area: volume ratio means that they have more difficulty than small animals in losing heat from the body at high T a. Mammalian and avian endurers are too large to shelter in burrows, and if no shade is available, they may be forced to remain exposed to solar radiation during the day. The hair of large desert mammals can play an important role in insulation, both from solar heat and nocturnal cold. Figure 37 compares the thermal properties of the coats of two breeds of heat-tolerant sheep with that of the camel.
For each example, the raised temperatures of the body core to 39°C suggest that some heat is being stored during the day. The long loose coat of the Awassi sheep is penetrated by solar energy which heats up the middle layers, making the skin quite hot. Merino sheep have a dense fleecy coat, and lose long-wave radiation from the hot tips of the hairs, maintaining a gradient of up to 43°C across 4–5 cm of fleece so the skin is protected from overheating. In short-coated camels, a dorsal ridge of long dense hair provides shading and insulation for the skin, while all of the coat, most of it short and smooth, reflects solar energy. Sweating keeps the camel's skin cool.
Sweating, an extreme form of CEWL in mammals, is important for cooling in many species. Sweating is the secretion of water plus some salts from special sweat glands in the skin, which occurs as a response to an increase in T b. The glands are of two types. Atrichial (without hair) glands are found in primates and also on the pads of cats and dogs. They develop from the epidermis independently of the hairs and open on the free surface of the skin. Atrichial sweat glands are at their densest on human palms and soles, and elsewhere on the body they are at a density of 100–300 cm−2 (Figure 38a). Epitrichial (around hair) sweat glands develop only in association with hair follicles (Figure 38b). They are found in many mammalian species including cattle, sheep, horses and camels.
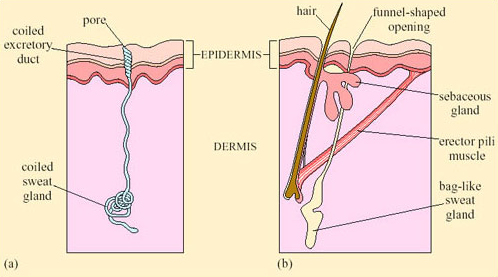
Epitrichial sweat glands play an important role in thermoregulation in these species. In cattle there are about 1800 cm−2, and in sheep, about 300 cm−2. Sweat is an ultrafiltrate of plasma, containing sodium chloride and other salts, lactic acid and urea. As the sweat glands absorb much of the electrolytes, sweat is hypotonic to plasma; the salt content of sweat falls with acclimatisation. Evaporation of sweat, promoted by input of heat energy from the skin, cools the body. One problem for thermoregulation by sweating in furry mammals is that water evaporating from a fur coat takes a significant proportion of its heat from the air rather than from the skin, and is therefore less effective in cooling the body.
Sweating has a physiological cost in that it involves loss of salts and organic molecules as well as water from the body. Initially fluid lost from the plasma is replaced from various ‘non-essential’ reserves, such as the digestive glands and the gut, but eventually the osmotic pressure of the blood increases. The change is detected by special neurons, osmoreceptors, in the hypothalamus. In turn the osmoreceptors stimulate release of ADH from neurosecretory neurons in the hypothalamus. Secreted ADH enters the capillary network supplying the posterior pituitary, and from there the hormone is secreted into the bloodstream. ADH binds to receptors in cells lining the collecting ducts of the kidney and promotes resorption of water back into the bloodstream (Figure 39). Later on some fluid is withdrawn from the intracellular compartments of the body and there is an inevitable reduction in plasma volume if the lost water is not replaced by drinking.
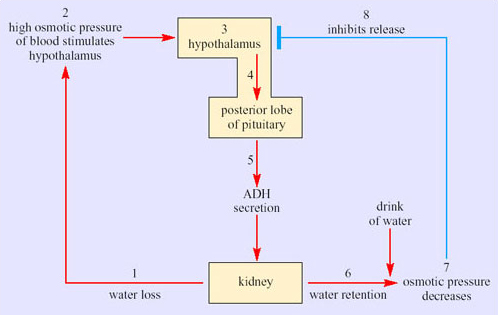
It is worthwhile working through the series of events in Figure 39. Stage 1 represents a situation where water lost via urine is not replaced by drinking water. The osmolarity of the blood increases, which raises the osmotic pressure of the blood. At stage 2, osmoreceptors in the hypothalamus detect the increased osmotic pressure of the blood. Hypothalamic neurosecretory neurons (stage 3) respond by transferring ADH along axons into the blood circulation of the posterior pituitary (stage 4). ADH secreted into the bloodstream (stage 5) reaches target cells, epithelial cells in the collecting ducts of kidney. The response to ADH is an increased permeability of the basal membranes of epithelial cells in the collecting ducts, which promotes resorption of water. The kidney thereby produces more concentrated urine and water is retained (stage 6). Say the individual now has a drink of water. Absorption of the water into the bloodstream decreases the osmolarity of the blood so the osmotic pressure decreases (stage 7). In stage 8, the hypothalamic receptors respond to the decline in osmotic pressure by inhibiting the release of ADH.
Activity 13
Is the control of ADH secretion an example of negative or positive feedback?
Answer
It is negative feedback because an increase in the secretion of ADH leads to a change in osmotic pressure, which in turn decreases ADH secretion.
The hormonal control of physiological variables by means of negative feedback loops maintains a constant level of body fluid volume, an important element of homeostasis, the maintenance of a constant internal environment.
Unfortunately in humans, the plasma contributes a disproportionate share of the overall fluid lost. A level of dehydration equivalent to a 4 per cent loss of body weight is accompanied by a reduction in plasma volume of about 10 per cent. Since there is no corresponding fall in blood cells or plasma proteins, the viscosity of the blood rises just at the time when the circulatory system, which bears the main burden of maintaining the body's heat balance, is already under strain as a result of the maximal cutaneous vasodilation that transports heat to the surface and plasma to the sweat glands. The demand on the heart is therefore great as it tries to maintain the blood pressure and peripheral circulation. Hypotension (low blood pressure) and fainting may follow. If correct action is not taken quickly, the result is a rapid rise in body temperature and death through hyperthermia.
The amount of water lost during sweating in humans can be considerable. A man marching in the desert may take on a solar and terrestrial radiation load of 2000 kJ h−1 even allowing for the reflectance of his skin and clothing. On the basis of a latent heat of vaporisation of 2.4 kJ g−1, about 800 cm3 of sweat would be needed per hour to dissipate this heat load even on the assumption that all the heat of vaporisation is drawn from the body itself. This calculation does not take into account any direct heat loading from air hotter than the body, or the substantial metabolic generation of heat. Therefore, figures of 2 or 3 litres of sweat per hour are feasible. An adult man carrying out moderate work in hot dry conditions may secrete 0.5 litres of sweat per hour and when under high heat stress, up to 3 litres per hour. The efficiency of the human sweating mechanism depends critically on the ability to drink. However, under prolonged heat stress, even if water is available, the limited capacity of humans for physically drinking water leads to a ‘voluntary’ dehydration of 2–4 per cent of the body mass, producing a chronic condition of decreased plasma volume and a raised blood osmotic pressure, coupled with a fall in urine output of up to 80 per cent.
The camel handles its water balance problems more effectively than humans. Schmidt-Nielsen et al. (1967) showed that in a 290 kg camel, a 17 per cent weight loss due to dehydration was accompanied by only an 8.8 per cent reduction in plasma volume and a 38 per cent fluid loss from the gut. A camel has up to 75 litres of fluid in its rumen (85 per cent of it is water) and another 8 litres in the intestine. The 38 per cent of water loss in the gut is therefore about 30 litres, which minimises strain on the blood circulation during dehydration. Overall, camel tissues seem to be more resistant to high osmotic pressures than those of many animals. The camel can cope with up to 30 per cent water loss. When provided with water after such a high level of dehydration, the camel can drink rapidly taking in up to 200 litres of water in just a few minutes. Much of the water taken in is stored temporarily in the gut, preventing excessive dilution of the blood which in itself would be harmful.
Schmidt-Nielsen et al.'s research added detail to the common perceptions that camels store free water in the rumen and utilise water derived from metabolism of the lipids released from the adipose tissue that forms the fatty hump. Although camels have a great deal of water in the rumen and intestine, it is proportionately no more than is present in other ruminants. It is true that since the oxidation of 1 g of fat yields 1.07 g water, a 40 kg hump could yield 43 litres of water that can be drawn on during a long journey. Schmidt-Nielsen pointed out that as this mechanism requires oxygen, which can only be obtained by ventilating the lungs, there must be a net loss of water from the respiratory tract when the camel breathes dry air. Whether the fat reserves make a positive or negative contribution to the animal's overall water balance depends on conditions prevailing in the upper respiratory tract.
Research by Schmidt-Nielsen and his colleagues investigated this question. Working on feral camels under natural conditions in central Australia, the researchers measured body temperatures, oxygen consumption and respiratory frequency and volume, as well as the temperature and relative humidity of the inspired and expired air by means of sensors inserted loosely into a nostril. The results showed that during the daytime, severely dehydrated camels exhaled air that was at or near the core temperature and fully saturated with water vapour. At night, however, there was a marked difference, the exhaled air being at or near the ambient temperature with a relative humidity of about 75 per cent.
We can best gain an impression of the camel's water balance by taking an example which uses hypothetical but realistic figures. Consider a camel resting at night in air at 28°C and 40 per cent r.h. Every 2 minutes it metabolises 1 litre of oxygen, extracted from 20 litres of inhaled air. This volume of air, under these conditions, contains 216 mg water. This same volume exhaled at core temperature (35°C) and fully saturated, contains 784 mg water, an overall loss to the camel of 568 mg. If 20 litres of saturated air were exhaled at ambient temperature (28°C, water content 538 mg), the loss would be reduced to 322 mg, while 20 litres of exhaled air at 28°C and only 75 per cent r.h. (the humidity measured by Schmidt-Nielsen) would have a water content of 403 mg, further reducing water loss to 187 mg. The maximum saving of water could then be calculated as follows:

Although this mechanism only seems to operate at night, it clearly makes an important contribution to water conservation in the dehydrated camel and probably ensures that there is a gain of water from the oxidation of fat.
Camels also conserve water by reducing urine flow, and can do so to a far greater extent than humans. The camel kidney can produce urine twice as concentrated as that of humans (see Table 3 in Section 3.2), and can reduce the amount of urea it excretes. According to Schmidt-Nielsen, urea in the blood may be secreted into the rumen, where bacteria incorporate the nitrogen into amino acids and then into protein. This protein is later digested and absorbed, and some of it is deaminated in the liver, releasing urea back into the blood again. This cycle may help to retain nitrogen, and hence the water that would have been needed to excrete it as urea, within the body during periods of water shortage.
Relaxed homeothermy is important for water conservation in the camel, which uses the capacity of its immense bulk (up to 500 kg) to store heat. If water is short in the summer, the camel may maintain a normal core temperature throughout the night and then at around 06.00 h allow its body temperature to fall to about 34°C. Throughout the day, its temperature rises due to muscular work, solar radiation or both, but the camel does not begin thermoregulating by sweating until the rectal temperature reaches 40°C. Thus the camel absorbs sufficient heat to raise its body temperature over a range of 6°C, compared with only 2°C in humans. By this means the camel may save about 5 litres of sweat in a day, which is significant, considering that a 500 kg animal resting in the sun loses a total of about 10 litres of water per day by sweating, breathing and excreting. There is no evidence that the camel's lethal body temperature is significantly different from that of humans, but it certainly is more tolerant of changes in body temperature.
Overall the anatomy, physiology and biochemistry of the camel are geared towards conservation of water. Camels survive without drinking for up to 6 weeks during colder periods, but in summer they must drink every 4 days at least. In contrast, Arabian oryx (Oryx leucoryx; see Figure 5 in Section 1.1) live in the Arabian desert, with no access to free-standing water. A group of wild oryx living in Mahazat as-Sayd, a nature reserve in central Saudi Arabia, have been studied extensively by Williams et al. (2001). Mahazat as-Sayd has no standing water apart from puddles after infrequent rain showers. Plants, mostly grasses and small trees (Acacia tortillas and Maerua crassifolia), cover only about 21 per cent of the reserve; the rest is sand. Summers are hot, with maximum and minimum temperatures of 41.5°C and 24.5°C respectively, and mild winters, with maximum and minimum temperatures of 23.4°C and 10.6°C. The annual rainfall is low, and falls mainly in winter: typical annual rainfall values were 129.6 mm in 1996, 84.3 mm in 1997. Tracking and observations of oryx showed that they feed on three species of grasses (Table 6).
| Summer 1998: % water content of grasses | Spring 1999: % water content of grasses | |||||||
|---|---|---|---|---|---|---|---|---|
| Species | June | July | August | Mean | February | March | April | Mean |
| Stipagrostis sp. | 4.6 ± 2.5 | 12.7 ± 10.5 | 4.4 ± 0.4 | 7.2 | 38.6 ± 8.1 | 45.7 ± 4.9 | 34.5 ± 8.5 | 39.6 |
| Panicum turgidum | 45.4 ± 3.4 | 44.5 ± 5.3 | 41.4 ± 5.5 | 43.8 | 47.1 ± 4.9 | 51.9 ± 5.5 | 49.5 ± 4.4 | 49.5 |
| Lasiurus scindicus | 35.7 ± 5.3 | 30.4 ± 5.6 | 27.0 ± 14.5 | 31.0 | 40.5 ± 8.2 | 55.6 ± 9.5 | 52.5 ± 5.9 | 49.5 |
BMR and TEWL at 30°C were measured in oryx resting in specially constructed metabolic chambers (Table 7a). FMRs and field water influx rates (FWIR) in wild Arabian oryx living at Mahazat as-Sayd were measured by use of the doubly-labelled water technique (Table 7b). FWIR give a measure of the water intake of the animal. In the summer, six oryx returning in the morning from night foraging to rest in shade were darted with anaesthetic, then weighed and injected with doubly-labelled water, 2H2 18O. Blood samples were taken on the injection day and at a mean of 8 days post-injection. The results of assays of 2H and 18O content of blood and fecal samples were used to calculate rates of water intake and field metabolic rates for each animal (Table 7). The mean body mass of 12 oryx studied in 1998–1999 was 85 kg. In summer 1998, when grasses were parched, field metabolic rates of free-ranging oryx were 11 076 ± 3070 kJ day−1 in contrast to 22 081 ± 3646 kJ day−1 in spring 1999, after rains. The difference between metabolic rate in summer and spring was significant (P< 0.0001) and Williams et al. suggest that oryx cut their energy expenditure in summer by changing both behaviour and physiology. In summer, oryx forage at night and rest during the day. In spring, following the rains, increased energy expenditure may derive from walking longer distances for foraging, and also the costs of thermoregulation because of reduced T a.
| Number and sex of animals | Mean body mass/kg | BMR/kJ day−1 | TEWL/g H2O day−1 | FMR/kJ day−1 | FWIR/cm3 day−1 |
|---|---|---|---|---|---|
| (a) 6 females | 89.2 | 9160 ± 732 | 898 ± 126 | — | — |
| (a) 6 males | 79.0 | 8674 ± 565 | 829 ± 181 | — | — |
| P/data pair | P> 0.06 | P< 0.05 | P< 0.05 | ||
| (b) 3 males + 3 females | 81.5 | — | — | 11076 ± 3070 | 1310 ± 1019 |
| (in summer 1998) | |||||
| (b) 5 males + 1 female | 89.0 | — | — | 22081 ± 3646 | 3438 ± 1006 |
| (in spring 1999) | |||||
| P/data pair | P> 0.5 | P< 0.0001 | P< 0.007 |
Activity 14
Compare the mean water intake rates in the oryx in spring and summer, and state whether you think the differences you identify are statistically significant.
Answer
In spring, mean water intake is much greater, 3438 ± 1006 cm3 day−1 compared with 1310 ± 1019 cm3 day−1 in the summer. The difference in water intake certainly looks statistically significant (in fact, it is, P< 0.007).
Activity 15
Looking at the data in Tables 6 and 7, can you suggest a reason for the difference in water intake rates for oryx in spring and summer?
Answer
As no free-standing water is available to the oryx they must have obtained all or most of their water from their diet. Water content of grasses eaten by oryx varied significantly between summer and spring (see Table 6). Water content of Stipagrostis was just 7.2 per cent in summer 1998, but in spring 1999 rose to 39.6 per cent. Water content of L. scindicus rose from 31 per cent in summer 1998 to 49.5 per cent in spring 1999. Water content of P. turgidum was similar in spring and summer. As oryx only obtain water from their diet, presumably the lower water content of two of the food species determines a lower water intake in the summer.
Herbivores usually have a high water intake rate because of the high water content of plants. Williams et al. were surprised by the low values for water intake in oryx even during periods when the plants contain high percentages of water. Survival of a large herbivore on such low water intake suggests effective behavioural and physiological mechanisms that reduce water loss are in place. The simple strategy of resting in shade during the day and foraging at night (Section 2.5) plays an important role in reducing water loss.
Oryx, like camels, allow their body temperature to increase during the heat of the day thereby reducing the need for cooling by evaporative water loss. The temperature gradient in the nasal passages of both oryx and camel is used to protect the brain from overheating during periods of hyperthermia. The anatomy of the blood vessels in the head permits this protective mechanism. In both mammals and birds, blood returning from the nasal regions (and much of the brain) drains into a capacious collecting vessel, the cavernous sinus, from which it flows in the neck veins back to the heart. In many species including dogs, sheep, pigeons, and gazelles, a network of small arterial vessels, the rete mirabile (‘wonderful net’) passes through the cavernous sinus, branching from the two main arteries supplying the brain, the two carotid arteries. In species where nasal heat exchange is unimportant, e.g. monkey (Figure 40a) there is no rete mirabile and the carotid artery passes intact through the cavernous sinus providing little opportunity for exchange of heat. In the oryx, where the rete is present (Figure 40b), its large surface area permits exchange of heat between the warm arterial blood and the cooler blood in the cavernous sinus.
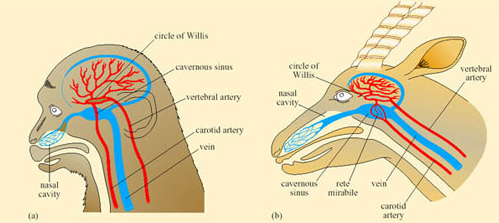
So blood passing out of the arterial rete and entering the circle of Willis, from which the brain receives its blood supply, is at a lower temperature than it was in the neck arteries themselves. As a result, the brain can be maintained at a lower temperature than the trunk and its essential function is maintained during hyperthermia in the rest of the body. The oryx and Thompson's gazelle can maintain a brain–body temperature difference of up to 3°C during sustained hyperthermia. This facility must be of enormous advantage to desert species when heat storage is used to minimise the physiological consequences of water shortage.
Large birds such as the ostrich allow their body temperature to rise when short of water and exposed to high T a. In fact both desert and non-desert species of bird can tolerate T b of 32–44°C, and reduce evaporative cooling when water is in short supply. The ostrich, like other ratites, has a long nose with complex turbinates and the nostrils are relatively far forward on the beak compared with their position in other birds. Expired air is cooled as it passes through the turbinates.
Ostriches can exhale unsaturated air. At T a = 36°C, exhaled air is at 85 per cent r.h. and by this means about 35 per cent of the water evaporated into the air during inspiration is saved. Thus the ostrich saves about 500 g water per day. However, you may be thinking that while water is conserved, the body does not lose any heat overall. The cooling effect in the turbinates does achieve brain cooling, with a 1.5°C difference measured between brain and body temperature. When at serious risk of overheating the ostrich supplements behavioural cooling strategies with panting by up to 40 times per minute.
Our study of a few representative examples of desert vertebrates has demonstrated a range of integrated anatomical, biochemical, and physiological adaptations and responses that enable the animals to cope with problems of high T a and water shortage. Yet there is nothing spectacular about desert animals; no unique and ‘amazing’ feature has been identified for desert vertebrates. Desert vertebrates rely heavily on behaviour, and we should ensure that we integrate behaviour with the overall package of biochemical and physiological adaptations for each species. Behavioural responses to environmental stresses reduce the need for physiological responses, which may be costly in terms of evaporative water loss or use of energy in an arid environment that has low productivity.
3.5 Summary of Section 3
Behavioural mechanisms for reducing water loss are integrated with physiology. While Dipodomys rests in a cool burrow, the nasal counter-current heat exchanger cools exhaled air, conserving water vapour evaporated from respiratory surfaces. Long loops of Henle operate as counter-current multipliers, producing highly concentrated urine. Desert foxes use panting for evaporative cooling, but high rates of evaporative water loss cannot be sustained; hence the crucial importance of dens for cooling. Research suggests that desert birds have reduced BMR and FMR in comparison to mesic species. Such data need cautious interpretation, as studies on hoopoe larks demonstrated phenotypic flexibility in BMR, FMR and evaporative water loss.
Large endurers have difficulties losing body heat. Dipsosaurus dorsalis allows T b to rise: its enzymes function at 47°C. Overheated mammals cool by sweating, losing water and salts. Camels reduce the need for sweating by relaxed homeothermy, allowing T b to rise to 40°C, but they can function after a 30 per cent water loss from the body. Oryx leucoryx obtain water from eating plants. In summer, the water content of grasses is much lower than in winter, highlighting the importance for oryx of foraging at night when T a is relatively low, and resting in shade during the day.
The brains of oryx and camels are protected from overheating by the operation of a rete mirabile. In the ostrich, blood cooled during passage through complex nasal passages flows to the brain, keeping it 1.5°C lower than T b, a significant reduction when the bird allows T b to increase to 44° C.
4 Integrating across disciplines
4.1 Heat-shock proteins
Molecular biology provides further insights into the biochemical and physiological responses of vertebrates to extreme temperatures and aridity in the desert environment. Animals living in hot deserts are at risk of overheating, which in turn results in denaturation of enzymes and other essential proteins. Physiologists were puzzled for a long time about how desert reptiles such as the desert iguana (Dipsosaurus dorsalis) function normally at T b = 44–46°C. Such high temperatures would be expected to result in complete denaturation of enzymes and other important proteins such as haemoglobin. Yet we saw in Figure 36 (in Section 3.4) that ATPase of Dipsosaurus continues to function even at 43°C or 44°C.
Discovery of heat-shock proteins (Hsps) suggested an explanation. The name ‘heat-shock proteins’ is applied because levels of Hsps in cells rise rapidly after exposure to abnormally high temperatures, e.g. around 40°C for mammalian cells. Hsps comprise at least 12 families of related proteins that are found in cells of all animal and plant species so far investigated, so they are molecules that have been highly conserved in evolution, and are not specific to desert species. Nevertheless, Hsps are important for species at risk of exposure to high T a because of their role as chaperone proteins that ‘rescue’ proteins whose tertiary structure has been disrupted by overheating. Chaperone proteins bind to denatured regions of a protein and alter the misfolded structure so that the correct three-dimensional structure is regained.
Heat-shock proteins maintain the biologically active conformation of enzymes and other essential proteins in cells during heat stress. For example, exposure of the fruit fly, Drosophila, to high temperatures, results in rapid transcription of a heat-shock gene, Hsp70. To begin gene transcription, various transcription factors, then RNA polymerase bind to special DNA sequences known as promoters; the latter determine where RNA polymerase binds, e.g. TATA (Figure 41), and starts transcription. Each gene has its own promoter. Nucleotide sequences in promoters tend to be highly conserved and are therefore the same in many species.
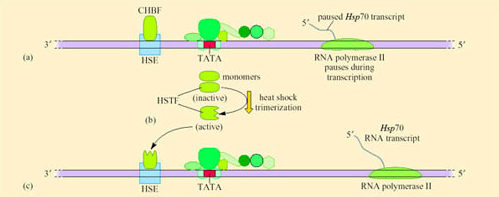
Gene sequences that regulate the promoter may be located adjacent to the promoter, or upstream or downstream of the gene. Regulatory elements control the transcription of genes that are not active all the time. A heat-shock regulatory element (HSE) has been identified in the promoter region of a heat-shock gene. Heat-shock transcription factors (HSTFs) are transcription factors that control Hsp gene expression through interaction with HSEs. The complex interlinking functions of the components involved in control of transcription of heat-shock proteins are shown in Figure 41.
Given the number of stages involved in Hsp gene transcription, researchers were puzzled initially by the rapid response, just a few seconds, to heat shock. Research on Drosophila demonstrated that such a rapid response is possible because Hsp70 is normally partly transcribed by RNA polymerase II, producing an RNA transcript about 25 nucleotides long. Mechanisms that pause the transcription are not understood well, but appear to involve constitutive HSE binding factors (CHBF) that bind to the promoter and halt transcription of the Hsp gene (Figure 41).
To understand how transcription of Hsp is resumed, we must begin with the role of HSTF. Normally, before heat-induced activation, HSTF exists as monomers in the cytoplasm. Research on heat-shocked mammalian cell cultures suggests that the signal for activation of HSTF is contact with the hydrophobic domains of proteins that have been denatured (Figure 42). HSTF monomer extracted from unstressed mammalian cells is bound to Hsp molecules. As the Hsp molecules bind to denatured protein during heat stress, it is likely that as a consequence, HSTF monomer is released from Hsp molecules. The released HSTF monomers trimerise and translocate to the nucleus where they stimulate resumption of transcription of Hsp genes by binding to the HSEs in the promoter regions.
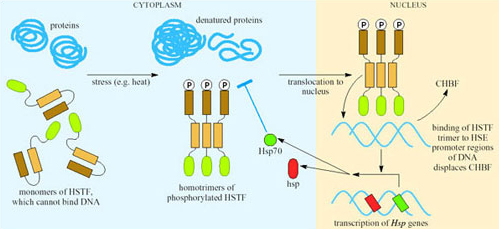
Most work on Hsps has been carried out using cell lines and tissue cultures. Few studies have been carried out on vertebrates, and most of those have concentrated on fish. However, Zatsepina et al. (2000) studied the synthesis, properties and activation of Hsp70 in three species of desert lizard: Phrynocephalus interscapularis, a highly thermoresistant diurnal species, and Gymnodactylus caspius and Crossobamon eversmanni, both nocturnal species. All three species were captured in a sand desert in Turkestan. Studies on a temperate species, Lacerta vivipara, provided comparisons with the desert species. All lizards were acclimated for 2 weeks at 25°C. Heat-shock treatment involved one hour exposure of lizards of each species to a specific T a at or greater than 39°C. Following heat shock the animals were killed and cell extracts from the whole body were prepared. Samples of the extracts were mixed with 32P-labelled HSE and incubated at 20°C for 20 minutes, during which time any HSTF or CHBF present would complex with the 32P-HSE. The free 32P-HSE was separated from the 32P-HSE-HSTF and 32P-HSE-CHBF complexes by gel electrophoresis. The gels were dried and exposed to X-ray film. Figure 43 shows the results of the analysis of binding of 32P-HSE to HSTF (complex III) and to CHBF (complexes I and II), in lizards kept at T a 25°C and lizards heat shocked at 42, 45 and 49°C.
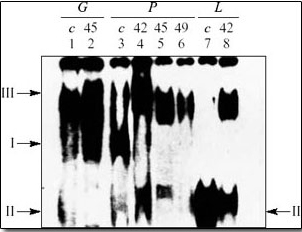
At T a 25°C for Lacerta (c, lane 7) the levels of complex II were high, but they were low for Gymnodactylus and Phrynocephalus. In contrast, levels of complex I were high for Gymnodactylus and Phrynocephalus but complex I was absent in Lacerta. Complex III, consisting of trimerised and therefore active HSTF bound to 32P-HSE, was present in both Gymnodactylus and Phrynocephalus, but not in Lacerta. So both desert species have activated HSTF even when acclimated to 25°C. Following heat shock, complex III, activated HSTF, was present in all three species (lanes 2, 4, 5, 6 and 8).
Activity 16
What is the significance of the presence of complex III in cell extract?
Answer
Complex III consists of HSTF bound to 32P-HSE which means that the HSTF was trimerised and therefore in a form that combines to HSE, and consequently activates transcription of Hsp genes.
Zatsepina et al. isolated mRNA from samples of cell extract prepared from control and heat-shocked lizards, and carried out hybridisation, probing with Xenopus laevis Hsp70, lizard HSTF1 and αβ-actin genes, the latter acting as a standard for comparison (Figure 44).
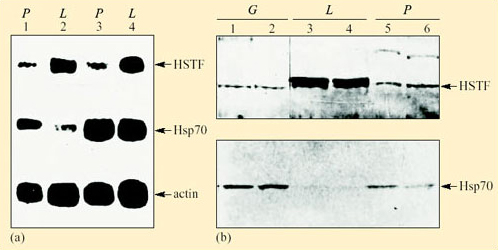
Activity 17
Compare the levels of HSTF mRNA and Hsp70 mRNA in Phrynocephalus and Lacerta, before and after heat shock.
Answer
Prior to heat shock, levels of HSTF mRNA were lower in Phrynocephalus than in Lacerta; in contrast, constitutive levels of Hsp70 mRNA were higher in the thermoresistant species Phrynocephalus than in Lacerta. Following heat shock both species showed strong induction of Hsp70 mRNA, demonstrating increased transcription of Hsp70 genes (Figure 44a). Neither of the two species showed increased amounts of HSTF mRNA after heat shock, in contrast to the large increases in Hsp70 mRNA.
Zatsepina et al. interpret these data as showing that HSTF genes in lizards are not induced by heat shock. Western analysis using antibodies to human Hsp70 showed that levels of cellular Hsp70 are higher in both desert species than in Lacerta (Figure 44b). Earlier work had measured a three- to fivefold higher Hsp70 content in desert species than in L. vivipara kept at T a 25°C.
Comparison of Lacerta vivipara with the nocturnal desert species Crossobamon eversmanni showed that the latter has 2–3 times higher levels of Hsp in its cells. After heat shock, liver cells of Lacerta synthesised high levels of Hsps 68 and 85. In the desert species, normal synthesis of all proteins in the liver continued after heat shock at 39, 42 and 43°C, whereas in Lacerta, protein synthesis reduced after heat shock at 37°C and 39°C and almost ceased at 42°C.
High levels of Hsps in cells of desert reptiles may stabilise protein structure sufficiently in the absence of thermostable proteins, and enable continuation of normal rates of protein synthesis at T b up to 45°C. Zatsepina et al. demonstrated a high level of Hsp70 transcription (Figure 44a) linked to activated HSTF bound to HSE (Figure 43, complex III), in the desert species Phrynocephalus, even in animals kept at relatively low T a. Tight regulation of Hsp gene expression ensures a response appropriate for the level of heat stress and a subsequent repression of the response when the stress is over. As T a was increased for Phrynocephalus (Figure 43), relative amounts of complex III increased as complexes I and II decreased, suggesting removal of suppression of Hsp expression. Desert and temperate lizards differed in the quantity and state of HSTF and constitutive HSE-binding activity (CHBA), both under normal and heat-shock conditions.
In the desert species induction of Hsp synthesis at 3–7°C higher than in temperate forms may link to high constitutive levels of Hsps. Temperate lizards, in contrast, have low constitutive levels of Hsps but high levels of HSTF which probably expedite intense synthesis of Hsps after a brief exposure to heat shock. Severe heat shock is lethal for the temperate lizards but is tolerated by the desert species. Phrynocephalus maintains cellular Hsps, and therefore can continue to function normally even when T b rises to 45°C. This capacity is of great advantage to a diurnal desert reptile as foraging times can be prolonged. By foraging during the hottest parts of the day diurnal desert reptiles avoid predators.
As you have read in Section 2.3, many desert vertebrates avoid overheating by behavioural means, so you may conclude that Hsps are of no more importance in desert species than in temperate species. However, the need for behavioural thermoregulation at any one time may conflict with other needs, e.g. finding food or escaping from predators. A spurt of intense physical activity may raise T b sufficiently to initiate Hsp transcription. Species such as the camel that use relaxed homeothermy as a means of reducing TEWL experience T b as high as 41°C. Desert lizards that forage during the day may routinely experience T b values high enough to trigger a heat-shock response. Although desert animals are not unique in having Hsps, life in the desert environment, where animals are at risk of overheating, is probably facilitated by efficient functioning of Hsps.
4.1.1 Summary of Section 4
The integration of physiological and molecular responses links an environmental signal to a physiological response. Heat-shock proteins (Hsps) are chaperone proteins that maintain the structure and function of proteins in cells exposed to high temperatures. The initial response of cells to high temperatures is rapid transcription of heat-shock genes, e.g. Hsp70, which is possible because Hsp70 is normally partly transcribed by RNA polymerase II. Resumption of transcription requires only three steps: release, then trimerisation of HSTF (heat-shock transcription factor), followed by binding to HSEs (heat-shock regulatory elements) in the promoters.
At T a 25°C, the desert reptiles Phrynocephalus interscapularis and Crossobamon eversmanni have high constitutive levels of Hsps in their cells, in contrast to a temperate species, Lacerta vivipara. Cells from P. interscapularis and Gymnodactylus caspius kept at 25°C contained high levels of active HSTF bound to HSE in contrast to cells from L. vivipara, suggesting that in desert species HSTF genes are expressed constitutively. Protein synthesis in liver cells of desert species continued normally following heat shock up to 45°C, whereas in L. vivipara protein synthesis in the liver plummeted after heat shock at 37°C. Cells of desert species are well prepared for heat shock.
5 Integrating across species
Populations of related species occupy similar niches in different environments. A big question for environmental physiologists is whether differences in biochemistry and physiology between related species living in different environments derive from physiological acclimatisation (sometimes referred to as phenotypic flexibility), phenotypic plasticity or evolutionary adaptation.
Recall from Section 3.3 how hoopoe larks, wild-captured from the Arabian desert and kept at T a 25°C for just 3 weeks, showed increased body mass, increased food intake and increased BMR in comparison to hoopoe larks kept at 36°C. Clearly, interspecific comparisons of BMR should be designed with the possibility of phenotypic plasticity and/or flexibility in mind.
Comparisons between vertebrate species of similar body mass within a particular taxonomic group but living in different environments have shown substantial differences in metabolic rate, e.g. metabolic rates of some desert mammals are relatively low in comparison with mammals of similar size within the same taxonomic group. The association between food intake, diet and environmental factors can be expressed in deceptively simple terms. Net primary productivity of the environment is determined to a major extent by environmental factors. Plant growth and therefore availability of food for animals is affected by climate, especially rainfall and T a. However, metabolic rates of mammal species living on low-energy diets, e.g. herbivores eating large quantities of fibrous plants, are relatively low, in comparison with species eating foods with high-energy content such as fruits and nuts. Mueller and Diamond (2001) proposed that the low net primary productivity (NPP) of deserts and consequent low availability of food can only support mammals with relatively low metabolic rates. In contrast, relatively high metabolic rates may have evolved in species living in environments with abundant food; they ‘run and idle fast’. BMR can be regarded as the metabolic rate during ‘idling’. Mean field metabolic rates represent the total energy costs of an animal's normal daily activities and rest periods.
To test the hypothesis that there is a direct association between environmental NPP, BMR and FMR, Mueller and Diamond studied five species of deer mice (Peromyscus spp.). They are the most common North American mammals and are found in habitats ranging from Alaska to Central America. The cactus mouse (Peromyscus eremicus) is found in the North American deserts, including the Sonoran and Mojave deserts. It is nocturnal and emerges from its burrow at night to feed on seeds, and occasionally leaves and insects. Other species of Peromyscus live in woodland, the prairies and scrubland (Table 8). The five species selected all have similar diets, but live in diverse habitats of varying NPP. All five species are omnivores that feed on seeds, flowers, fruits and also insects and fungi. Breeding colonies of all the species, obtained from the Peromyscus Genetic Stock Center, were maintained in the laboratory under the same conditions and provided with water and the same diet ad libitum. The mice were kept at 27°C on a 16 h/8 h light/dark cycle. The mice in these colonies had been in captivity for 10–40 generations. Thus any physiological acclimatisation to the environment would have lapsed and selection for adaptation to the natural environment would have been relaxed.
| Species | Body mass/g | Ancestral site | Habitat type | NPP/g C m−2 yr−1 |
|---|---|---|---|---|
| P. eremicus | 22.2 ± 2.8* | Nr Tucson Arizona | Sonoran desert | 48 |
| P. melanophrys | 45.0 ± 6.3 | Zacatecas in Mexico | Yucca/agave desert | 67 |
| P. californicus | 43.5 ± 4.5 | Santa Monica Mts, CA | Chaparral/coastal sage scrub | 340 |
| P. maniculatus | 19.0 ± 1.4 | Nr Ann Arbor, MI | Deciduous woodland and meadow | 600 |
| P. leucopus | 19.1 ± 3.5 | Nr Linville, NC | Deciduous/coniferous forest | 604 |
* ± SE.
BMR was measured for individual male mice aged 8–15 months during daylight, while the mice were resting and had completed digestion. The dry mass of food consumed, dry mass of faeces produced and body mass of the mice were recorded daily. Values for NPP were calculated for the sites where the founders of the captive Peromyscus populations were collected. Figures 45a and b show, respectively, mass-adjusted BMR and daily food intake plotted against NPP for the five species of mice.
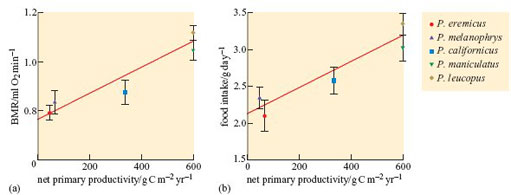
Activity 18
Describe the data in Figures 45a and b.
Answer
There is positive relationship between NPP and BMR. Where the NPP is 50 g C m−2 yr−1, animals have a BMR of about 0.8 ml O2 min−1. As NPP increases to 600 g C m−2 yr−1, animals have a BMR of about 1.1. Food intake also positively correlates closely with NPP. With NPP levels of about 50 g C m−2 yr−1 food intake (g day−1) is around 2.3, rising to around 3.0 when NPP is 600.
Net productivity of each species' habitat of origin, BMR, and total energy intake (the latter equivalent overall to total energy expenditure) differed in the same rank order in the five Peromyscus species.
The data support the researchers' hypothesis that the well-provisioned species had evolved to ‘run and idle fast’. Peromyscus eremicus and P. melanophrys, both desert species, have the lowest values for BMR (the ‘idling’ metabolic rate) and food intake (a measure of FMR). In contrast, two species living in environments with NPP> 600 g C m−2 yr−1 had the highest values for BMR and daily food intake. Peromyscus californicus was intermediate in both BMR and daily food intake. It is important to correlate observations of behaviour of species subjected to physiological measurements and the researchers noted that P. leucopus and P. maniculatus, species with the highest values for BMR and food intake, were jumpy and ready to escape from their cages, biting people who handled them. In contrast, the two species with the lowest food intake and BMR, P. eremicus and P. melanophrys, were docile and easy to handle. It is tempting to interpret the behaviour of the desert species as being geared to saving energy. Mueller and Diamond conclude that food availability determines which species of Peromyscus do best in a particular habitat.
Summary of Section 5
Researchers proposed the hypothesis that the low primary productivity of deserts and low availability of food correlates with low BMR and FMR of desert species. They tested their hypothesis by studying five captive-bred species of deer mice, Peromyscus: two originating from deserts with low NPP, one from chaparral and two from woodland with high NPP. The five species have similar diets, and were fed ad libitum. The desert species, P. eremicus and P. melanophrys, had the lowest BMR and lowest food intake. The two species from woodland, P. maniculatus and P. leucopus, had the highest values for BMR and food intake, while P. californicus from chaparral had intermediate BMR and food intake. This investigation was stringent as all the deer mice were descended from stock that had been captive for 10–40 generations. Therefore, the results could not be explained by phenotypic plasticity or flexibility.
6 Phylogeny and cladistic analysis
In Section 3.3 the point was made that many physiologists consider that desert birds are successful because of their avian physiology, not because of any specific adaptations. While Williams and Tieleman's research on hoopoe larks demonstrated that desert species are capable of flexibility in metabolic rate and evaporative water loss, it suggested that adaptation is important too. The selective advantages of lowered BMR and TEWL for desert birds include reduced energy demand, and lower production of metabolic heat reducing the need for EWL. Both BMR and TEWL appear to be at least partly genetically determined, so it is likely that they are subject to natural selection. We have seen from the hoopoe lark study in Section 3.3 that phenotypic flexibility may account for differences between populations of the same species. Phenotypic plasticity (Section 3.3) may also provide confounding variables for such studies.
The power of the comparative approach in which a physiological feature in a range of related species is studied can be appreciated from the study of Peromyscus species outlined in the previous section. Studies of clades comprising related genera within a family can be more powerful still. Irene Tieleman et al. (2003) tested the hypotheses that both BMR and TEWL are reduced along an aridity gradient within a single family of birds, Alaudidae (larks). Their study also investigated the role of phylogenetic constraint, the situation where similar traits seen in closely related species may be there not because they are adaptive, but because they were inherited from a common ancestor. The researchers chose larks for the study, because larks live in a vast geographic area, covering three continents, with species found in a wide range of environments, from hyper-arid desert to mesic grassland. Nevertheless, all larks eat a similar food, seeds and insects, so diet was not a confounding variable in this study.
Aridity is directly related to primary productivity, and is therefore a sound measure of the selection pressures that animals experience with increasing aridity. These selection pressures include decreased food and water availability and increasing air temperatures. The researchers investigated eight species, and also used data in the literature for six other species for the study. BMR and TEWL were measured at night using standard respirometry and hygrometry methods. The aridity index selected, log Q, was appropriate to the habitat of the birds in this study. Log Q is low in hot dry deserts and high in relatively cool wet areas.
Table 9 summarises the results for the 14 lark species. Analysis showed that both body mass and aridity had significant effects on BMR (P< 0.0001).
| Species | Body mass/g | BMR/kJ day−1 | TEWL/g H2O day−1 | Annual precipitation/mm | Log Q |
|---|---|---|---|---|---|
| Grey-backed finchlark (Eremopterix verticalis) | 15.1 | — | 1.31 | 33.0 | 1.76 |
| Stark's lark (Eremalauda stark) | 15.6 | — | 1.31 | 57.2 | 1.76 |
| Desert lark (Ammomanes deserti) | 21.5 | 20.1 | 1.60 | 89.6 | 1.78 |
| Dunn's lark (Eremalauda dunni) | 20.9 | 24.7 | 1.69 | 89.6 | 1.78 |
| Hoopoe lark (Alaemon alaudipes) | 36.9 | 32.8 | 2.59 | 89.6 | 1.78 |
| Black-crowned finchlark (Eremopterix nigriceps) | 15.2 | 16.5 | 1.34 | 209.1 | 2.24 |
| Crested lark (Galerida cristata) | 31.2 | 32.2 | 2.44 | 209.1 | 2.24 |
| Calandra lark (Melanocorypha calandra) | 50.6 | 49.5 | 3.03 | 250.0 | 2.26 |
| Horned lark (Eremophila alpestris) | 26.0 | 28.6 | 2.08 | 309.9 | 2.41 |
| Lesser short-toed lark (Calandrella rufescens) | 23.6 | 31.6 | — | 281.0 | 2.59 |
| Short-toed lark (Calandrella brachydactyla) | 24.0 | 35.6 | — | 281.0 | 2.59 |
| Spike-heeled lark (Chersomanes albofasciata) | 25.7 | 29.1 | 3.33 | 420.4 | 2.60 |
| Skylark (Alauda arvensis) | 32.0 | 62.4 | 3.17 | 750.0 | 3.20 |
| Woodlark (Lullula arborea) | 25.6 | 49.4 | 2.41 | 750.0 | 3.20 |
Tieleman et al.'s analysis of the data in Table 9 supports their view that BMR of larks increases as the environment becomes more mesic (Figure 46a). Also, TEWL of larks decreases as the environment becomes more arid (Figure 46b).
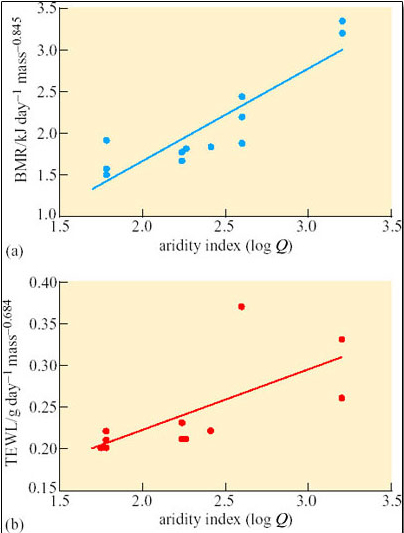
Tieleman et al.'s study involved the comparison of two traits across lark taxa, BMR and TEWL. The statistical analyses of the data in Figures 46a and b assumed phylogenetic independence, but the researchers were aware that the positive correlation obtained between BMR and TEWL with aridity could be explained by phylogenetic autocorrelation, a relationship derived from the phylogeny itself, rather than adaptation.
The researchers constructed a cladogram for 22 species of lark. DNA samples were extracted from blood or tissue samples, and polymerase chain amplification was used to amplify the cytochrome b gene (975 base pairs) and the 16S rRNA gene (566 base pairs). DNA was sequenced for each species and statistical analysis carried out to determine the most probable evolutionary tree for the clade. The cladogram (Figure 47) indicates a number of clades within the lark family. The lengths of the branches in the cladogram indicate phylogenetic distance between the clades.
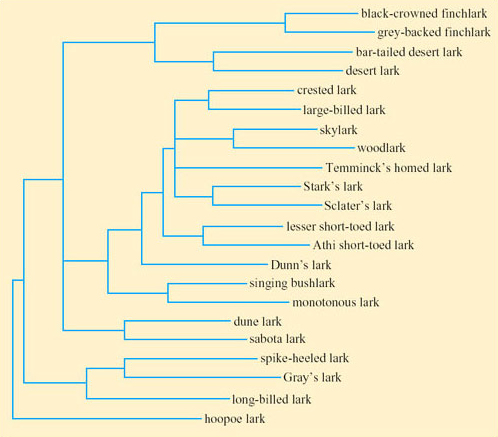
Activity 19
Compare the lengths of the terminal branches of the cladogram with those of the internal (initial) branches.
Answer
The terminal branches are long in comparison to the short internal branches.
Activity 20
Suggest an outgroup within the cladogram and justify your choice.
Answer
The position of the hoopoe lark suggests that it may be an outgroup. The hoopoe lark is placed at the bottom of the cladogram suggesting that this species might be representative of the common ancestor.
Tieleman et al. interpret the short internal branches, coupled with long terminal branches, as suggesting that lark species underwent rapid adaptive radiation and have lived for a major part of their evolutionary history in diverse habitats. It is possible that variation in TEWL and BMR relates to phylogenetic distances, so that the more closely related genera within a clade have similar TEWL and BMR. For example, if variation in BMR could be explained simply by phylogenetic distance, members of one clade within the lark family would have similar values for BMR, in contrast to members of two other clades, which might have lower and higher values, respectively. In that case, BMR would be correlated with phylogeny itself, i.e. phylogenetic autocorrelation, which may be attributable to phylogenetic constraint or to ecological factors.
There was a significant phylogenetic effect in the data linking mass-corrected BMR with aridity.
Specialised statistical analysis ruled out phylogenetic autocorrelation as the sole explanation of the relationship between BMR and aridity. Since the BMR of larks decreases along a gradient of increasing aridity, Tieleman et al. therefore argued that this relationship is due to adaptation rather than phylogenetic constraint.
Mass-corrected TEWL correlated with aridity with no significant influence of phylogeny.
The decreases in BMR and TEWL with increasing aridity in larks suggest that BMR and TEWL have adaptive significance and that natural selection is the relevant process.
Summary of Section 6
A cladistic analysis of 14 lark species (family Alaudidae) investigated the hypotheses that BMR and TEWL are reduced along an aridity gradient. Although larks are found over a huge geographic area, all species have similar diets so diet was not a confounding variable. The researchers collected data on body mass and BMR and calculated the aridity index for the environment of each species. Analysis of the data showed that aridity had a significant effect on both BMR and TEWL. The shape of an evolutionary tree for the clade suggests radiation of larks soon after their origin. No correlation was found between mass-corrected TEWL and phylogeny, suggesting that correlation between TEWL and aridity is not due to phylogenetic constraint. Statistical analysis eliminated phylogenetic constraint as an explanation for the relationship between BMR and aridity although mass-corrected BMR correlated with both aridity and phylogeny.
7 Conclusion
In this course we have studied animals in the context of their own habitat rather than using the traditional comparative physiology approach of comparing organ systems in different species. Although we have looked at extreme habitats, specifically deserts, it has become clear that, for many species, extreme physiological adaptations are not present and that even endotherms, birds and mammals rely on behavioural strategies, thereby reducing the need for physiological strategies that are costly in terms of water usage and energy. Furthermore, we have learned that desert animals do not always maintain homeostasis, a constant internal environment. There are species of birds and mammals, groups defined as homeotherms, that allow their T b to rise when T a is high; this relaxed homeothermy is seen in the camel, the oryx and ostrich. Physiological adaptations that we have seen in desert animals are also present in non-desert species, e.g. panting, sweating and the rete mirabile for brain cooling. Only by integrating biochemical, physiological and behavioural strategies can we understand how an animal survives and exploits its environment. Molecular biology is providing new insights and the little information that is available so far, has already provided another level of analysis to feed into integrative animal physiology. The puzzle of how desert lizards function normally at T b as high as 46°C may have been solved, at least partially, by the finding that these species have high cellular levels of heat-shock proteins that function as chaperone proteins.
We have also touched on the relatively new science of evolutionary physiology. In this context identifying the differences between acclimation, phenotypic plasticity and adaptation is of crucial importance as we saw from the studies on desert larks and Peromyscus. Once physiological traits shaped by natural selection have been identified, research on the evolution of such traits across species or higher taxa can be linked to evolutionary trees. One important issue is how does the physiology of an ancestral species affect what is possible in its descendants? Similar traits seen in closely related species might be there not because they are adaptive, but because they were inherited from a common ancestor – the phenomenon of phylogenetic inertia. Williams and Tieleman eliminated phylogenetic inertia as being the cause of the lower TEWL in desert lark species. Although the researchers identified a significant effect of phylogeny in the mass-corrected values for BMR there was also a significant effect of aridity on BMR that was independent of phylogeny. Statistical analysis of the data supported the researchers' view that natural selection is likely to be the process that explains the correlation between decreasing levels of BMR and TEWL with increasing aridity. Mueller and Diamond's study of Peromyscus species, obtained originally from diverse habitats but captive for 10–40 generations, showed that desert species had significantly lower BMRs than the species from more temperate habitats. This study provides evidence that lower BMR in the desert species is a genetic trait, not the result of acclimatisation or phenotypic plasticity.
8 Questions
Question 1
Figure 48 illustrates the activity of the antelope ground squirrel Ammospermophilus leucurus during a typical day in the Nevada desert.
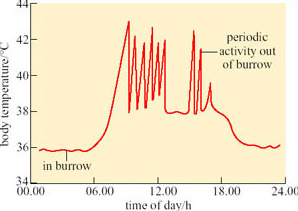
(a) Describe the pattern of activity suggested by the data.
(b) Explain how the behaviour of the ground squirrel relates to thermoregulation.
(c) Is Ammospermophilus an evader, an evaporator or an endurer?
Answer
(a) During the night Ammospermophilus remains inside the burrow. At about 06.00 h, the squirrel leaves the burrow and is active, presumably collecting seeds. A short period of activity is followed by a return to the burrow. From 06.00 h to 17.00 h the squirrel left the burrow on nine occasions, and was active for a short period before returning to the burrow. Peaks of activity were recorded up to about 17.00 h when the squirrel retired to the burrow for the night.
(b) During the night T b was fairly stable at 36°C. During bouts of daytime activity, T b rose sharply peaking at 43°C. Returning to the burrow enabled the squirrel to cool off, as T b dipped to 38–39°C after only short periods in the burrow.
(c) Use of the burrow suggests Ammospermophilus is an evader, but tolerance of T b as high as 43°C indicates a degree of endurance too.
Question 2
Classify the following statements as true or false and write a brief explanation of your answer.
(a) Many small desert mammals are able to endure hot and physiologically stressful ambient temperatures by storing heat for a number of hours.
(b) The coat of camels has an insulating effect in hot environments and camels shorn of their coat are likely to have a higher evaporative water loss.
(c) Measurements of BMR in the hoopoe lark have demonstrated that this desert species always has a lower BMR than mesic lark species, and that low BMR in the hoopoe lark is adaptive.
(d) Panting is a thermoregulatory response shown exclusively by large mammals.
(e) When faced with severe heat stress, mammals resort to autonomic responses, whereas reptiles and birds respond behaviourally.
Answer
(a) False. Most small animals avoid rather than endure heat stress, but a few species, notably ground squirrels, can tolerate T b up to 42–43°C for short periods, so for them relaxed homeothermy is part of their strategy for maintaining activity during the day. Burrow-dwelling rodents can readily unload small amounts of stored heat by returning to cool burrows periodically.
(b) True. Exposure of bare skin to the heat of solar radiation would promote evaporative water loss. The coat insulates the skin from this intake of heat by reflecting solar radiation and in its absence, water loss is likely to increase. Note that the coat must not be so thick that it impedes the effective vaporization of water on the skin and a relevant point here is that many camels have a thin uneven coat (Figure 37) with thicker fur on the back and sparse fur on the sides.
(c) False. Measured BMR for hoopoe larks acclimated to T a 15°C in the laboratory was at 46.8 kJ day–1, close to that measured for a temperate species, the woodlark, 49.4 kJ day–1. This example illustrates the importance of awareness of phenotypic flexibility and the need to draw comparisons between more than two species in order to prove that a feature of a desert species is adaptive.
(d) False. Larger animals tend to rely more on sweating than on panting but panting is observed in some reptiles and is important in most birds, even those species that live in deserts.
(e) False. Although behavioural responses form the major thermoregulatory strategies of reptiles, these animals have autonomic responses too, including vasoconstriction, vasodilation and panting. Birds and mammals also respond to heat stresses by behaviour, thereby making savings of evaporative water loss and energy. In all three groups, reptiles, birds and mammals, both behavioural and autonomic responses have a role.
Question 3
The following strategies (a)–(f) are adopted by various desert-dwelling species.
(a) the avoidance of heat by burrowing or moving into shade;
(b) the production of concentrated urine and/or uric acid;
(c) a pelage or feathers providing substantial insulation;
(d) a high-threshold T b for onset of sweating;
(e) heat storage;
(f) radiative or conductive heat loss from extensive surfaces of bare skin.
Which of these strategies do the following animals employ?
jack rabbit
oryx
hoopoe lark
desert reptiles
kangaroo rat
camel
Answer
Jack rabbits use (a), (f) and possibly (b). Insulation (c) would not be effective in a relatively small animal, and the heat storage effect (e) would be useful for a short time only. Sweating (d) is not an option for small species because they have a large surface area to volume ratio and would lose too much water.
The oryx uses (a) moving into shade during hot summer days, and (e) heat storage. No information is available about whether the species produces concentrated urine, but this is likely. Oryx do not have a thick pelage so (c) is unlikely and lack of bare skin means (f) is not possible.
The hoopoe lark uses (a) moving into burrows on hot summer days, (b) production of uric acid which involves very little water loss, and also (f) losing heat by conduction from bare skin surfaces. Insulation (c) and heat storage (e) are not effective for such a small bird. Birds do not sweat (d), although there is some evaporative cooling by evaporation of water from the skin.
Reptiles use (a) and excrete uric acid (b). Options (c) and (d) are not possible in reptiles; (e) is unlikely although T b of desert reptiles, e.g. Dipsosaurus, can reach high levels that would not be tolerated by most mammals. (f) is used but all reptilian skin is bare!
Kangaroo rats use (a) and (b). A small animal is unlikely to rely on (c) and (e) and kangaroo rats cannot sweat (d). Kangaroo rats are nocturnal and remain in burrows during the day so (f) is not used.
The camel uses (b), (c) (d) and (e). Use of shade when possible (a) is probably important too. The coat of camels makes (f) unlikely although short-coated species have sparse fur on their sides through which bare skin can be seen.
Question 4
(a) Researchers measured significantly lower whole body BMR in wild-caught individuals of a desert-dwelling rodent, compared to BMR measured in a closely related species living in temperate woodland. Why would a lower BMR be an advantage to a desert-dwelling species?
(b) It is tempting to assume that lower measured values of BMR in desert species represent an evolutionary adaptation. What other processes could result in lower BMR for a desert mammal?
Answer
(a) If BMR is comparatively low, the amount of heat generated internally by metabolism is decreased which lessens the total heat load in a stressful environment. Water loss is reduced as less is evaporated to cool the body. In a hot, arid environment where food may be in short supply, low BMR would reduce daily energy demand.
(b) Phenotypic plasticity, the process by which individual features of physiology are shaped during development, can cause variation in BMR between individuals. Variations resulting from phenotypic flexibility are usually fixed for life. Phenotypic flexibility or acclimatization, the capacity of an animal to vary physiological parameters in response to environmental stresses, may alter BMR. Williams and Tieleman’s work on hoopoe larks showed that at thermoneutral T a , larks acclimated to T a of 15°C had a significantly lower BMR than individuals acclimated to 36°C (Table 5).
Question 5
Researchers investigated the hypothesis that the skin of a desert lizard shows certain properties that confer thermal resistance, thereby slowing down the rate of heating of the body when the lizard is in full sun. An experiment was designed in which the percentage of solar heat gain in intact live lizards was compared with heat gain in isolated lizard skin preparations. The researchers found that the percentage solar heat gain in the isolated skin preparations was significantly greater than that in the live animals. They concluded that the skin in live animals has physiological and physical properties that confer resistance to solar heat gain.
Write a critique of this experiment and suggest an experimental design that would improve the validity of the results.
Answer
The problem with the experimental design is that the researchers are comparing solar heat gain in two completely different situations. An isolated skin preparation has a huge surface area to volume ratio and would inevitably warm up very quickly in the sun (and dry up). In the intact live animal, the skin is part of a whole larger body. Therefore, the physical properties of the isolated skin are not the same as those for skin in a live animal. It is inevitable that isolated skin would not have any physiological properties; in contrast, in the whole animal, a number of physiological processes could come into play to reduce solar heat gain. Vasoconstriction would slow transfer of solar heat to the rest of the body. The skin may become paler in colour, which also slows down heat gain.
A better design would involve using either a model of the animal or a mounted preserved specimen of the same size as the live specimen. Thermistors just below the ‘skin’ and in the deep body of the model or preserved specimen, and the intact animal, can be used to monitor heat gain just below the skin and in the body core.
Question 6
Williams et al. measured BMR and FMR in oryx living in the Mahazat as-Sayd nature reserve in the Arabian desert. The results are summarised in Section 3.4. The researchers then compiled data from the literature for minimum resting metabolic rate for 15 species grouped in the Artiodactyla, ranging from the mouse deer with body mass just 1.61 kg and dik-dik at 43.97 kg to moose weighing 325 kg and camel 407 kg. Values for whole body BMR of each species were plotted against body mass in kg (Figure 49).
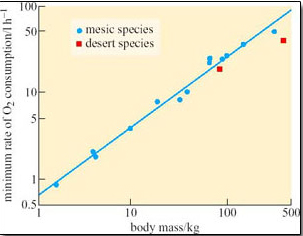
Describe the data in Figure 49. Do the data for oryx and camel suggest that the desert species have a lower BMR than the other 13 species? Note that the graph is a logarithmic plot, in which the values on the axes increase by factors of 10. You should interpret this graph as you would for any plot.
Answer
BMR increases linearly with body mass for the 15 species. An artiodactyl weighing 100 kg has a BMR of about 25 litres O2 h–1. The values of BMR and body mass of the oryx are almost on the plotted line suggesting that oryx do not have an unusually low BMR. The camel is a little below the plotted line, suggesting a trend for reduced BMR in this species.
Now that you have completed this course, you may be interested in the companion course Animals at the extreme: hibernation and torpor (S324_2), which builds on and develops some of the science you have studied here.
References
Acknowledgements
The content acknowledged below is Proprietary (see terms and conditions) and is used under licence.
Grateful acknowledgement is made to the following sources for permission to reproduce material in this course:
Course image: Joshua Tree National Park in Flickr made available under Creative Commons Public Domain 1.0 Licence.
Table 6 Williams et al. (2001) 'Seasonal variation in energy expenditure …’ Journal of Experimental Biology, 204. Copyright © Company of Biologists Ltd;
Table 8 Mueller, P. and Diamond, J. (2001) Metabolic rate and environmental productivity: well-provisioned animals evolved to run and idle fast. Proceedings of the National Academy of Sciences, 98 (22). National Academy of Sciences.
Figure 1 Willmer et al. (2000) The occurrence of deserts on a worldwide basis …, Environmental Physiology of Animals, Chapter 14. Blackwell Science Limited;
Figure 2 Marion Hall, The Open University;
Figure 3 Science Photo Library;
Figures 4-7 David Robinson, The Open University;
Figure 8 Willmer, P., Stone, G. and Johnston, I. (2000) Environmental Physiology of Animals. Blackwell Science Limited;
Figure 10 Robinson, M. (1999) Water-holding frog …, A Field Guide to Frogs of Australia, p. 76. New Holland Publishers;
Figure 11 Robinson, M. (1999) Family Myobatrachidae, A Field Guide to Frogs of Australia. New Holland Publishers;
Figure 13 & 15 Dr Peter Davies;
Figure 14 Wardene Weisser/Ardea;
Figure 16 Brad Alexander;
Figure 17 Louw, G.N. (1993) Temperature and thermoregulation, Physiological Animal Ecology, Longman Group UK Ltd;
Figure 18 NHPA/Rod Planck;
Figure 19 Bulova, S.J. (2002) How temperature, humidity …, Journal of Thermal Biology, 27. Elsevier Science;
Figure 20 Dr Lloyd Glenn Ingles, California Academy of Sciences;
Figure 21 Courtesy of Texas Parks & Wildlife Dept Copyright © 2003 Glen Mills;
Figure 22 Based on Folk, G.E. (1974) Textbook of Environmental Physiology (2nd edn), Lea and Febiger;
Figure 23 Kenneth W. Fink/Ardea London Ltd;
Figure 24 Dr Joseph B. Williams;
Figure 25 Williams, J.B. (2002) Energy expenditure and water flux …, Functional Ecology, 15 British Ecological Society;
Figure 31 Withers, P.C. (1992) Comparative Animal Physiology. Saunders College Publishing, Fort Worth;
Figures 32 & 33 Taylor, C. (1977) Exercise and environmental heat loads. International Review of Physiology: Environmental Physiology II, 15. University Park Press;
Figure 34 Irene Tieleman;
Figure 36 Redrawn from Gordon, M.S. (1977) Animal Physiology: Principles and adaptations (3rd edn). Macmillan Publishing, New York;
Figure 42 Pockley, G. (2001) Heat shock proteins in health and disease …, Expert Reviews in Molecular Medicine. Cambridge University Press;
Figures 43 & 44 Zatsepina et al. (2000) Thermotolerant desert lizards …, Journal of Experimental Biology, 203. Copyright © Company of Biologists Ltd;
Figure 45 Mueller, P. and Diamond, J. (2001) Metabolic rate and environmental productivity: well provisioned animals evolved to run and isle fast. Proceedings of the National Academy of Sciences. 98 (22) National Academy of Sciences;
Figures 46 & 47 Tieleman, I. et al. adaptation of metabolism and evaporative water loss …, Proceedings of the Royal Society of London, 270. The Royal Society;
Figure 48 Willmer, P. Stone, G. and Johnston, I (2000) Environmental Physiology of Animals. Blackwell Science Limited;
Figure 49 Williams, J.B. et al. (2001) Seasonal variation in energy expenditure, water flux and flood consumption of Arabian oryx, Oryx Leucoryx, Journal of Experimental Biology, 204. Copyright © Company of Biologists Ltd.
Don't miss out:
If reading this text has inspired you to learn more, you may be interested in joining the millions of people who discover our free learning resources and qualifications by visiting The Open University - www.open.edu/ openlearn/ free-courses