Systems modelling
Use 'Print preview' to check the number of pages and printer settings.
Print functionality varies between browsers.
Printable page generated Tuesday, 9 June 2026, 2:24 PM
Systems modelling
Introduction
Maps and plans, architects‗ and engineers‗ drawings, graphs and tables: all are models we use in everyday life. This course will introduce you to the modelling process enabling you to recognise that systems models may be used in different ways as part of a process for: improving understanding of a situation; identifying problems or formulating opportunities and supporting decision making.
This OpenLearn course provides a sample of level 1 study in Computing & IT
Learning outcomes
After studying this course, you should be able to:
describe and use a general classification of models
outline and discuss the process of systems modelling, where models are used as part of a systemic approach to a range of different situations
recognise that systems models may be used in different ways as part of a process for: improving understanding of a situation; identifying problems or formulating opportunities; supporting decision making.
1 Preamble
I have assumed that you have come to this course because you are interested in the use of models as part of a systems or systemic approach to some situation. This means that I expect certain things of you:
You to have an interest in understanding and interacting with some situation which you find puzzling, intriguing, worrying or which you are trying to manage.
You believe the situation involves more than just a single process like the manufacture of a product such as concrete, or a cake, where the properties of the product can be altered in a predictable way by changing the ingredients or the processing used. It is likely to be a situation in which there is more than one person involved and where the result of any action cannot simply be predicted by common sense, or by a simple mathematical manipulation of a few numbers.
You are already using, or want to learn how to use, some systems-based approach to working with the situation in which you are interested.
You are aware of how a systems approach differs from other approaches commonly used in scientific analysis, sociology or business management.
In order to get the most out of this course, you need to be familiar with, or at least not worried by, simple mathematics, and recognise some related concepts such as chance and probability. Working through the first self-assessment question (SAQ) will give you an indication of the skills and attitudes involved. If you find you are having a lot of difficulty with SAQ 1, put this course aside and select a more appropriate course from the topic list.
SAQ 1
-
Define what you understand by a system.
-
Describe why you are interested in studying Systems, as opposed to physics, chemistry, engineering or a social science.
-
Describe in words what the graphs in figures 1 and 2 below tell you, and comment on any features of the way that they are drawn, which you think are important.
-
What does rate of change mean?
-
Describe in words the following:
y = 24x 2 + 2x - 3
-
Calculate
Answer
-
For the purposes of this course the definition used has four parts:
-
A system is an assembly of components, connected together in an organised way.
-
The components are affected by being in the system, and are changed if they leave it.
-
The assembly of components does something.
-
The assembly has been identified by someone as being of interest.
-
-
Obviously, I cannot provide an answer which describes your particular reasons, but I would expect you to mention things such as an interest in complicated situations, a recognition that many of the phenomena with which we have to deal regularly cannot be explained on the basis of simple causes and effects and a recognition that peoples’ perceptions of situations will often be different. None of these is explicitly recognised by the conventional sciences such as physics or chemistry. Engineers have to deal with complicated situations, but generally do not concern themselves with human perceptions of situations. Social scientists are usually more concerned with analysis than with taking action, which is usually one aspect of systems work.
-
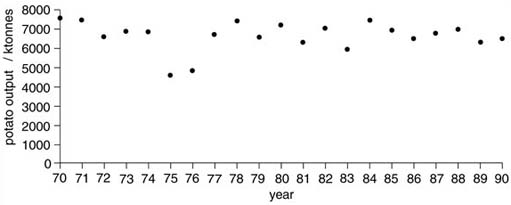
(a) Figure 1 is a graph of the output of potatoes, with one value plotted for each of the years '70–'90. In this case, it was 1970 to 1990, although you could not be sure of this from the graph. The output is given in kilotonnes (ktonnes), that is thousands of tonnes. The overall impression is that the output varies about a value of 7 million tonnes, although in two cases, 1975 and 1976, the values are much lower. (The data are actually for the UK, and 1975 and 1976 were years of low rainfall, when potato crops were badly affected.)
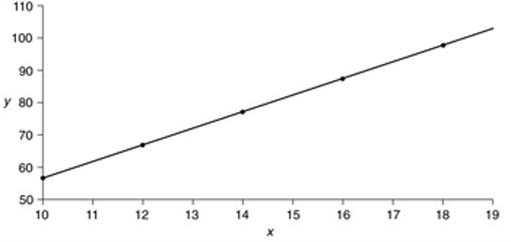
(b) Figure 2 is a much simpler looking graph, which shows that something (y) increases as the quantity on the horizontal (x) axis increases. The graph is a straight line, so that formally, we can say that x and y are linearly related. In this case, they are related by the equation y = 5x + 7. There are some interesting contrasts between the two graphs, apart from the obvious ones of shape. The potato data are plotted with the whole scale from 0 to 7000 shown on the vertical, left-hand axis. This is usually the better way to plot such data, although you will see that Figure 2 is plotted so that the vertical axis only runs from just below the lowest value (57) to just above the highest (107). This tends to exaggerate the changes that occur, and could be misleading in certain circumstances. Note also that in Figure 3, the individual points are joined up, whereas in Figure 1, they are not. The reason for this is that in Figure 2, there is a corresponding value for y for any and every value of x. Potatoes are harvested over a relatively short period, so the data presented in Figure 1 are the total for a given year. Joining up the points would be misleading, since it would imply that there is a value for year 73.5, which is clearly nonsense. It might be better to plot Figure 1 as a bar chart.
-
Rate of change refers to the amount by which something changes per unit of something else. Usually, it is per unit of time. So, a familiar example is acceleration, which is the rate of change of speed. Consider, for example, a car which accelerates from 50 km/h to 100 km/h in 10 seconds. This changes its speed by 50 km/h, so its rate of change (its acceleration) is 10 km/h per second. In looking at any system that changes with time, the rate of change is often as important as the absolute amount of change.
-
This is another equation, which formally states the relationship between two items each of which can take a range of numerical values. These two items are formally called variables, and are represented by the italicised y and x. The variable y is called the dependent variable, which is related to the independent variable x in such a way that the value of y is 24 times the value of x squared, plus 2 times the value of x minus 3.
The 24 in this equation is called the coefficient, or multiplier of x, and the 3 is another coefficient, this time a constant.
-
This expression requires you to multiply 1.3 by 25, and to divide the result by 100 (102 is 10 squared, or 10 × 10). The answer is 0.325.
2 An introduction to models
2.1 Defining ‘model’
The word ‘model’ has a range of colloquial and technical interpretations, so we need first to establish the way in which this course uses the term. As a start, we might suggest that a model is a simplified representation of reality, but even that simple definition raises some quite significant philosophical questions. A profound question is ‘what is reality?’ and I will briefly mention the distinction between modern and postmodern views of this later as an aside. Without getting into such deep philosophical water, it is important to recognise that in general, a model is usually a rather personal or subjective thing. It may be better to define it as a simplified representation of some person's or group's view of some situation. We also need to expand the simple definition further, to stress that the sorts of models we are dealing with here are intended for some purpose. That purpose could be as limited as ‘to summarise my understanding of something’, but in the present context, we are specifically concerned with modelling as part of the skill of thinking and acting systemically. For this course, a fuller definition of a systems model, and the one we are going to use is:
A simplified representation of some person's or group's view of a situation, constructed to assist in working with that situation in a systemic manner.
Although you may not immediately think of them as such, we regularly use models in everyday life. For example, maps and plans are models of the layout of the roads, rivers, buildings or other features of our physical environment. An architect's sketch, or an engineering drawing is a model of some artefact which is to be constructed. Prior to constructing that artefact, we may be shown a scale model of it in order to test our reactions, or to see how it might operate. Photographs are models of the scene that the camera user saw when the shutter was pressed. Sculptures or paintings are also models, in that they are representations of some aspect of the world as it is interpreted by their creators. The graphs and tables used to sell financial products are models of the expected performance of those products, and at the national level, we are told that Government has a model of ‘the economy’ on which it bases decisions about tax rates, interest rates and other aspects of fiscal policy.
At a more fundamental level, all our interactions with the world around us depend on our internal, mental models of how we perceive that world. It is worthwhile pausing for a moment to consider the importance of this.
2.2 Mental models: implicit and explicit
We all have mental models of the world in which we live. We have mental models of ‘how X will react if I ask her to do a particular job’, of what would be ‘a nice holiday’, ‘what should happen if I turn up the thermostat on this heater’ and so on. Virtually all these models are so taken-for-granted that we do not even realise that they are models, i.e. that they are simplifications of the complexity around us. The significance of these implicit mental models is that they constrain and determine what we perceive in the world about us – how we think about situations, people, organisations and problems. This in turn affects how we act, often with important consequences. Box 1 gives two examples of implicit mental models affecting behaviour.
Box 1 Implicit mental models
Example 1 A friend of mine was an immigrant to Australia in 1950 when she was three years old. She was there until she was twenty four, so all her education was within the Australian system. She was taught that Australian history started in 1770 when Captain Cook discovered Australia. She learnt about the first convict settlements, the first settlers, the explorers who trekked across the outback, opening up trails and discovering Australia. This was the history that all Australian schoolchildren grew up with and it conditioned their mental model of their country. There was no mention of the aborigines, the different tribes and cultures, the genocide carried out by the early settlers and the fact that the aboriginal people had lived in Australia for thousands of years prior to European discovery and settlement. It is no wonder that Australians had a problem with racism and had to painfully correct their own images and understandings of ‘their’ country.
Example 2 Another immigrant to Australia in the 1950s was a Jewish Ukrainian who had survived Stalin's persecution of the Ukrainian peasants in the 1930s, the Ukrainians' persecution of the Jews, the persecution of the Jews and Russians by the Germans, and finally his rejection by Russia on the grounds that all Russians who survived in enemy territory were traitors. When I met him he was, in my view, paranoid. He believed that everyone was out to get him. He would not go out and eat in restaurants for fear of being poisoned. He had made quite a lot of money and rejected all overtures of friendship, especially by women, on the grounds that they were just after his money. His belief that everyone was out to get him, clearly founded in a traumatic personal history, completely dominated all his mental models of others and constrained his life completely.
These examples are comprehensible because you and I are probably not caught in the mental models involved. We can, at least in theory, take the position of a dispassionate observer and see how the complex relationships in which these people lived were poorly represented by their way of thinking about them. But all our conceptualisations of the world are like this, they constrain the way we can think about things. All our categories, our beliefs, ideas, theories are, and have to be, simplifications of the complexity in which we live. The ways in which these implicit mental models constrain us only become apparent when compared to a different model or categorisation or theory. I remember being quite startled when I was told that the Inuit of North America had many different words for snow. Here was a thing (one thing) in my conceptualisation of the world, which another group of people found helpful to divide into many different categories. As another example, there are over 100 different species of grass in the UK although to most of us, a field of grass just looks like a uniform carpet of similarly shaped leaves.
So we all have these implicit mental models of things, people, organisations and so on. Because these models affect our perception of the world they become self-sealing. By this I mean that the mental model dictates the type of information that the person will perceive and that these perceptions will then reinforce the original belief. My paranoid associate in Australia believes that everyone is out to get him and that no one likes him; as evidence he points out that people are not friendly towards him, do not come and visit him and are often argumentative with him. If you knew him you would probably find it hard to like him and would get drawn quite quickly into an argument with him! That's what self-sealing systems are like. And we are all affected by systems of this type all the time – we just do not see them because we are ‘in them’.
At this point you may be following the logic of what is being said but feel rather dubious about some of the grandiose conclusions that are being drawn. Box 2 and Box 3 give more recent examples much closer to our own time and culture that make the same point.
Box 2 An example in education
One well known educational experiment involved an inspector going into a class, testing all the children and communicating to the class teacher which were the exceptional children that he or she had to look out for over the coming year. A year later the inspector returned to the schools in the trial and discovered that the children identified in the earlier tests had indeed excelled and were regarded as being exceptionally able by the teachers involved. However the names of the children communicated to the teachers were not those who had scored highly in the tests! The names given to the teachers were random names from around the middle of the ranking of the children. Their observed improvement over the year was determined by the teacher's perception of them, not due to any latent genius discovered in the tests.
This example illustrates how important are our implicit models of other people. Although most people can see how a teacher's opinion of a pupil could have a major influence on the child's development, they are much less willing to see or understand that their own mental models of members of their family and work colleagues largely determines the quality of these relationships. In practice the quality of people's lives is dominated by the implicit models they hold of those with whom they interact most regularly – and they will have hoards of evidence to persuade you that their models of these people are correct.
Box 3 An example from management
A company organised a day where the Board of Directors and the Management Team were to discuss future strategy for the company. To get things moving the group started by drawing (rich) pictures of the situation as each perceived it. Virtually all the management team's pictures represented the government as the biggest problem to be dealt with. The other Directors were stunned. They pointed out that 50 per cent of the company's income derived directly from government-funded projects and that all the rest of the business was driven by government initiatives that required firms and organisations to comply with environmental legislation! The Directors were successful in helping the management team revise their model of the role of government in the business. With a new model the management were then able to work with the legislation, to build on the projects that were funded by the government and so expand the business very effectively.
The last example explains something of why I have laboured this topic within this modelling pack. One of the significant benefits from any kind of systems modelling activity is that it enables implicit models to be made explicit to some degree. Often, those implicit models that most constrain our thinking, perception and behaviour, are the ones that will benefit from becoming explicit, open to question, discussion and development. By making implicit models explicit people can often find ways out of the traps and difficulties in which they find themselves, and this is one reason why modelling is such an important part of systems work.
The idea of making explicit our implicit models of ‘reality’ is central to understanding the distinction between modern and postmodern outlooks, as explained in Box 4.
Box 4 An aside ‘ reality’ in modernism and postmodernism
The modernist tradition rejected the mythical and religious views of the world and gave rise to science, democracy, liberation movements and a belief in the supremacy of rationality. Within this tradition there was an implicit belief that there existed a given external reality and that the task of all enquiry was to develop a better and better model (or map) of that external reality.
The postmodernist perspective is that the assumption about a pre-given external reality is not valid, especially in the domain of human culture, values, beliefs and organisations. In general, and particularly in these social domains, it is impossible for anyone to have a model of reality that does not constrain their perception in some way. So while postmodernists do not say that there is not an external reality, they would claim that it is impossible to have an unbiased perspective on what it is.
SAQ 2
Think of some activities or events with which you are currently involved. Identify an example where you have found yourself acting on the basis of a mental model that you now recognise (or even recognised at the time!) as inadequate, and resulting in a ‘self-sealing’ outcome.
Answer
Your answer to this will depend on your experience, but most interactions in organisations can provide examples. Individuals within an organisation often have official or unofficial roles, such as ‘manager’, ‘administrator’ (or, from another perspective ‘bureaucrat’), ‘shopfloor worker’, etc. Each of these roles carries with it certain expected behaviours, and the actual behaviour of an individual is then often interpreted in terms of these expectations. An example is my rather pejorative use of the word ‘bureaucrat’ rather than ‘administrator’. I tend to see administrators as persons who have to have a complex set of rules governing all activities, and to be unable to show any flexibility in interpreting these rules. So, when I want to do something which I suspect does not appear to fit within the given rules, I try to avoid consulting the administrators on the grounds that they are bound to say no, and try to work round them. This sometimes works, but sometimes creates all sorts of unexpected difficulties with other aspects of administration, thereby confirming my prejudices. However, when I have abandoned these stereotypes, and actually consulted some administrators, they have often been able to point out that there are perfectly acceptable and legitimate ways to do exactly what is needed!
Another area of self-sealing models often occurs in gender or racial stereotypes, leading to misinterpretations and prejudice.
2.3 Some general categories of model
The preceding text has probably suggested several examples of different types of model to you, and at a very broad level, we can categorise the sorts of model we are likely to use in systems work as
Mental models: We have already seen how the ways in which we think and act are shaped by these. As well as the internal representations discussed in Section 2.1, mental models also include language and linguistic models, in particular the metaphors that we use in thinking and talking about situations. Many of these are so common that we lose sight of the fact that they are just metaphors, such as ‘getting to the heart of the matter’, or ‘the bottom line on this is …’. Verbal models are important both as the external representation of our (internal) mental models, and probably as part of the thinking process itself.
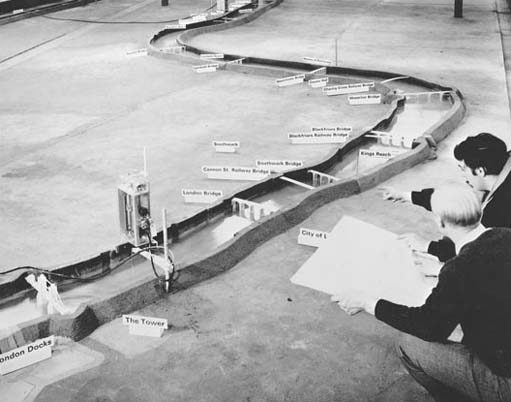
Iconic models: Here, we use some physical material to represent physical aspects of a situation, as in scale models of new products or developments. For example the shape or pattern may be similar, but the scale may be changed, or different materials may be used. Whichever is the case, there is usually a strong visual resemblance between the original and the model. Figure 3 is such a model, actually used to investigate the possible effects of a barrage across an estuary.
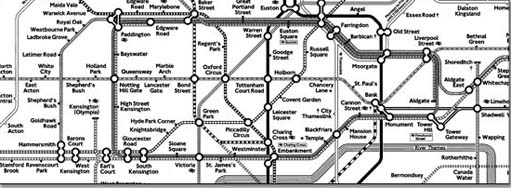
Graphical models: There is a wide range of two-dimensional representations which can be used in systems modelling. They include photographs, maps and plans and other different sorts of two-dimensional diagrams. Figure 4 is a famous example which will be familiar to most UK citizens, and has been a model (in a slightly different sense of the word from the one we are using it in this course) for similar maps elsewhere in the world.
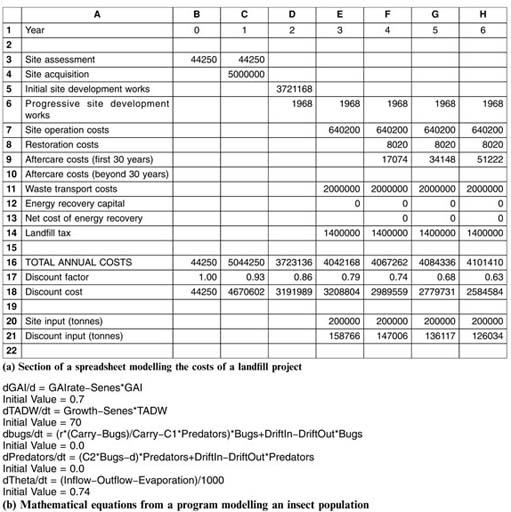
Quantitative (mathematical) models: These models can appear to be extremely powerful and sophisticated, and sometimes, ‘modelling’ is taken to imply only mathematical models. They make use of mathematical techniques to calculate numerical values for the properties of the defined system, and can be used to explore the results of different possible actions. Figure 5 shows two examples.
You have probably encountered examples of these different categories of model in various contexts, but in this pack, we are going to look specifically at the role of modelling within an overall systems framework.
SAQ 3
Categorise each of the following examples using the groupings given above.
-
A one-third scale model steam traction engine
-
A cross-section through a new building
-
‘The market’
-
A set of company accounts.
Answer
-
The steam engine is clearly an iconic model. It is a different size from the original, but is the same shape and probably uses many of the same materials.
-
A graphical model.
-
The concept of a market, as used by advocates of ‘the free market’ is a mental model. However, some economists have also created mathematical models of markets, which they claim behave in a similar way to the mass of buying and selling transactions which occur between people.
-
These are a mathematical model of the cash flows in an organisation. Some of the transactions actually take place, while some items, like depreciation, do not necessarily involve flows of money in any one year, but are purely notional.
2.4 Models as part of systems work
Thinking systemically involves identifying systems relevant to some situation, and models are invariably used as part of this process. An example of this forms part of Checklands' Soft Systems Methodology (SSM) (Checkland, 1981). One aspect of this methodology concerns the formulation of a root definition of some system that is relevant to the situation of interest and the construction of a conceptual model of this system. The root definition is a concise, verbal description of what a system does, or is supposed to do. The conceptual model then consists of a series of verbs, which define the activities essential to achieve whatever it is that the system is required to do.
So, to take an extremely naive and simple example, let's consider the situation in which I find myself as I write this, in the room that I use as an office at home. It is freezing outside, and my room is not at what I consider to be a very comfortable temperature. I can switch on an electric heater, but then if I leave the room for a period, with the heater running, it may be too hot when I get back, and the window will have to be opened, wasting all that expensive electricity! Pretty clearly, there is a need for a system to control the temperature of the room at or near a desired level. From general knowledge and experience in the UK, we probably have a mental model of such a system, perhaps comprising a radiator, plumbing, a boiler, room thermostat, etc. This would actually be just one physical realisation of such a system, and would only be appropriate to particular circumstances. It might not, for example, be relevant if my room only has an electricity supply, and it would also not be relevant to a climate such as southern Europe, or parts of the USA, where cooling, rather than heating, might be needed. Constructing a conceptual model of the system required by the root definition forces us to consider the fundamental activities that such a system must carry out, independently of any particular physical realisation of that system. It is purely a conceptual model, which can underlie all sorts of different physical realisations. Checkland (1981) describes the distinction thus:
… the conceptual model is a statement of what is logically and necessarily implied by the [root] definition. It is not a recommendation of what ought to exist nor of what does exist in the real [sic] situation.
So, in this case, my conceptual model of the system would require it to involve the following activities:
-
know the desired temperature
-
sense the current temperature
-
compare the current and desired temperatures
-
use energy (to change the temperature) if the desired and current temperatures are different.
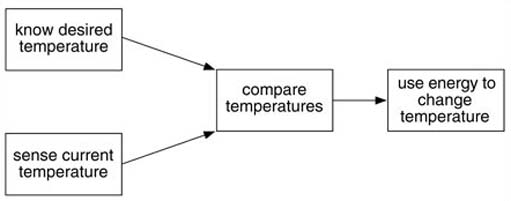
From general knowledge, you should be able to work out that if any of these activities is missing, then the system cannot operate as required. The model allows for both heating and cooling, and only specifies that a source of energy is needed to fulfil its activities.
This type of model relies on the use of verbs (‘know, sense, etc.’) but can also involve diagrams that show the logical or sequential relationship between the activity verbs. So, in the case of the temperature control system, the action of comparing can only occur if both the temperatures are known, and using energy only occurs as a result of the comparison. So the verbs need to be linked logically as shown in Figure 6.
While this example is relatively trivial and straightforward, it does illustrate some of the important aspects of both this particular modelling method, and the process in general. The conceptual model is related to, but does not necessarily represent, any existing system. In this case, it is at a very abstract level, and it draws on knowledge of basic physics and engineering to set up the essential characteristics of a system that needs to be designed. So the model sets a fundamental minimum set of activities that has to be present, but does not constrain the physical implementation at this stage. Obviously, if we wanted to go on to design and implement an actual system for my room, other aspects of the real situation would have to be incorporated, but the fundamental model would still be valid. This is a characteristic of the models most useful in systems work, which will generally operate in a large number of contexts and need not be tied to specific situations. In this pack we will be examining the quantitative models that have this property.
2.5 A model of systems modelling
Much, if not most quantitative modelling is carried out in the context of engineering, business and financial studies. These uses of quantitative models are usually not part of a systems approach. Furthermore much of the modelling carried out in systems studies is not quantitative, since issues can often be resolved by using diagrammatic or conceptual models. It is therefore important to clarify the systems context in which modelling in general, and quantitative modelling in particular, will be carried out.
To explore the overall process of using models in systems work, we can use a conceptual model. To start, we need a description of the system that produces models within systems studies, and then we can build a conceptual model of this. A possible definition of the system is:
A system to represent aspects of some situation of interest to a range of stakeholders, to assist those stakeholders to achieve some purpose(s) relevant to them.
This system definition includes three verbs, represent, assist and achieve. These are the ‘front-line’ activities, and implied by these activity verbs, there is a wide set of further activities. Thus, to represent some situation in an appropriate way, it is necessary to:
-
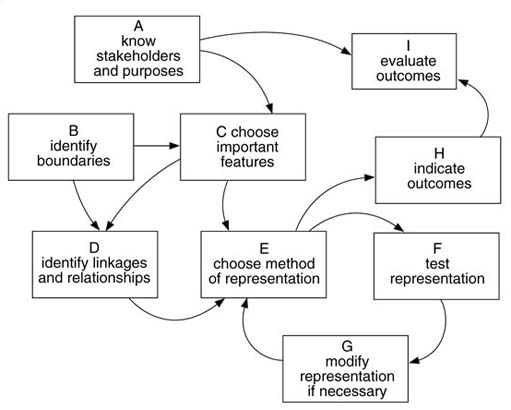
A know the stakeholders and the purposes
-
B identify the boundaries around the situation
-
C choose features of that situation which are important to the stakeholders
-
D identify possible linkages or relationships between these features
-
E choose a suitable way to describe those relationships
-
F test whether the chosen features and relationships are agreed by the stakeholders to be appropriate
-
G modify B–E if the test in F suggests that inappropriate choices have been made and test again.
The end result of a systems study is often to take action. For systems modelling to assist the stakeholders towards this, then it may also have to:
-
H indicate the likely outcome of different possible actions, in terms relevant to the stated purpose(s)
-
I evaluate (i.e. put some value on) the nature of trade-offs between different purposes, so as to indicate the preferred option.
The set of verbs listed above represents the necessary activities of a systems model, and the logical links between them are given in Figure 7.
Drawing diagrams is often a very important way of carrying out activities B to E in the sequence above.
Activity H possibly needs some further explanation. The outcome of any action is usually some change in certain features of the situation. This can take many forms, but usually results in a change in the behaviour of some item or person. Behaviour, in this sense, has a precise meaning referring to the way something changes over time. It could imply something as obvious as the temperature of a room, displayed as a graph, or it could be something much less quantifiable, such as the level of conflict, or morale in an organisation. The phrase ‘the behaviour of the system’ thus refers to changes over time in those aspects of the system which have been identified as being important or relevant. Where aspects of the behaviour are measurable, each of these aspects is usually referred to as a variable, often qualified as a state variable. The whole set of state variables associated with a system then summarises the state of that system under a given set of conditions, in terms relevant to the agreed purpose of the modelling.
The list of activity verbs and the logical linkage between them does not tell us how to do modelling in practice. In order to do any systems modelling, we need to put some flesh on the conceptual model given, to provide one realisation of the activity of systems modelling.
One such realisation is provided in David Lane, Camilla Monefeldt and Jonathan Rosenhead's paper 'Emergency – but no Accident: a system dynamics study of an accident and emergency department'. To access the article click here to go to the website of The Operational Research Society. Once there enter the search terms 'emergency accident lane monefeldt' in the 'site search' box located in the top bar of the page. The paper should be among the top hits provided.
Click on the 'View document' link below to read David Lane, Camilla Monefeldt and Jonathan Rosenhead, on 'Emergency but no accident'.
SAQ 4
To familiarise yourself with the context briefly read the sections up to and including 'Handling complexity with system dynamics' in the 'Emergency – but no accident' paper.
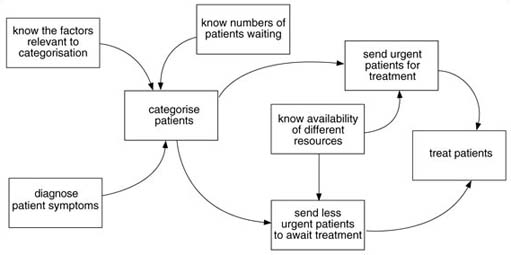
As part of a systems study of a hospital accident and emergency department, the following root definition was produced for one system that the stakeholders thought was relevant to the whole situation:
‘A system to categorise patients entering the accident and emergency department so that hospital resources are committed effectively according to patient needs and patients are treated and sent on appropriately.’
Using the discussion of conceptual models in the preceding text as a guide
-
identify the important verbs in this root definition
-
draw up a conceptual model of a system which conforms to this root definition.
Answer
-
There are four actual verbs in the definition: categorise, commit, treat and send on.
-
These verbs all imply a range of other activities, which need to be specified to produce a useful conceptual model. So, to categorise patients, it is necessary to know the features of the categories, and of the patients. To commit resources, it is necessary to know what resources are available, and to match them to the needs. To treat and send on patients, it is necessary to select treatments, to know what resources they need and to use these resources to carry out the treatments. One version of a more developed conceptual model including these verbs is given in Figure 8.
3 Systems modelling in practice
3.1 The steps to systems modelling
Systems modelling in practice usually involves six broad steps, within each of which there may be many subsidiary steps and some checking and revision. There is also likely to be iteration back to the earlier steps, as issues which call for changes in earlier decisions are uncovered.
Nevertheless, in my experience, the following six steps are likely to cover the basics.
-
Identify the system of interest, in particular specify the system boundary and specify the level of detail in which you (and other participants or stakeholders) are interested. This usually involves specifying what are to be considered sub-systems or elements within the overall system. Another way of expressing this is the level of aggregation of the system. For example, is it relevant to describe what happens to each person in a particular system, or would some average (an aggregate measure) be more appropriate?
-
Recognise the purpose of the systems study, and identify the purpose of the modelling activity within it. The most common purposes of systems studies are:
-
improving understanding of a situation
-
identifying problems or formulating opportunities
-
supporting decision making.
Modelling can be used to support all of these – by predicting system behaviour, by predicting the outcome of an intervention or by providing a basis for discussion or dialogue. This should lead to increased understanding.
-
-
From items 1 and 2 above, identify the main features or behaviours of the system of interest. These will then become the state variables in the model. By implication this step involves further simplification by specifying areas of the system that can be aggregated together or omitted from the modelling activity. This is a critical step in the process, since omitting an important feature at this stage can decrease, or even destroy, the value of the modelling activity (Box 5 gives an example).
-
Select a modelling technique that will address the features/behaviour of the specified system in a way that matches the specified purpose. After working through this pack, you will begin to see how different techniques are suited to different purposes.
-
Using the rules, techniques, tools and general experience or ‘case law’ of the selected modelling technique, develop an outline of a suitable model. Use this outline to check compliance with items 1, 2 and 3 above – or modify the model or adjust the specifications in items 1, 2 or 3.
-
Develop a full version of the model by a process of iteration, expansion and inclusion of detailed data as required.
Box 5 Omissions from the model
A topical example at the time of writing (1999) is the debate over the introduction of genetically modified (GM) foods into the UK. The models used to support their introduction include estimates of the likely economic and nutritional benefits to the UK, and of the health risks involved (which are believed to be very small). However, these models did not include any consideration of the potential effects of GM crops, from which the foods would be produced, on the wildlife of farmland. This omission has been one major contributor to the acrimony of the debate, and the rejection by a substantial minority of the entire argument in favour of such crops.
SAQ 5
Look at each of the stages of the process listed as 1–6 above, and explain how each relates to the specified activities (verbs) of the conceptual model set out at the beginning of Section 2.5.
Answer
My mapping of the stages of the actual mathematical modelling process against the conceptual model is given below:
| Stage of process | Activities in conceptual model |
|---|---|
| 1. Identify the system of interest | A, B, C, D |
| 2. Identify purpose of activity | A (C?) |
| 3. Identify features to be modelled | B,C,D,E |
| 4. Choose technique | E |
| 5. Develop outline | F, G, E |
| 6. Develop full version of model | E, F, G, H, |
A key feature both of the conceptual model and the practical sequence is that of choosing a method of modelling. This step is crucial, for several reasons. As you will see as you work through the rest of this pack, each of the different modelling techniques can be more or less appropriate for different situations, and for different types of system which have been identified. In the succeeding material, we will return regularly to this question of choosing an appropriate model from among a range of quantitative techniques. But first, we need to consider when it is even appropriate to think about using any form of quantit
3.2 Why quantitative models
The stage of choosing a model could include consideration of diagrams or conceptual models as well as quantitative models. So when should you consider a quantitative model as the appropriate next step? There are four main conditions that are necessary for a quantitative model to be an appropriate choice.
-
At the chosen level of aggregation, all the significant features or behaviours of the system must be adequately quantified, i.e. measured. If this condition is not satisfied then any model will have to impute numerical values for the unqualified features or behaviours, which can lead to distortions in any conclusions derived from the model. Even where all the important issues are quantified, there are other issues associated with data that may preclude the use of a quantitative model. In particular, if the data are unreliable, or are extremely expensive in time or money to collect, then quantitative modelling may not be feasible.
-
The purpose should involve a level of discrimination or differentiation that can only be achieved by quantitative comparisons. There are many of these, for example:
-
Which is the most effective intervention?
-
When will this behaviour become manifest?
-
How many cases of each illness should we expect next month?
If the main purpose can be accomplished without a quantitative model then seek the answer non-quantitatively. The reason for this is that the sheer complexity and data gathering required for most quantitative models can only be justified if it is essential. Also the process of converting the problem into mathematical form and then interpreting the answers back from a numerical output may obscure the core systems issues.
-
-
Where the system of interest involves a significant number of interacting feedback loops at the level of aggregation required. That is, a situation where the behaviour of X affects the behaviour of Y, and the behaviour of Y also affects the behaviour of X. Almost by definition all systems involve interacting feedback loops, but in most cases they do not need to be explicitly modelled if they are not essential in determining the behaviour of interest. However if the behaviour of interest is directly governed by the interaction of more than three feedback loops you are likely to be forced to use a quantitative model to understand what is going on.
-
Where the behaviour or features of the system of interest are governed by stochastic processes. Stochastic, or random processes are those like the toss of a coin or selection of a card from a pack. Here a range of results is possible, but you cannot know in advance exactly which result will occur although you may know the chance (formally, the probability) of a particular result occurring. In such a situation you will usually need a model to arrive at a thorough understanding, since it is only by using a model that you can explore the behaviour over and over again with randomly chosen sets of values. Human beings are notoriously bad at predicting the outcomes of systems governed by such stochastic processes. The popularity of gambling, and the interpretations placed on predictions of the weather are examples of this.
SAQ 6
In which of the following situations do you think it would be appropriate to use a quantitative model, and why?
-
Devising a policy to conserve stocks of fish in the North Sea.
-
Determining the best approach to negotiating a merger between two competing companies, from the point of view of one of the companies.
-
Choosing between two different routes for a new road development.
Answer
-
The size of fish stocks is governed by a complex series of feedback loops, including the relationship between fishing activities and fish stock. It would be essential to carry out sufficient quantitative modelling to establish the range of activity that could be sustained, given the available information on the fish and the sea. However this is usually the easiest part of devising a policy that will work!
-
Here quantitative modelling cannot assist in devising the approach to negotiations. There may need to be some calculation of the potential savings and benefits associated with the merger, but these will not be reliable because of the lack of data on the competitor company or on the merged company.
-
This is an area where quantitative modelling, known as cost-benefit analysis, has been widely used to try to establish the relative merits of alternatives. However many of the sensitive factors, such as conserving wildlife, avoiding traffic congestion, reducing accidents and noise, reducing amenity of countryside and so on are not readily quantified in financial terms. The use of cost-benefit models therefore reduces to interminable arguments regarding the imputation of values to these factors. So this is a case where quantitative modelling is used, but probably should not be.
3.3 Types of quantitative systems model
There is a wide range of quantitative models, of varying degrees of sophistication and complication. In this pack, we will only cover those that I think you are likely to encounter in systems studies or could use to good effect. The techniques available subdivide broadly into two major classes, static models and dynamic models. The distinction between these will become clearer as you look at some detailed examples. Essentially, dynamic models are those where the set of calculations comprising the model is repeated a number of times. The initial values of the variables in the current set of calculations are taken from the results of the previous set of calculations, and this process is repeated time and time again. In static models, the calculations are executed once to obtain a result (or set of results). Even where the calculations are repeated, as with stochastic models, the values in each set of calculations is not determined by the previous calculation.
Table 1 gives a list of techniques, under these two broad headings.
| Main category | Sub-types | Examples |
|---|---|---|
| Static | spreadsheet | business planning |
| stochastic spreadsheet | financial models | |
| forecasting | electricity industry | |
| linear programming | diet formulation | |
| decision analysis | decision trees | |
| preference models | Kepner Tregoe | |
| Dynamic | time-stepped | queue models |
| event-driven | process models | |
| stock and flow | system dynamics population models |
Conclusion
This free course provided an introduction to studying Computing & IT. It took you through a series of exercises designed to develop your approach to study and learning at a distance, and helped to improve your confidence as an independent learner.
References
Acknowledgements
Except for third party materials and otherwise stated (see terms and conditions), this content is made available under a Creative Commons Attribution-NonCommercial-ShareAlike 4.0 Licence
Grateful acknowledgement is made to the following sources for permission to reproduce material within this course
Course image: Tom Page in Flickr made available under Creative Commons Attribution-ShareAlike 2.0 Licence.
Figure 3 H. R. Wallingford Limited
Figure 4 © London Transport Museum
Don't miss out:
If reading this text has inspired you to learn more, you may be interested in joining the millions of people who discover our free learning resources and qualifications by visiting The Open University - www.open.edu/ openlearn/ free-courses