Economics explains discrimination in the labour market
Use 'Print preview' to check the number of pages and printer settings.
Print functionality varies between browsers.
Printable page generated Tuesday, 9 June 2026, 9:14 AM
Economics explains discrimination in the labour market
Introduction
This course will give you a stimulating and insightful account of the ways in which economists have tried to understand what labour market discrimination is and what its sources are. Notice the reference to the ‘ways [plural] … economists have tried to understand’. The most basic message of this course is that economics is not a subject in which there is one single correct answer.
This course will also assist you in developing your ability to use and evaluate economic theory, and help you build or improve other academic skills. The evaluative skills developed will help you to begin to form a properly considered view about the merits of the alternative theoretical approaches.
This OpenLearn course provides a sample of Level 2 study in Politics.
Learning outcomes
After studying this course, you should be able to:
understand the main features of the core neoclassical microeconomic theory
give examples of key ideas, theories and debates in microeconomic theory
illustrate a variety of applied economic theories and models to analyse economic problems and events.
1 Synopsis
1.1 A contentious issue
This course discusses a contentious issue in economics: why particular groups, such as women or minority ethnic groups, are disadvantaged in the labour market. It compares different theoretical and empirical explanations for why such systematic labour market disadvantage is experienced by some groups in society.
Click to view 'The neoclassical school of thought and its rivals'
Neoclassical theory would predict that profit-maximisation considerations by competitive firms would ensure that all workers are paid their marginal revenue product. Therefore, if one group of workers is systematically paid less than another it should be that the groups differ in their productivity. If this is not the case and workers of equal productivity are paid differently, then there is discrimination. Therefore, discrimination is due to a failure of competition that allows non-profit maximising behaviour to persist. Two neoclassical theories of how such discrimination could occur are examined in this course. Both explain labour market disadvantage in terms of discrimination against workers who have, or are thought to have, particular characteristics.
Click to view 'The institutional school of thought'.
This course also introduces an alternative institutional approach known as ‘segmented labour market theory’, which views the labour market as a collection of parts or segments. Using the idea of a distinction between primary and secondary labour markets, this theory argues that some groups of workers are restricted to secondary labour market jobs. These workers are then low paid because of the jobs they do. Labour market disadvantage, then, is not due to the characteristics of the workers, but the characteristics of the jobs that they do. The issue then becomes why such different labour markets exist and why particular types of workers are restricted in their access to the better jobs in the primary labour markets.
This course also provides good examples of how different theoretical perspectives lead to different policy prescriptions.
Neoclassical economists believe that making the world more like the characteristics of the neoclassical model of perfect competition will remove many problems. In particular, promoting competition will make discriminating employers go out of business, and improving information about individual workers would help remove statistical discrimination, so that firms did not need to use stereotypes based on group characteristics in deciding whom to employ.
Institutional economists, on the other hand, believe that the causes of labour market disadvantage are structural, built into the institutions of the economy, therefore effort has to be put into tackling the low pay and poor working conditions of secondary labour market jobs. Competition alone will not do this, nor will it remove the barriers that workers trapped in such jobs face in getting into better jobs. Institutionalists would be likely to advocate direct government intervention, possibly by promoting affirmative action or tackling low pay through equal pay legislation. In this case, as one might expect, a theory that sees these causes of labour market disadvantage as institutional promotes an institutional solution.
1.2 Key ideas
Labour market disadvantage can be manifested in a number of differences between the labour market experiences of different groups: differences of pay, of likelihood of unemployment, and differences due to occupational segregation.
Labour market disadvantage and discrimination are not the same thing. Discrimination refers only to those differences between groups of workers that do not correspond to objective characteristics that affect the productivity of these workers or the work they are doing.
If there is discrimination we need an explanation of why it occurs, since competition should eliminate it.
Even if there is no discrimination, we still need to explain why particular groups suffer labour market disadvantage. This might be due to discrimination somewhere else in society, e.g. in education, training opportunities or responsibilities for children.
Institutional theories tend to focus more on explaining why there are some jobs in which workers suffer labour market disadvantage. These workers will have low productivity so will not necessarily be facing pay discrimination. Rather, the labour market disadvantages that these workers face are institutional barriers to moving into better jobs. However, there may other forms of discrimination that explain why members of particular groups face such institutional barriers and so are concentrated in these poor productivity jobs.
Neoclassical theories explain labour market disadvantage by the characteristics of the individuals filling the jobs, and why, for example, such individuals may not have invested in their own human capital. They therefore focus on the supply side of the labour market to explain any labour market disadvantage that is not due to discrimination. They also have theories to explain why some employers may discriminate in their employment practices, for example through lack of information about individuals or a distaste for employing members of certain groups.
Both approaches focus on productivity differences. However, the neoclassical approach sees these as a result of differences between individuals, in inherent abilities or in tastes that lead individuals to invest differently in human capital. The segmented labour market approach, however, emphasises institutional structure as creating jobs of different productivity. Workers adapt to the jobs they can get rather than the other way round.
2 Discrimination in the labour market: introduction
Discrimination can manifest itself in all aspects of life. It may be evident in the type and location of housing available to certain groups, in their access to quality education and health care or how they are treated in the labour market. We will focus on the last of these considerations and, in particular, why the labour market status of some groups of workers is significantly worse than that for the population at large. This does not mean that discrimination in the labour market is a more relevant consideration than other forms of discrimination, nor should it imply that labour market discrimination is independent from other forms of discrimination. Indeed, some economists would argue that a satisfactory explanation of labour market discrimination can only be developed when it is recognised that all forms of discrimination are related.
The fact that some people do better or worse than others in the labour market does not, in itself, signify the presence of discrimination. It would be more surprising if such differences were not observed. What is harder to explain, however, is why particular groups of workers are disadvantaged in the labour market. Why do women and members of minority ethnic groups, for example, face significantly lower wages and poorer employment opportunities as a group? In this course we focus on the general observation that certain characteristics – gender, race, religion, age – actually matter in the labour market when there is no apparent reason why they should.
In the next section we outline the extent to which disadvantage in the labour market varies. There are, of course, many different dimensions to labour market disadvantage. The most obvious is differences in average earnings which may arise either because people from disadvantaged groups are paid less for doing a particular job or because they end up in (or are ‘crowded’ into) low paying jobs. A second dimension of labour market disadvantage is that the level of unemployment is higher for certain groups of workers than for others. Linked to this is the observation that disadvantaged groups are concentrated in jobs with higher turnover rates and greater job insecurity. Finally, some groups may be disadvantaged in terms of the type of work they have access to, with an emphasis on menial and repetitive tasks. Since there are many different ways in which labour market disadvantage can be measured, it is perhaps not surprising that there are also different types of discrimination. The two main types will be considered.
The theories proposed to explain discrimination in the labour market are equally diverse. Differences are reflected not simply in terms of the underlying theoretical framework adopted but also in the particular aspects of labour market behaviour which are focused upon. Explanations which can be grouped under the heading of neoclassical theories focus mainly on the supply side of the labour market, such as the relationship between labour market disadvantage, low productivity and low levels of investment in human capital. Other, non-neoclassical theories, such as segmented labour market theory, concentrate on the limited access certain groups of workers have to ‘good’ jobs (independent of their human capital) and upon why there is segregation in access.
3 Labour market disadvantage
3.1 Gender-based disadvantage
The post-war period has seen a significant increase in the participation of women in the labour market, with women now making up around 45 per cent of the UK workforce. Although women still undertake the major share of family responsibilities and domestic activities, an increasing number of women are entering the labour market. This increase is evident in many countries and has been associated with an improvement in the relative earnings of women. This trend towards greater equality is evident in Table 1, which shows the ratio of female to male earnings in a number of countries over the period 1960–1980.
| 1960 | 1970 | 1980 | |
|---|---|---|---|
| Australia | 0.59 | 0.59 | 0.75 |
| France | 0.64 | 0.67 | 0.71 |
| Germany | 0.65 | 0.69 | 0.72 |
| Italy | 0.73 | 0.74 | 0.83 |
| Japan | 0.46 | 0.54 | 0.54 |
| Netherlands | 0.60 | – | 0.71 |
| Sweden | 0.72 | 0.84 | 0.90 |
| UK | 0.61 | 0.59 | 0.75 |
| USA | 0.66 | 0.65 | 0.66 |
| USSR | 0.70 | 0.70 | 0.70 |
Activity 1
For the period 1960–80, identify:
the country with the largest reduction in inequality
the smallest reduction (or no reduction at all).
Answer
Sweden underwent the biggest reduction in inequality with the ratio of female to male wages increasing from 0.72 to 0.90. Both the USA and the USSR had no change in relative wages.
The labour market is complex and the two observations that more women now participate in the labour market and that there has been a narrowing of relative wage differentials reflect a number of possible relationships. On the one hand, it may be the case that more women participate because female wages have increased over time. On the other hand, the stronger commitment of women to the labour market could, in itself, increase female wages and narrow the earnings differential. Thus, if higher wages and higher participation are statistically associated, there are various views on causation which the labour economist must disentangle.
Despite the improvements that have taken place overtime, however, it would be misleading to overemphasise the advances that have occurred in the relative position of women in the labour market. Nearly 45% of working women in the UK, for example, are employed part-time, at pro-rata wages well below those of full-time workers. According to People Management, ‘Women working on a part-time basis earn only 58% of male full-time workers' pay rates’ (6 February 1997, p. 8).
Data from the New Earnings Survey (1995) reveal that the earnings of women working full-time are also significantly below those of men in comparable jobs. As Table 2 shows, the average weekly earnings of women managers in 1995 was 68 per cent that of men. This ratio, earnings of women to men, of about two-thirds, was reported in six out of nine occupational groups.
| Men (£) | Women (£) | Ratio: women/men % | |
| Managers | 537.00 | 367.80 | 0.68 |
| Professionals | 499.70 | 407.90 | 0.82 |
| Associate professionals | 442.90 | 333.30 | 0.75 |
| Clerical and secretarial | 269.90 | 230.40 | 0.85 |
| Skilled manual | 318.30 | 191.20 | 0.60 |
| Personal services | 296.10 | 198.70 | 0.67 |
| Sales | 310.30 | 199.90 | 0.64 |
| Plant and machine operators | 293.70 | 201.50 | 0.69 |
| Other | 250.50 | 170.80 | 0.68 |
Women may have to wait many years before they achieve equal pay with men. People Management state that, ‘… the average earning discrepancy between men and women remains at around 20 per cent. At the current rate of improvement, women will have to wait until 2040 before they achieve parity’ (6 February 1997, p.16). Also, according to People Management, ‘… surprisingly, the gap remains widest of all in professional occupations. For example, women bank and building society managers earn 36 per cent less than men in similar posts’ (ibid).
That women are paid less within even narrow occupational categories can arise for a number of reasons and does not necessarily involve women being paid less than men for doing the same job. It may reflect the nature of the organisations that employ women or the fact that women are typically employed at lower grades within occupational categories. For example, there is evidence that women academics are appointed at lower points on the university lecturer scale than comparable men and that they are less likely to become senior lecturers, readers and professors (McNabb and Wass, 1997). The failure of women to make significant progress in the professions and in senior management and administrative posts has led to the idea that there is a ‘glass ceiling’ which means that women are under-represented in positions of responsibility and influence.
In addition to this disparity in pay across all occupations, women tend to be heavily concentrated in occupations and industries that are characteristically low paying. The 1991 Population Census (OPCS, 1992) recorded that just over 28% of women were employed in clerical and secretarial jobs, 13% in personal service occupations and 10.5% in sales occupations (Table 3). The corresponding figures for men in these areas are much lower. In contrast, nearly 30% of male workers are managers and professionals. These occupations employ only just over 19% of women. Moreover, within broad occupational groups we find further concentrations. For example, two thirds of women in professional occupations are teachers whereas teaching accounts for only a quarter of professional males. Similarly, more than half the women in associate professional jobs are nurses.
| Men | Women | |
|---|---|---|
| Managers | 19.3 | 11.6 |
| Professionals | 9.5 | 7.6 |
| Associate professionals | 7.8 | 9.9 |
| Clerical and secretarial | 6.7 | 28.1 |
| Skilled manual | 23.1 | 3.5 |
| Personal services | 6.1 | 13.0 |
| Sales | 4.5 | 10.5 |
| Plant and machine operators | 14.3 | 5.1 |
| Other | 7.5 | 9.9 |
| Not adequately described | 1.1 | 0.8 |
3.2 Ethnicity and disadvantage
Detailed information on other disadvantaged groups in the UK is more limited. Recent studies of the labour market disadvantage faced by Britain's minority ethnic groups indicate not only that they fare badly relative to white employees, but also that their relative position deteriorated throughout the 1980s and early 1990s. According to the General Household Survey, non-white employees in the UK earned 7.3 per cent less, on average, than white employees over the period 1973–9: this deteriorated to 12.1 per cent through the period 1983–9. The Campaign for Racial Equality reports an even larger disparity in earnings: using the Labour Force Survey, they found that the average hourly rate of pay for ethnic minority workers in Inner London was £5.62 compared with a figure of £9.82 for white workers.
A similar picture both of relative disadvantage and deterioration since the 1970s emerges in unemployment rates. Table 4 shows unemployment rates for different ethnic groups since 1979.
| Year(s) | White (total %) | Non-white (total %) | Indian (%) | Pakistani or Bangladeshi (%) | West Indian (%) |
|---|---|---|---|---|---|
| 1979 | 4.0 | 6.0 | 4.8 | 8.1 | 7.3 |
| 1981 | 9.7 | 17.2 | 15.4 | 20.4 | 20.6 |
| 1983 | 12.0 | 22.0 | 17.0 | 32.0 | 28.0 |
| 1984 | 11.0 | 21.0 | 13.0 | 38.0 | 28.0 |
| 1985 | 11.0 | 21.0 | 18.0 | 28.0 | 23.0 |
| 1984–6 | 11.0 | 21.0 | 15.0 | 30.0 | 25.0 |
| 1985–87 | 11.0 | 20.0 | 15.0 | 29.0 | 24.0 |
| 1987–89 | 8.0 | 15.0 | 10.0 | 25.0 | 18.0 |
| 1989–91 | 7.0 | 13.0 | 10.0 | 21.0 | 16.0 |
| 1994 | 11.0 | 25.0 | 16.0 | 29.0 | 33.0 |
What is interesting about this table is that the information is also broken down by ethnic group. This enables us to highlight not just the differences that exist between white and non-white workers but also those that exist between minority ethnic groups. Several points are worth noting. First, unemployment in all the years shown is lower for whites than for non-whites: in 1994 the unemployment rate among non-whites was more than twice that for white workers. Second, although the 1980s was a period of rising unemployment for all workers, the increase was much larger for non-whites than for white workers. Finally, there are significant differences within the non-white population. Workers of Indian descent fared significantly better than workers of Pakistani/Bangladeshi descent; workers of West Indian origin have faced the greatest deterioration in their chances of being in work.
Unemployment among young workers paints an even bleaker picture with 37 per cent of those from minority ethnic groups unemployed in 1994: amongst young black workers the figure is 51 per cent (Blackaby et al., 1995).

3.3 Other disadvantaged groups
Information on other disadvantaged groups, such as older workers or people with disabilities, is even harder to come by. The problems faced by older workers in the labour market have become an increasing cause for concern in recent years. The nature of the disadvantage faced by older workers is, however, much harder to uncover and the evidence is often anecdotal. One trend that has become evident during the past three decades is the difficulty older workers have in obtaining any work and, in many cases, the jobs that are available often pay older workers significantly lower wages than they previously received. Until recently, job adverts could specify age limits (in contrast to race and gender) in the UK, though such practices have long been made illegal in some countries, such as the US, Canada and France.
High general unemployment in the 1980s and 1990s had a significant impact on the employment opportunities for people with disabilities as they had to compete with large numbers of ‘able-bodied’ workers. The double discrimination facing people with disabilities from ethnic minority places them at even more of a disadvantage than white people with disabilities (Baxter et al, 1990).
4 Forms of discrimination
We have already seen that labour market disadvantage can take various forms. Equally, discrimination in the labour market itself can manifest itself in different guises.
The most obvious form of discrimination involves women being paid less than men for doing the same or a similar job. This is what labour economists call wage discrimination (under wage discrimination an individual is paid less than another individual working at the same job), which has been addressed and formally eliminated in many countries through the introduction of equal pay legislation. Wright and Ermisch (1991) for example, report that ‘the Equal Pay Act (1970), Sex Discrimination Act (1975), and Employment Protection Act (1975), contributed significantly to reducing discrimination in the British labour market’ (p. 508).
However, the ability of such legislation to improve the relative position of those workers facing discrimination is the subject of much debate. The following case study of performance-related pay shows how discrimination can be difficult to legislate for.
Merit pay scheme ‘was discriminatory’
London Underground is changing the way its performance-related pay system is implemented after conceding a £60,000 racial discrimination case last month.
Consultants, Psychometric Research Development, will meet with London Underground in future to discuss any performance-related pay scheme as part of a settlement reached with 20 black station managers. The managers claimed that the scheme, in place for the three years between 1989 and 1992, indirectly discriminated against them.
Fatima Patwa, a solicitor for Brent Community Law Centre, which supported three of the 20 managers, told Personnel Management that the performance assessments left too much to the discretion of the senior staff carrying out the appraisals.
She said research found black managers were being awarded lower performance pay than their white colleagues. Some managers were failing to use the appraisal procedure correctly, making the same remarks on all forms while awarding different levels of pay, or ignoring the assessment entirely and simply making a judgement on salary.
In a statement agreed with the black managers, London Underground said that the indirect discrimination had been ‘wholly unintentional’. It went on to say that it ‘regrets the fact that its performance-related pay exercises for the three years from 1989 to 1992 were not carried out fully in conformity with its laid down procedures’.
The Commission for Racial Equality, which supported 17 of the managers, said the case was the biggest it had ever put to an industrial tribunal.
The case was initially supported by the Transport Workers Legal Action Committee, which was formed by black workers within London Underground to deal with discrimination.
Each of the managers will be paid £1,000 for financial loss plus £1,500 for injury to feelings and £650 for adjustment to voluntary severance payments.
Source: Personnel Management, May 1993
Discrimination can also exist even where earnings are the same for all workers in a particular job. Employment discrimination (under employment discrimination an individual has potentially the same level of productivity as those working at a job from which he or she is excluded) occurs when workers from disadvantaged groups are employed in jobs for which they are over-qualified in the sense that they have higher levels of productivity compared with other workers doing the same job, and with the overall level of ability needed to undertake the tasks involved. This will arise either because members of particular groups face discrimination in recruitment, and so cannot gain access to better paid jobs, or because opportunities for promotion and selection for training are denied.
The definition of discrimination which underlies both wage and employment discrimination is the same. It involves the unequal treatment of individuals who are equally productive (sometimes described as ‘of comparable worth’) on the basis of characteristics, such as gender, race, age, religion, etc., that are not related to productivity and so should not affect earnings.
While wage and employment discrimination have been the focus of empirical and theoretical research, this should not be taken to imply that other forms of discrimination are less important nor that their impact is of less significance. Harassment at work, for example, is a form of discrimination which, although it has not received the empirical scrutiny of labour economists, is nevertheless an increasing cause for concern. It can affect an individual's performance at work and consequently his or her earnings and employment opportunities. To give one example: in a large-scale survey of junior barristers, 40 per cent; of female respondents reported that they had faced some sort of sexual harassment at work (Equal Opportunities Review, 1995).
5 Neoclassical models of discrimination
5.1 Introduction
Our earlier discussion suggested that to understand labour market discrimination we need to answer two principal questions. First, to what extent does the observation that, on average, some groups in society fare worse than others in the labour market actually reflect differences in productivity arising from differences in such things as education and training, and how much represents the unequal treatment of equally productive workers (i.e. discrimination)? Secondly, if discrimination in the labour market exists, what explanations are proposed to explain why it takes place? These two questions are, of course, not unrelated. The educational and training opportunities available to some groups in society may themselves reflect discrimination. As a result, labour market outcomes, which may or may not be discriminatory, may arise from discrimination that exists outside the labour market. In this section we consider those explanations usually grouped under the neoclassical label, which build upon human capital theory. No attempt is made here to provide an exhaustive coverage of all the neoclassical models and their variations, rather, we present two examples of neoclassically-based explanations. The first, Becker's ‘employer taste’ model, is based on the standard utility maximising model and emphasises the importance of market forces and competition; the second focuses on how imperfect information in the labour market can give rise to wage differentials even among comparable workers.
5.2 Becker's ‘employer taste’ model
The most prominent neoclassical explanation of discrimination is based on the work of Gary Becker and develops the idea that some workers, employers or customers do not want to work with or come into contact with members of other racial groups or with women (Becker, 1971). No explanation is given as to why this prejudice exists, rather it is simply assumed that there is a ‘taste’ or preference against people from disadvantaged groups and that this taste can be treated in exactly the same way that economists would analyse individual preferences between goods and services.
Suppose that an employer does not want to employ members of a particular group even though these workers are as productive as any others. If the firm has to pay all workers the same wage it will simply not employ members of the disadvantaged group. However, if it is possible to pay these workers less than those from other groups the firm then faces a trade-off: it can employ members of the disadvantaged group at lower wages and thus increase its profitability, or it can discriminate and employ only workers from the high wage group even though this will mean lower profits. Discrimination in the latter case therefore imposes a cost on the firm.
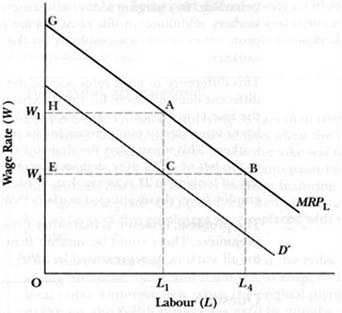
Figure 2 can be used to show what happens in these circumstances. Let us assume for the sake of simplicity that there are no differences in productivity between different groups of workers. Since all workers have the same level of productivity, the marginal revenue product (MRP) curve faced by the firm is the same, irrespective of which workers they employ. This is shown as MRPL, the demand for labour curve. In a competitive labour market, a firm will employ labour up to the point where the wage equals the marginal revenue product of labour (which is why the MRPL curve is also the firm's demand curve for labour). So, if the wage rate is W1 the firm will employ L1 workers. If the firm discriminates against members of a particular group, no workers from this group will be employed at W1. This employer will simply exercise prejudice against them and, if this is a common practice amongst firms, the disadvantaged group will face unemployment.
What would happen if these workers were prepared to work at wages below W1? Clearly, this will depend upon the extent to which the firm is prepared to discriminate since by employing disadvantaged workers at lower wages, the firm can lower its costs and thus increase its profits. Suppose that the firm is prepared to pay to L1 workers from the disadvantaged group.
Activity 2
Use Figure 2 to identify the volume of total profits which the firm would make from this discrimination.
Answer
The following text will help increase your understanding about how this volume was generated.
For each unit of labour employed, the firm makes profits equal to the difference between revenue (MRPL) and cost (W4). At L1 units of labour employed, total profits consist of the sum of differences between MRPL and W4 for each unit of labour employed between O and L1. These total profits are represented by the area AGEC.
Now, if the firm only employed workers towards whom it is not prejudiced at a wage W1, then total profits would be represented by AGH. Figure 2 shows that the firm gains additional profits from its discriminatory behaviour. By charging a discriminating wage of W4 to disadvantaged workers, additional profits of ACEH are made by the firm. These additional profits compensate the employer for the prejudice held for disadvantaged workers.
This difference in wage rates paid to the two groups of workers results in a different demand curve for the disadvantaged group. This is represented by the line D' in Figure 2. For each level of employment the firm pays a lower wage rate to compensate for its prejudice against disadvantaged workers. This means that the demand curve for these workers is parallel but to the left of MRPL (the demand curve for advantaged workers). Another way of looking at D' is to say that, at each wage rate, the firm is prepared to employ fewer disadvantaged workers than it will advantaged workers.
The problem, however, is that other firms may not hold the same prejudices. There could be another firm which has only one demand curve for all workers, as represented by MRPL.
Activity 3
Assume that a non-prejudiced employer hires labour at a wage rate of W4. Using Figure 2, identify the following:
the total profits made by this firm;
any additional profits made in comparison to the prejudiced firm.
Answer
The non-prejudiced employer, paying a wage rate of W4, would employ L4 workers regardless of their colour or creed. It would make total profits of BGE. By not being prejudiced this firm gains additional profits of BCA in comparison to the profits of AGEC made by the prejudiced firm. The problem, therefore, is that it is difficult for any one firm to indulge in prejudices without losing out to more profit-hungry non-discriminatory firms. Moreover, the additional amount of labour employed by these other firms would enable them to produce more output, thereby forcing down the prices of goods sold in the product market. This fall in product prices would drive the discriminatory firm out of business.
Although we have only considered a simple variant of the Becker approach to labour market discrimination, it is sufficient to highlight the most important conclusion. This is that discrimination can persist only if there are factors which limit the amount of competition in the labour market or in the product market. If these markets are competitive, the increased profitability of non-discriminating firms compared to discriminating ones will encourage non-discriminators to enter the market. This will put downward pressure on the price level and eventually force the higher-cost discriminating firms out of business. The extent of the inefficiency faced by discriminating firms is shown by the fact that, at wage W4 discriminating firms employ L1 workers, whereas a non-discriminating firm would employ L4 workers and produce more output as a result. If, however, there are substantial barriers to entry which make it difficult for new firms to enter the market, competition will not erode discrimination.
The ‘employer taste’ model predicts that discrimination exists because employers do not want to employ certain groups of workers and will only do so if these workers are paid lower wages than those paid to workers in general. It thus provides an explanation of wage discrimination – equally productive workers being paid different wages. Other variations on this theme involve discrimination by workers and customers. The case study that follows provides an example of perceived customer discrimination by the Ford Motor Company.
Think global, act prejudiced?
Ford is better known for spraying its cars than re-spraying its employees. Indeed, in the bad old days when the company seemed to specialise in producing tinny boxes, the joke was that Ford's profits came from its skill in spraying metal onto paint rather than the other way around. But when an advertisement featuring line workers from its Dagenham plant in England was used in Poland, the black and brown faces of five employees were replaced with white faces (and hands).
The reason, according to Ford, was that the Poles are not used to seeing non-white faces, and it wanted to adapt its advertisement to suit local tastes. Unfortunately, when the original picture was reused back in Britain, the Polish version was used by mistake.
When they noticed what had happened, the line workers at Dagenham all walked out for three hours – a rare event in a British factory nowadays. Ford, which has apologised to the victims of the retouching and sent them a cheque for £1,500 ($2,320), blamed a mistake by its advertising agency, Ogilvy & Mather. The agency cannot say who was responsible for the mistake, because it happened 18 months ago, and institutional memories in creative organisations clearly do not stretch back that far.
In some ways the Ford saga, which immediately provoked cheap jibes along the lines of ‘Any colour you want as long as it's not black’, unveils yet another problem of globalisation. In America and Europe, Ford is abolishing many of its regional fiefs and setting up transnational product groups. On the other hand, it has told its managers to demonstrate sensitivity to local peculiarities – particularly on the marketing side. Nobody at Ford seems to be apologising for what happened in Poland.
Source: Economist, February 1996
5.3 Statistical discrimination
5.3.1 Investment in education and training
Human capital theory has been used to show how investments in education and training lead to higher levels of earning. One reason why education and training are referred to as investments is because their benefits accrue over time and because training early in a career leads to higher earnings over the rest of an individual's working life. An important consideration, therefore, in the decision about whether to invest in additional human capital is the potential length of working life over which the benefits will be received. This would suggest that if certain groups of workers – most notably married women with family responsibilities – expect to have interruptions in their careers they will invest less time and energy in acquiring human capital. They thus face lower earnings as a result of having less training and lower skills. Because women themselves choose not to invest in skills and training, their lower earnings would not represent discrimination according to the definition used in this course. Of course, it could be argued that some women decide to focus on their family and domestic activities precisely because they perceive poor career prospects for women, prospects which are themselves a reflection of discrimination. This is an example of reverse causation.
The impact that career interruptions can have on the earnings profile of women can be shown using Figure 3. We shall initially assume that men come to the labour market with a certain amount of human capital and this determines their initial earnings. Subsequent training and promotion then result in their earnings increasing each year which is reflected in an upward sloping age-earnings profile (this shows how an individual's or group of individuals' earnings change over time). On the other hand, we shall also initially assume that all women expect to drop out of the labour force because of family responsibilities and, as a result, undertake less education and training before entering the labour market.

Hence, their age-earnings profile is lower than that for men. For example, women may choose education and training courses, such as those providing clerical, secretarial or nursing skills, that enable them to enter occupations in which breaks from work incur the smallest penalty. Once they enter these occupations they receive less training than men because expected career interruptions reduce the returns from such investments and consequently their earnings profile rises at a lower rate than that for men. This is shown by the segment of the age-earnings profile up to age A. At age A, we assume that women drop out of the labour force and that when they enter the labour market again at age B, depreciation of their skills has resulted in a reduction in their potential earnings. In addition, the interruption has also resulted in a loss of seniority which has depressed their scope for earnings growth even further. This is shown by the segment CD.
Human capital theory therefore predicts that women will earn less than men because they do not expect to spend as long in the labour force. Intermittent work histories will also influence career choice. Fewer women will pursue skilled occupations and the professions, and more will be attracted to those jobs that enable them to more easily combine family responsibilities and labour market activity. Women are less likely to be promoted to higher level grades where these involve additional training since the monetary gains to the firm will, on average, be lower for women. The result is that promotions will be biased in favour of men.
We have, of course, made some very strong assumptions in painting the above picture of participation and occupational choice. Women now account for about half the total UK workforce (though women as a whole work shorter hours in employed labour and a larger proportion are part-time) and many women have as strong a commitment to their careers as men. The ability to combine family responsibilities and a career depends upon a number of different factors, not least of which will be the nature of the job and the availability and cost of such things as crèche and childcare facilities.
5.3.2 Productivity difference
The preceding discussion has only considered what would happen if all women undertake less investment in human capital than men. If men and women invest to the same extent, human capital theory suggests that no wage differences would be observed. What happens, however, if there are differences in skill levels both between genders and within gender groups? To consider this we will also make the additional assumption that firms do not know when recruiting workers who are the most productive. However, employers do know that, on average, women spend less time in the labour market than men because of career interruptions.
Figure 4 can be used to describe what will result. Since firms do not know each individual's potential productivity when hiring – both men and women may leave or may not be very productive once trained – they will set wages on the basis of what they do know, and that is the average level of productivity of each group. Since women have less training and work experience, their average level of productivity will be lower than men's. The two distributions show that there are variations in productivity among men and women. The fact that they overlap indicates that some women are more productive than some men. Let α be the average productivity of men and β the average productivity of women (α > β).
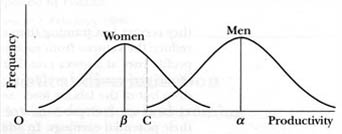
For a man, individual productivity is equal to:
![]() i =
i = ![]() + ui
+ ui
whereas for a woman, it is likewise equal to:
![]() i =
i = ![]() + ui
+ ui
where ui represents the individual difference between actual productivity and the average for all men (women).
The average level of human capital investment, and thus productivity, differs between men and women and this is reflected in the average earnings differential. On these assumptions, there is no discrimination, on average, against women. However, there is discrimination against individual women. Specifically, those women who have a productivity level to the right of the line above point C are being paid less than comparable men. It is also evident that the greater the variation in productivity within the female group, the more women will be underpaid compared with men who may be less productive. The curve showing the distribution of productivity would be wider, and, hence, there would be more overlap with the distribution curve for men. Discrimination here involves the unequal treatment of individuals on the basis of actual or perceived differences in the average characteristics of the groups to which they belong.
An additional point about potential productivity concerns the methods used by firms to try and identify which applicants are potentially the best employees. Firms use a variety of ‘screening devices’ when recruiting in order to establish the best potential employees. One such device is psychometric testing which many firms are now using to test applicants. However, it is possible that the very nature of these tests may be biased against women or minority ethnic groups, adding further to the discrimination faced by individual workers.
Bringing selection procedures back on track
In early 1991 several ethnic minority guards at Paddington Station took British Rail to an industrial tribunal, alleging that the selection process for train drivers discriminated against applicants from minority ethnic groups. In a settlement, BR agreed to work with the CRE to make the selection process fairer.
One element of this was a workshop with the Paddington guards to explore their test-taking behaviour. It became apparent that they were not, as the Americans say, test-wise. As a result, British Rail commissioned an open-learning pack which the guards could work on in their own time before retaking the test in September 1992
The pack gave advice and tips on how to develop successful test-taking behaviour, as well as extensive practice materials to develop language proficiency. Six weeks were allowed, and the pack was supported with workshops at the beginning and at the end. The result? Five of the seven guards passed the tests and have gone forward for training.
Source: Personnel Management, December 1992
5.4 Empirical evidence
The neoclassical approach to discrimination produces a number of different explanations for why discrimination may exist in the labour market. Empirical analysis has tended, however, to focus not so much on testing these explanations but rather on establishing how much of an observed earnings differential between, say, men and women, can be accounted for by differences in their relative skill and education levels, their different work histories and differences in hours of work. That part of the actual differential that remains after allowing for these factors is usually attributed to labour market discrimination – it is the difference in earnings that cannot be explained by the productivity-related characteristics of the two groups. This decomposition is achieved using multiple regression analysis. The basic approach is as follows. Suppose that the earnings of men and women be determined by the following equations:
WM = a0 + a1EM
WF = b0 + b1EF
where W represents average earnings and E represents an education variable which determines earnings. In the first equation W M represents the earnings of men, while E M represents, say, the average number of ‘A’ levels held by men. In the second equation W F the average earnings of women, while E f is the average number of ‘A’ levels held by women. The terms a 0 and b 0 are the intercepts of the two equations. The observed average gender earnings differential – the difference in earnings between the two groups – can then be broken down by subtracting one equation from the other:
(WM − WF) = (a0 − b0) + a1EM − b1EF + (b1EM − b1EM)
The term (b1 EM − b1 EM) has been artificially added to this equation. The equation can, as a result, be re-arranged to give us the expression:
(WM − WF) = (a0 − b0) + b1(EM − EF) + (a1 − b1) EM
The equation shows that the average wage differential – the difference in average earnings between men and women – is made up of three components.
The first term:
(a0 − b0)
is the part of the gender differential that is due to differences in earnings that take place on entry to the labour market. This will reflect differences in pre-entry human capital investments and/or pre-entry discrimination.
The second term:
b1(EM − EF)
shows the contribution that differences in productivity-related characteristics between men and women make to the gender earnings differential. In other words, it shows the effect that gender differences in the average level of education have on the average earnings differential. This component represents that part of the earnings differential that does not reflect discrimination.
The final term:
(a1 − b1)EM
measures the impact that unequal treatment has on the average wage differential. This is measured by the difference between the coefficients in the two equations on the variable measuring education. These coefficients show how education affects an individual's earnings. This term measures what happens when the labour market rewards productivity-related characteristics in different ways. It is this term, therefore, that is used as a measure of discrimination – women's productivity-related characteristics are treated differently from those of men for reasons that have nothing to do with the characteristics themselves. So, for example, suppose that women with four ‘A’ levels earn less than men with four ‘A’ levels (assuming all other things equal). This approach says that this can only come about because of discrimination. The extent of this discrimination is captured by the amount that the woman is paid less than her male comparator, which, in a model like the one above, is reflected in a smaller coefficient on the education variable in the female earnings equation compared with the earnings equation estimated for men.
The following example provides a demonstration of how the model can be estimated. Wright and Ermisch (1991) conducted an analysis of discrimination against women in the UK using data from the 1980 Women and Employment Survey. A total of 2094 employed women aged between 16 and 59 were interviewed in a nationally representative sample. Alongside this survey of women, husbands of those 1868 women who were married at the time were also interviewed.
Everyone was asked, among other things, their wage per hour, their place of residence, and any educational qualifications they had. Using a statistical procedure developed in a previous study (Wright and Ermisch, 1990), a variable for the potential experience of individuals was calculated. Since, unfortunately, information on the work experience of individuals was not collected in the survey, this was estimated using other information. Variables for education were specified to model the impact on wages of individuals holding CSEs, ‘O’ levels, ‘A’ levels, degrees or any other qualifications. The wage equations for males and females are reported in Table 5. Note that for ease of exposition, a number of the additional variables used in the study, such as those representing the regions in which individuals reside, are not reported here.
| Males | Females | |||
|---|---|---|---|---|
| (sample size 1868) | (sample size 2094) | |||
| Variable | t-statistic | Variable | t-statistic | |
| Intercept | 0.595 | 11.70 | 0.521 | 14.43 |
| Potential experience | 0.246 | 6.56 | 0.044 | 1.52 |
| Education: | ||||
| CSE(s) | 0.101 | 3.84 | 0.083 | 3.66 |
| ‘O’ level(s) | 0.203 | 8.23 | 0.116 | 5.28 |
| ‘A’ level(s) | 0.316 | 7.96 | 0.210 | 4.74 |
| Degree | 0.509 | 21.01 | 0.508 | 21.63 |
| Other | 0.099 | 1.60 | 0.062 | 0.58 |
| R^2 | 0.249 | 0.224 | ||
On examining the two wage equations we need to check a number of features. First, we need to check the sign of the coefficients for each variable. In the wage equations for both males and females all the variables shown have a positive sign. This means that all these variables have a positive influence on wages. For example, the positive sign for potential experience means that potential experience is positively correlated with wages – there is a positive premium on experience. As potential experience increases, then, on average, both males and females should get a higher wage. The coefficients for all of the education variables are also positive for both genders. For example, the coefficient on the variable for males with ‘O’ levels is 0.203; this means that there is a premium in terms of higher wages for male workers obtaining ‘O’ levels compared to someone with no qualifications. The comparable value for females is 0.116.
Second, we need to check the statistical significance of the coefficients. To do this the t-statistics associated with each coefficient can be examined. A t-statistic greater than 1.96 for a particular coefficient means that we can have 95 per cent confidence in the statistical importance of that coefficient. In Table 5, with the exception of a t-statistic of 1.60 for ‘Other’ qualifications, all the reported t-statistics for males are higher than 1.96. A t-statistic of 0.58 for ‘Other’ qualifications and a t-statistic of 1.52 for potential experience are reported for females. Econometricians often estimate equations in which some coefficients have low t-statistics, but this reduces their confidence in the results obtained. We might also be somewhat cautious about the two wage equations in Table 5 since the R2's are 0.249 and 0.224 for males and females respectively.
This means that over 70 per cent of the variation in wages is not explained by these equations.
The key thing to note about these equations is that, in all cases, the coefficients for males are larger than the coefficients for females. Take, for example, the wage premium for ‘A’ levels. In the equation for males the premium on ‘A’ levels (the size of the coefficient) is 0.316, but in the equation for females it is only 0.210. The premium on potential experience shows an even wider disparity with a coefficient value of 0.246 for males and only 0.044 for females.
A formal measure of these differences in the size of coefficients is calculated by using the method of decomposition explained earlier in this section. Look back and make sure you have grasped that the differential between male and female earnings can be explained in terms of two main components:
the part of the earnings differential which is due to differences in productivity
the part of the earnings differential which is due to male and female workers of equal productivity being rewarded differently.
For the wage equations reported in Table 5 and the additional variables not reported in the table, Wright and Ermisch derive the estimate that 11.8 per cent of the wage differential is attributed to (1) and 88.2 per cent to (2). This means that unequal rewards for the same productivity are found to be more important when explaining wage differentials than differences in productivity. It should be noted, of course, that these results are qualified by the small R2's of their wage equations. It should also be noted that Wright and Ermisch estimate a number of other wage equations with different specifications, which give less weight to the importance of discrimination. Nevertheless, even taking these cautious notes into account, the results reported in Table 5 provide a revealing insight into the extent to which discrimination takes place against women in the labour market.
It is more difficult to obtain empirical evidence about racial discrimination than for sex discrimination. Substantial earnings differentials have been found to exist between white and ethnic minority workers, with the latter earning about 10 per cent less than whites (Blackaby et al, 1994). A significant part of this differential reflects the occupational and industrial segregation of minority ethnic groups. Indeed, while there is evidence that minority ethnic groups face wage discrimination and, in particular, face lower rates of return to education and general training, it is discrimination in terms of occupational access which is found to be of most significance (McNabb and Psacharopoulos, 1981).
However, this type of analysis only compares the earnings of people in work and minority ethnic groups are significantly more likely to be unemployed than white workers. This raises two issues.
Why do workers from minority ethnic groups face worse employment prospects than white workers?
What impact does this have on the earnings differential between the two groups?
A study of unemployment among Britain's minority ethnic groups (Blackaby et al, 1995) found that although employees from minority groups had less favourable characteristics (in terms of the attributes that affect the likelihood of employment, such as age, education and so on), the main reason for their different unemployment experiences was discrimination. However, significant differences were found between the ethnic groups considered. For example, relatively high unemployment among workers of West Indian origin reflected their unfavourable characteristics rather than discrimination. In contrast, unemployment among workers of Indian descent was primarily the result of discrimination. They experienced relatively more unemployment even though their characteristics were, in fact, more favourable in terms of the likelihood of finding employment than those of white workers. Finally, the analysis indicated that discrimination against workers of Pakistani and Bangladeshi origin was greater than against those of Indian descent. The authors attribute the latter finding to the fact that workers of Pakistani and Bangladeshi descent, ‘have reacted to discrimination in a different way by choosing to be more isolated and have adopted an economic structure which is more autarchic compared to other groups. Greater economic disadvantage is the consequence of this’ (Blackaby et al, 1995, p. 25).
The same authors also examine the interaction between unemployment and wage discrimination among ethnic minority workers. They find that the limited employment prospects faced by ethnic minority workers are significantly more severe than the earnings disadvantage they face. As unemployment in Britain increased in the 1980s and early 1990s, minority ethnic groups suffered disproportionately. Even ethnic minority employees with favourable productivity-related characteristics (those with better earnings potential than white workers) have become unemployed, thereby increasing the wage gap between white and non-white employees.
6 Segmented labour markets
6.1 Introduction
In recent years different explanations of how labour markets operate have been proposed by a number of economists dissatisfied with neoclassical theory in general and its explanation for labour market disadvantage in particular. Some of these alternatives simply extend neoclassical models to include the effects of various institutional factors. Others, however, have sought to develop a new theoretical approach. All reject a predominantly competitive analysis and emphasise instead the fragmented nature of labour markets and the importance of institutional and social influences upon pay and employment. A common label for these alternative approaches is segmented labour market theory. The underlying theme of these approaches is that the labour market should be viewed as a collection of parts or segments. One segment may consist of high-waged, male, white workers, for example, and another of low-waged, female, non-white workers.
The concept of a segmented labour market has been applied in a variety of ways. Analyses differ in the outcomes of interest (pay, employment stability or mobility), in the delineation of segments (by job, industry, gender, race or age) and in the methodology of investigation, whether qualitative or econometric (McNabb and Ryan, 1990). There is, however, a consensus among segmentation economists about the way the labour market can be conceptualised and about how segments function. This convergence of views is primarily encapsulated in one particular variant of the segmentation approach, the dual labour market theory.
6.2 Dual labour market theory
According to this theory, the labour market is composed of self-contained sub-markets or segments. Segmentation economists argue that ignoring the different identities of these segments and the constraints they place on the workers makes it impossible to understand the nature of labour market disadvantage. Basically, the dual approach hypothesises that a dichotomy has developed over time between a high-wage primary segment and a low-wage secondary segment. Working conditions in the primary segment are generally favourable; there is steady employment and job security, and the rules that govern the organisation of employment are well defined and equitable. The characteristics of secondary employment, on the other hand, are less favourable. Work here has little job security and there are high turnover rates. There are few opportunities for training or advancement and the work tends to be menial and repetitive.
Corresponding to this duality in the characteristics of jobs is a further distinction between primary (core) and secondary (periphery) industrial sectors. In the core sectors, firms have monopoly power, production is on a large scale, extensive use is made of capital-intensive methods of production and there is strong trade union representation. These establishments operate in national and international product markets. In contrast, employment in the periphery is located in small firms that employ labour-intensive methods of production, operate in competitive local product markets and have low levels of unionisation. Although they are not entirely coincidental, there is a considerable overlap between primary jobs and core industries, on the one hand, and secondary jobs and periphery industries on the other.
In contrast to the supply side and individual factors which dominate neoclassical models of the labour market, segmentation theory emphasises demand side and institutional factors. Specifically, segmentation in the labour market arises because of the characteristics of jobs rather than differences in worker attributes, such as education and training. Secondary jobs, however, are filled largely by groups whose attachment to paid employment has traditionally been weak, notably non-whites, females and youths. Primary segment jobs, on the other hand, tend to be the preserve of ‘prime age’ white males.
The segmentation that exists in the labour market primarily reflects the nature of internal labour markets (this is the labour market that exists within a firm – it determines how wages are set and labour is allocated within the firm) within which primary and secondary jobs are found. Internal labour markets can best be thought of as the type of labour market that exists within an organisation. At one extreme, the internal and external markets may be very similar: the structure of wages and the allocation of workers within the organisation will be determined simply by external market conditions. In this case, the internal market is similar to what is happening outside the organisation. At the other extreme are organisations (usually large employers) in which wage structures and employment policies are set apart from external labour market conditions. Such internal labour markets will often be highly structured and regulated, and have employment systems that confer significant advantages to those already employed in the organisation – ‘insiders’ – compared to outsiders. This is because access to jobs within the firm is granted preferentially, even exclusively, to existing members of the organisation via promotion along well defined ‘job ladders’, often on the basis of seniority rather than productivity. Outsiders, on the other hand, have access to only a limited number of low level positions.
Pay rates within structured internal labour markets do not respond to demand or supply conditions in the external market but rather to the specific requirements and needs of the organisation. Imbalances that develop over time in the supply and demand of particular types of labour vis-à-vis the external labour market are dealt with through a variety of non-wage adjustments, including recruitment and training, job redesign and subcontracting. Crucially, emphasis is on the institutional and social nature of internal labour markets rather than on any efficiency or economic considerations that may be proposed for their emergence. In order to provide an explanation of labour market disadvantage it is clearly important to understand why some organisations adopt employment systems that are protected from external market forces and why workers from disadvantaged groups have only limited access to the favourable conditions of work they provide.
Three features of the segmented labour market theory clearly differentiate it from neoclassical labour economics. These are described next.
6.2.1 Job rewards
Segmented labour market theory views the labour market as systematically differentiating the job rewards achieved by comparable individuals. The high pay of primary workers cannot be explained simply in terms of their higher quality of labour since many secondary workers are capable of performing well, given the opportunity to do so. The labour market is thus seen as a key ingredient in the generation of economic inequality and not a passive mirror of the inequalities which people bring to it. Wage structures are differentiated by employer characteristics rather than worker attributes.
This is not to argue that all secondary workers are as good as all primary workers. Labour quality will, in general, be higher in primary jobs. The important point, however, is that differences in labour quality across jobs is less than that in pay and the direction of causality between pay and labour quality is reversed. Wage structures are taken as given, differentiated by employer characteristics rather than worker attributes. Under such conditions high-paying employers can take their pick from the applicant queue and rationally hire labour of high quality. The compensation, however, is only partial, with the differences in job rewards exceeding that in worker quality.
Labour quality and labour productivity must, therefore, be carefully distinguished. Productivity is an attribute of the job rather than the worker and depends upon the equipment available at the workplace and the product market served. Primary workers have higher productivity than secondary segment workers because of the jobs in which they work rather than because of who they are. Were they confined to secondary employment, with its labour-intensive techniques and unfavourable product markets, their productivity would be correspondingly lower. Worker quality, in contrast, is defined in terms of attitudes, behaviour and values.
In many instances, the skills that exist at the workplace involve learning by doing and are characterised by their informality in contrast to the more formal investment framework proposed by human capital theory. Acquisition of these skills involves being ‘shown the ropes’ by fellow workers and is not a distinct process within the firm. It is more a process of socialisation that involves being accepted by existing workers, as well as the internalisation of particular sets of norms and values, than a formal training programme. Certain groups of workers are thus segregated from better jobs because they are less acceptable socially rather than because they lack ability. Employers may also believe that particular characteristics, such as gender and race, correlate with those values and norms which characterise primary segment employment.
A similar divergence of interpretation also exists for employment stability. It is argued that the role in the family (for example youths and married females) or in society (for example inner-city, non-whites) of many secondary segment workers may mean lower intrinsic job stability than that displayed by primary workers. The segmentation approach, however, emphasises the instability of jobs not workers. Many secondary workers, particularly married females, may be interested in and available for steady work but are denied access to it. Thus while the supply side does exert an influence, it is seen as less important than the demand side and social institutions in explaining the differentiation of outcomes in the labour market.
6.2.2 The role of market forces
The second distinguishing feature of the segmented labour market theory concerns the role of market forces in affecting labour outcomes. Although the impact of market forces is not denied, their role is seen to be in the product market rather than the labour market. The part played by labour market influences, particularly excess demand but also trade unions, is seen as subsidiary to such features of the product market as demand variability, employer power and production technology. Similarly, internal labour markets are thought to develop not so much as the result of the type of technology and the skills employed by the firm, as of the power relationships and control strategies that are required within the organisation.
A key distinction employed in the segmentation literature is that between those jobs and workers in firms with structured internal labour markets and those in firms which are open to external labour market conditions. What, then, are the consequences of this distinction for the structure of wages? As we discussed earlier, jobs in the primary segment are generated by employers in core sectors whose ability to pay is boosted by large size, high capital intensity and high profitability, as well as a degree of monopoly power in their product markets. Secondary jobs are provided by firms located in the periphery, where firms are smaller and capital intensity is lower, and product markets are highly competitive on price. According to the theory, wages in the periphery will, as a result, be set at competitive levels which, since the secondary segment is characterised by an abundant supply of labour, will be low.
The advantages enjoyed by core firms do not, however, automatically result in favourable employment conditions for workers. Powerful employers can use their substantial resources to deny special advantages to employees through actions such as union busting and the relocation of production to low-wage, low-unionised regions. Conversely, even highly competitive product markets may yield core rather than periphery jobs if employees are well organised and able to fend off competition from home and abroad – as in parts of the coal, trucking and construction sectors in the US.
In any event, core employers need not extend primary jobs to all their employees. As a range of functions, particularly services such as cleaning and catering, is generally limited to secondary status either within the firm or in subcontractors, the contours of segmentation run through individual firms, not simply between sectors. Similarly, small firms may not offer just the low pay and job instability of the classic sweatshop, they may be the source of jobs with the high rewards offered by producers of speciality and high technology goods.
The differentiation of pay within internal labour markets is explained in neoclassical theories in terms of firm-specific skills which can only be developed through on-the-job training. The senior workers who possess such skills must be sufficiently well paid and secure in their jobs to ensure their willingness to train others. A sharper differentiation from neoclassical analysis, however, is achieved by elaborating a further factor, namely custom. The stability of work groups within internal labour markets is a favourable environment for the generation of norms or accepted ways of doing things. Employers must accommodate such norms if production is to continue without constant interruptions. Custom can be seen as both the accumulated total of norms which develop often quite informally as well as a norm in itself – the requirement that established practices be respected. Thus two groups of workers for whom the accepted practice is that they should be paid the same will often be paid the same, even if the presence of excess demand for one and excess supply for the other calls for different pay rates. Similarly, the job evaluation techniques that determine pay in many internal labour markets reward skill and responsibility in proportions which vary not with the relative availability of workers in the external market but with their relative position within the organisation.
6.2.3 Tastes and attitudes
In contrast to the neoclassical assumptions of given tastes and attitudes, the segmented labour market theory treats both of these as endogenous. In other words, the prejudices that some groups hold against others, the attitudes that some disadvantaged groups have about work and so on are not taken as given. There are reasons why these prejudices and attitudes develop as they do and understanding these is essential in order to understand how the labour market operates to the detriment of these groups. Thus, on the one hand, unstable inner-city employment can be attributed to an adverse interaction between individual attitudes to work and to wider issues, while on the other hand, it may be attributable to the type of work which may be repetitive, menial and low paid. The experience of secondary jobs cumulatively leads to disadvantaged workers developing high quit rates and other bad work habits. Workers employed in bad jobs become bad workers. Similarly, the confinement of married women to secondary segment jobs reflects preferences that are moulded by their subordinate positions within both family and society. Finally, our understanding of discrimination can only be achieved once we recognise that some groups in society actually benefit from it.
6.3 The roots of segmentation
Why does segmentation occur? One approach to this question focuses upon the evolution of the product markets, from the competitive and the localised to the producer dominated, and from the national to an international market. Technological change makes capital-intensive methods of production possible. Employers, however, are unwilling to undertake large-scale investment unless the product demand is stable and predictable; when demand is variable, labour-intensive techniques are preferred. A growing division is found between firms which cater for stable markets and those in unstable markets. Firms with stable product demand create primary conditions of employment, including, notably, job security. Firms which face unstable demand operate in the secondary segment of the labour market.
The contours of segmentation, defined according to stability, fluctuate depending on the state of the economy. When labour markets are tight and product markets favourable, employers seek to tie workers to the firm by expanding the number of primary jobs. However, when there is a downturn, particularly one that proves longer and deeper than anticipated, employers seek to increase the share of secondary jobs, emphasising the virtues of functional flexibility, in terms of workers being able to undertake a number of different tasks (multi-skilling) and numerical flexibility – varying the number of workers through lay-offs and short-time working.
The theory of segmentation advanced by radical economists (for example, Rebitzer, 1993) takes a different tack and focuses upon changing systems of organisation within capitalist firms. The key to segmentation, they believe, is the strategy employers use for the control and motivation of their workforces. Systems of labour control within organisations that had been developed prior to the 1950s, notably the personalised discipline of ‘simple control’ and the impersonal machine-pacing of ‘technical control’, proved increasingly ineffective as some firms turned into large corporations and worker organisation became stronger and more influential. These large employers turned instead to ‘bureaucratic control’. As well as providing job security and career prospects in order to win the loyalty of employees, they developed impersonal discipline and monitoring procedures. Internal labour markets emerged and with them the differences between the job rewards of primary employers and those of employers who lacked the incentive to abandon the secondary segment.
The forces which led some employers to create primary jobs thus began with the emergence of the large corporation. Simple control, the open, highly visible, direct command rule by supervisors over subordinates, proved less viable in large plants; the interdependence between workers in mass production systems made it difficult to measure the output of individual workers. Additionally, the power wielded by large firms over product markets permitted them to take a longer view of the market and its likely level of stability. As a result they could offer superior job rewards. At the same time, worker solidarity was undermined by the introduction of job ladders to achieve status differentiation between workers. The rationale for the job ladders was to motivate workers and generate commitment rather than develop skills. The internal labour markets of primary employers represents a sophisticated version of the traditional capitalist strategy of ‘divide and rule’.
Within the radical approach, the position of disadvantaged groups is seen as reinforcing the tendency toward segmentation. Segmentation limits the opportunities available to women and minority groups while the forces which support discrimination also help promote segmentation. The differentiation that exists between jobs is easier to maintain when it is associated with differences in workers' characteristics rather than the job itself.
In recent years there have been a number of changes in both product and labour markets in the UK which have led some researchers to rethink the nature of segmentation. Product markets have become more competitive, not simply in terms of increased pressure for lower prices but also in terms of demands for higher quality products and more frequent changes in product specification. In order to achieve and maintain a competitive advantage in these changing conditions, some firms have adopted employment policies which seek to motivate and promote commitment from workers. At the same time, there has been considerable deregulation in the labour market in Britain. This has allowed firms to be more flexible in determining the conditions under which they employ workers and some firms have taken the opportunity to directly reduce their labour costs thereby moving towards secondary segment employment. Other organisations, however, have used the opportunity to introduce innovations such as team-working, multi-skilling and quality circles. Attempts to promote motivation and commitment are based on the philosophy of human resource management, thus moving the organisations into (or further into) the primary segment. However, the types of organisations which benefit from employment practices that foster stability and commitment are not only those traditionally found in the core sector and the simplistic dichotomies that have traditionally underpinned the segmentation approach have given way to differences that are a matter of degree rather than of kind.
The following case study examines the consequences of deregulating the UK docks industry. This is an industry that has used deregulation in the labour market as a way to directly reduce its labour costs. In the process, however, it has moved from the organised, primary sector into the secondary sector.
Docks: The payback
Docks deregulation has led to more millionaire managers, more redundancies, and most alarmingly, more accidents at work. Recent events at Tilbury demonstrate this dramatically. Chief executive John McNab has just pocketed £5 million from the sale of the port to Forth Port Authority. The authority, incidentally, paid nearly four times for the shares than the price paid to the dockers who were made redundant. Forth paid £81.01 for each share whereas at Tilbury the dockers were forced to sell their share for a maximum of £22.72.
To make the sale of the port an attractive proposition, the number of dockers – or cargo handlers as they are now called – has been slashed from nearly 800 to about 300 since deregulation five years ago. And the accident rate among those left has more than doubled. Before deregulation, the national dock accident rate was 3.1 per cent. Since then it has risen to 7.2 per cent. And this figure probably understates the real rate because of the increased use of casual workers, who are less inclined to report accidents.
At Tilbury, the accident rate is even higher – it stands at 7.8 per cent. This figure comes from statistics compiled by the Port Safety Organisation, to which the employers are affiliated.
Stress and fatigue are obvious factors in this increase. And that is hardly surprising when more arduous conditions of employment have been introduced at Tilbury, including compulsory overtime and double shift working. A recent Health and Safety Executive information sheet on dock work fatigue stated:
The causes of fatigue can include not only severe physical effort but also the effect of working at times that are contrary to the body's natural inclinations, e.g. at night or on some systems of shift work, intense concentration and working continuously for long periods … This can lead to stevedores failing to ensure that they are in a safe position with the result that they are hit by a falling object or struck by a swinging load.
John Connolly, national docks and waterways secretary of the T&G, commented on the similarities of what has happened at Medway:
Tilbury was sold to the management and employees buy-out group for just £34 million and they have now sold it for £130 million … The position is very similar to what happened in Medway where shares were sold to staff but were soon followed by an exercise of cutting staff numbers and reducing their terms and conditions of employment. When the men refused to accept these proposals they were made redundant and were paid just £2.50 for each of their shares. Six months later these same shares were sold for £38.50 each in a takeover.
At Tilbury the signs have been evident for two years that the port has been consistently reducing the number of people employed and imposing more arduous conditions of employment, while bringing in casual labour.
Earlier this year tenders to buy the port were asked for and the successful tender came from Forth Ports Authority who bought it as a low cost base, with a low workforce with reduced conditions of employment. This had been done on the back of casual labour and imposed conditions.
At the same time there has been a significant increase in industrial injuries in the ports generally, despite the efforts of the Port Safety Organisation.
Tug workers are also suffering from attacks on their working conditions. There has been reduced manning on tugs combined with increased working hours,' said John. ‘The Health and Safety Executive has stated that the longer hours, use of casual workers, and worsening conditions has led to an increase in stress and fatigue in the industry.’
6.4 Empirical analysis
Three key hypotheses have been the focus of empirical evaluation of the segmented labour market theory. First, that the labour market can be represented as comprising at least two well-defined and self-contained segments. Second, that the labour market behaviour of workers and firms in each segment requires a different set of behavioural hypotheses. Finally, that there is limited mobility between the segments reflecting institutional and social barriers in the labour market rather than a lack of productive ability among lower segment workers.
The proposition that there is a clear and evident separation between a primary and secondary segment of the labour market represents a principal hypothesis of the dual approach. It is one, however, that receives only modest support in the empirical literature (see McNabb and Ryan, 1990). In general, there is little evidence of clusters of firms into core and periphery groups on the basis of the various characteristics that supposedly define the two segments. For the UK, however, has found that while firms do not cluster into distinct groups or sectors, there is clear evidence that some characteristics, in particular characteristics such as monopoly power, size of establishment and union density (variables that are associated with the core sector) are strongly correlated, and that the correlations identify features of the underlying industrial structure that are consistent with a segmented labour market approach (McNabb and Whitfield, 1996). Similarly, the employment of women and casual workers, and the use of part-time labour are also correlated, highlighting the importance of gender in identifying differences between firms. Moreover, the pattern of correlations that emerges from this work is also found to affect labour market outcomes such as the incidence of low pay, employment stability, and so on. Thus, while there is little evidence to support the notion of duality or even of identifiable segments, the industrial structure, the product market and its link with the labour market are consistent with a segmentation approach.
Much of the empirical work on the segmentation approach has, however, dealt with the unequal treatment of comparable workers between segments. Initial attempts to test this hypothesis focused upon whether incremental changes in labour quality are more highly rewarded in the primary segment than in the secondary segment. The basic empirical approach adopted to test this hypothesis involves two steps. First, a sample of workers is divided into two groups to represent the primary and secondary segments. Second, multiple regression techniques are used to estimate wage equations (similar to the ones considered earlier) so that the basic hypothesis can be tested. In general, the proposition that education is rewarded more for primary workers than for employees in the secondary segment is supported by the results of a number of studies (McNabb and Ryan, 1990). Typically, these find negligible gains in annual earnings among (variously classified) secondary segment workers from increases in years of schooling and work experience. This contrasts with the marked benefits recorded for both in the primary segment. Some contradictory evidence may, however, also be found in the literature. Several studies report that the returns to schooling and age, while lower in the secondary than in primary segment, are nevertheless economically strong and statistically significant.
The example detailed below, based on work by McNabb (1987), tests for segmentation using earnings functions estimated for core and periphery industry groups. The basis for this division is two variables typically associated with disadvantaged employment: the proportion of women employed and the proportion of employees not covered by a collective agreement. On the basis of these two variables, industries are defined as either being core or periphery.
The data in the example came from the 1975 General Household Survey in which male employees of ages 16 to 64 were interviewed. The key variables were:
| Annual earnings | the dependent variable |
| Schooling | years of schooling |
| Experience | years of work experience |
| Experience2 | the experience variable squared |
| Weeks | weeks worked per year |
The schooling and experience variables provide an indicator of the human capital of each worker. The more experience and education an individual has, the higher the quality of his labour. It should be noted that if the employee has worked for only a few weeks this will adversely affect his annual earnings, thereby giving a false picture of the relationship between these earnings and human capital. The weeks variable has been included to control for this.
Two of the wage equations reported in McNabb (1987) are shown in Table 6; the first is for the periphery segment, the second is for the core segment. The dependent variable is the logarithm of annual earnings. Note also that the weeks variable is expressed in logarithms (log Weeks).
| Core segment | Periphery segment | |
|---|---|---|
| Intercept | 1.39 | 2.12 |
| Schooling | 0.67* | 0.63* |
| Experience | 0.65* | 0.55* |
| Experience2 | −0.0009* | −0.0008* |
| log Weeks | 1.21* | 1.10* |
| R2 | 0.4707 | 0.4517 |
| Sample size | 1641 | 3373 |
Footnotes
* denotes that a coefficient is significant at the 1% significance level or better (we can have 99% confidence in its statistical significance)For both segments of the labour market, the human capital characteristics of workers are positively correlated with earnings. In the periphery segment, for example, a coefficient of 0.67 shows the positive relationship between years of schooling and earnings. Note that there is a negative sign on the Experience2 term. This is a standard result in labour economics showing that beyond middle age, as workers get older, the effect of their experience has a diminishing impact on their earnings. Since a square of 50 years experience is much higher than the square of, say, 5 years experience, the squared term puts a greater weight on many years experience, thereby picking up the declining productivity of older workers.
It should be noted that all of the variables, apart from intercepts, are reported to be significant at the 1% significance level, which means that we can have 99% confidence in their statistical significance. In addition, the R2's for both equations are just under 0.5, which means that nearly 50% of the variation in wages is summarised by each regression equation.
We can now turn to a comparison of the coefficients for each equation. The dual labour market approach predicts that the return on human capital characteristics should be less in the periphery segment than in the core segment. In fact, Table 6 shows that the return on human capital is slightly higher in the periphery segment. The return on schooling is 0.67 in the periphery segment compared to 0.63 in the core segment. Similarly, the return on experience is 0.65 in the periphery segment and 0.55 in the core segment. In this example data, however, the coefficients are, in fact, very small, and it cannot be concluded that there is any significant difference between the return on human capital in the two segments. This particular evidence shows that a dual labour market does not exist for segments defined according to the proportion of women employed and the proportion of employees not covered by a collective agreement.
Evidence of segmentation can, however, be found if we look at the earnings of particular occupations. Table 7, again based on the analysis of the 1975 General Household Survey data by McNabb (1987), reports wage equations for professional and semi-skilled manual workers.
| Semi-skilled manual | Professional | |
|---|---|---|
| Intercept | −0.054 | 2.89 |
| Schooling | 0.047* | 0.007 |
| Experience | 0.077* | 0.034* |
| Experience2 | −0.011* | −0.0006* |
| log Weeks | 1.79* | 1.10* |
| R^2 | 0.556 | 0.500 |
| Sample size | 254 | 796 |
Footnotes
* denotes that a coefficient is significant to the 1% significance level or better (we can have 99% confidence in its statistical significance)Activity 4
Comparing the two wage equations in Table 7, examine the evidence that professional workers enjoy a higher return to their human capital than semiskilled manual workers.
Discussion
You can see that Table 7 provides some evidence for the existence of occupational segments. Workers in semi-skilled manual occupations are treated differently from professional workers. As they gain more human capital, in the form of schooling and experience, semi-skilled workers are not reimbursed, for each unit of human capital, to the same extent as professional workers. This confirms the insight of segmentation theorists that workers are rewarded differently according to the jobs they do. Even if workers have the same human cognition characteristics, the amount they are paid depends on the job they do. This conflicts with neoclassical theory which predicts that workers will be rewarded proportionately according to their level of human capital.
The final hypothesis that has received attention in the literature concerns the alleged lack of mobility between primary and secondary segments. This issue has received some attention in recent years as longitudinal data has become available. Concerning the rate of movement between segments, studies which impose clear frontiers between primary and secondary segments have generally found rates of upward movement in excess of the low levels suggested by the descriptive dual labour literature. Moreover, a considerable proportion of this upward mobility can be associated with the possession of increased labour quality.
7 Policy issues
There are several issues we need to address concerning anti-discrimination policy. The first involves the different policy prescriptions that can be derived from the theories we have considered. The various theoretical approaches provide different explanations for why discrimination occurs and it follows that these will produce different types of policies to deal with discrimination. Second, the empirical work that has been carried out to explain gender and racial earnings differences also provide significant insights into policy issues. Finally, we can examine the actual policies that have been introduced to deal with discrimination and the impact they have had.
The neoclassical analysis of discrimination points to two main issues that need to be addressed by anti-discrimination policy: the need to promote competition in product and labour markets, and the need to break down informational barriers that act against particular groups of workers. There are, however, divergent views as to how both can be achieved and not all neoclassical economists accept the efficacy of direct intervention in wage and employment determination. According to this approach, the aim would be to promote a ‘market solution’ for dealing with labour market discrimination and propose policies which enhance competition and reduce the restrictive practices of employers and trade unions. Such policies, they argue, will promote greater choice in education and housing markets, improve occupational mobility and provide the right environment for the elimination of discrimination through market forces.
Other commentators, however, stress the prevalence of market failure and the need for government intervention. Such intervention need not be direct, such as fixing wage levels, but could take place through compensatory public expenditure and legislation which offsets the disadvantages faced by particular groups in society. For example, we have already noted that the earnings of married women are depressed by intermittent work patterns due to family responsibilities. In part, this can be addressed by the extension of job protected maternity leave. Although Britain has had maternity leave legislation since 1976, it is far from universal. In addition, although it was traditional for women not to return to work when their children were young, this trend is declining. In 1979, 24 per cent of young mothers with children under the age of nine months were in employment. By 1989 this had increased to around 46 per cent (Joshi et al., 1985). In part this reflects changes in social norms about women with young children working. Increased financial pressures on families and a change in employers’ attitudes have also contributed. The evidence indicates that women with job protected maternity leave have significantly higher earnings than women who do not, other things equal. Significant improvements in the earnings of women have also been found for policies aimed at improving childcare provision. These increase participation, enable women to work full-time rather than part-time and thus increase women's earnings: empirical analysis indicates that these effects are especially significant for lone parents. Other policy measures include retraining schemes which enable women returning to the labour market to come back to jobs similar to the ones they left and restructuring jobs to ensure that they can be done by people who also have domestic responsibilities.
Segmentation theory, in contrast, emphasises occupational segregation and the inability of women and minority ethnic groups to gain access to favourable jobs. This does not reflect a lack of ability on their part but, rather, barriers to entry to favourable employment. The most commonly advocated policies are those involving positive discrimination, such as job quotas for more favourable jobs or the disproportionate provision of more resources for education and training, and affirmative action policies which encourage the recruitment and promotion of disadvantaged workers.
Direct intervention in wage determination in Britain has primarily been achieved through the use of equal pay legislation. The efficacy of direct wage adjustment as a policy to overcome discrimination depends, in part, upon the impact it has on employment. Some economists argue that the relationship between wage increases and employment is such that the resulting job losses would be small. In addition, it is possible that increasing wage levels in secondary segment jobs would break the link which is seen to exist in a segmented labour market between low pay, job instability and the lack of access to better paid jobs. Paying higher wages in secondary jobs may encourage commitment on the part of secondary workers.
In Britain, the Equal Pay Act was passed in 1970 to ensure that people doing broadly similar work should be paid the same. The Act provided for a gradual move towards full implementation by 1975. In 1975, the Sex Discrimination Act, last amended in 1999, was also passed which made it illegal to discriminate on the basis of gender and marital status in aspects of employment other than pay. The Sex Discrimination Act was supposed to check any tendency that the Equal Pay Act might have to make it harder for women to get jobs. In so far as women did different work from men – and there was evidence that some employers altered job content to ensure that dissimilar work was done (see Snell et al., 1981) – then the Equal Pay Act would not impact on the gender wage differential. In 1983 an amendment to the Act was introduced that both consolidated the original legislation and extended it to cover equal pay for equal work within a firm. This extension of the law came from the EU and, among other things, sought to address the practice of re-defining jobs in order to pay women less than men. Whether the introduction of equal pay legislation has had a positive effect on the relative earnings of women has been and will continue to be subject to empirical scrutiny (Zabalza and Tzannatos, 1985). It is certainly the case that the male-female differential narrowed during the five year implementation period, though some commentators attribute this to the impact of incomes policies which were also in effect during this period. However, the research indicates that the increase in relative female pay was only marginally affected by the operation of incomes policies at that time and it did not reflect a movement of female employment to higher paying sectors. Rather, the narrowing differential can be attributed to female earnings increasing in some jobs for which they had been previously underpaid. Moreover, what limited evidence is available does indicate that these changes had little negative impact on the employment of women.
The beginning of the twenty-first century has nevertheless witnessed several acts being approved to ban discrimination of several types in the UK: age, homosexuality, transsexuality, religion, disability, gender; the role of institutions is playing a larger role in the labour market to correct or prevent discrimination.
8 Conclusion
In this course we have examined a number of explanations for why labour market disadvantage, such as low pay, unemployment, and so on, falls disproportionately on certain groups within the labour market. We have shown that these explanations basically fall into two broad schools of thought, the orthodox or neoclassical approach and institutional models of labour market segmentation. The former attempts to explain the distribution of disadvantage in terms of human capital theory and utility maximisation. Human capital theory simply says that some people earn less than others and fare worse in the labour market because they invest less in education and skills and because they show less commitment to the labour market. In a sense, we are explaining labour market inequality in terms of factors found to be closely linked to labour market outcomes.
The neoclassical approach also recognises that discrimination exists in the labour market. Indeed, the approach adopted by orthodox economists (based upon the early work of Gary Becker) has been used to estimate how much discrimination does exist. These estimates show how much of, say, the earnings differential between men and women reflects differences in productivity-related characteristics and how much is due to discrimination. The problem that proponents of this approach face is why does discrimination take place in the first place? Or, using the concepts employed by these economists, where does the ‘taste’ for discrimination come from? This is especially puzzling when, as you have seen, to discriminate actually imposes a cost on the economic agents who choose to discriminate.
The alternative approach, the segmentation theory, develops an explanation of discrimination and labour market disadvantage based on the premise that the labour market comprises non-competing groups of workers, some of whom have access to ‘good’ jobs and others who only have access to ‘bad’ jobs. The allocation to the low wage, secondary segment is not based on education or training but on the self-interest of dominant groups within the labour market. This approach, which seems to provide an analysis that derives more closely from the actual experiences of those who are discriminated against and marginalised in the labour market, does not perform well when subject to empirical scrutiny. Whether this reflects the nature of the tests employed to date by labour economists is an important question beyond the scope of this course.
Finally, we have touched upon a number of policy issues. The two approaches we have examined offer very different prescriptions. At one extreme, neoclassical economists support laissez-faire policies which promote competition in the labour market. At the other, segmentation labour economists see the need for intervention in the labour market to promote the interests of marginal workers. Many labour economists who see themselves as orthodox would, however, not disagree with the need for some form of intervention but would focus this on enabling disadvantaged groups to get access to better education and to training, and in the provision of such services as childcare facilities which can improve women's involvement in the labour market.
You now have the opportunity to solve the questions we prepared in the following activities. Answers can be revealed by clicking on the link provided.
9 Activities
Activity 1 Life cycle earnings
The New Earnings Survey publish various labour market statistics including the following information.
| Average gross weekly pay (in £) | ||
|---|---|---|
| Age | Females | Males |
| Under 18 | 125.2 | 127.8 |
| 18 to 20 | 160.9 | 180.7 |
| 21 to 24 | 218.8 | 263.8 |
| 25 to 29 | 281.5 | 331.8 |
| 30 to 39 | 320.1 | 405.8 |
| 40 to 49 | 301.2 | 445.8 |
| 50 to 49 | 272.5 | 420.5 |
| 60 to 64 | 236.0 | 341.3 |
To what extent does the information in Table 8 support the view put forward in Section 5.3 that the age–earnings gap increases with age?
Answer
The general impression that can be seen from Table 8 is that female pay is less than male pay in all age ranges, although at under 18 this difference is negligible. Whether or not the gap between males and females increases, can be seen more clearly in Figure 5. This shows that male pay appears to grow until the 40–49 years age mark and then starts to decline, while female pay declines after the 30–39 years age band. Human capital theory predicts that women will earn less than men as they spend less active time in the labour market and are less likely to receive the same level of training and promotion opportunities. In Figure 5 female earnings range from 98 per cent of male earnings in the under 18 group to 65 per cent of male earnings in the 50–59 age range. In the 60–64 age range there is a slightly narrowing of the gap (69 per cent) as more males take retirement.
Caution needs to be taken here before making conclusive judgements, but it would suggest that a different profile in male and female life-time earnings does exist. It has to be recognised, however, that the data presented here is a snapshot and does not follow the same workers throughout their working lives. Nevertheless, the evidence would seem to support the view in the chapter that the gap between male and female pay generally widens as age increases.
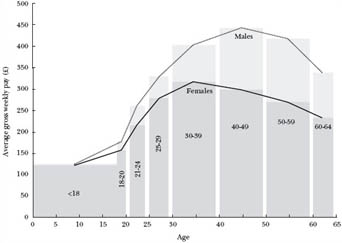
Activity 2
Read the following statements and decide whether they would fit into the segmented labour market view. Explain your reasoning in each case.
An individual's productivity is the main determinant in his or her pay.
There is equal access and mobility for workers between sectors.
The labour market generates inequality in society rather than merely reflecting the inequality of that society.
The policy implications of segmented labour market theory include legislation and a more interventionist approach.
The labour market can only be explained by examining social and institutional factors affecting that market.
Answer
False.
Segmentation theorists would argue that it is the sector of the labour market in which individuals are employed that determines their pay and conditions. A neoclassical economist observing ‘bad’ jobs would be more likely to argue that such workers have less human capital, are less productive and therefore get less pay. Segmentation theorists would argue that the ‘bad’ jobs predominate in the secondary sector and a lack of training and investment in that sector keeps wages down.
False.
One characteristic of a segmented market is that mobility between sectors is limited. There will be movement within each sector but not across. Such factors as discrimination will strengthen the barriers to mobility.
True.
The argument here is based around whether the labour market, through market forces, reflects the fact that workers are unequal in their productive capacity and therefore earn different returns, or whether it is the labour market itself that generates inequality through dual markets. The segmented market approach sees the labour market as treating primary and secondary sector labour unequally. Returns to labour do not reflect potential productivity but actually limit such potential in the secondary market.
True.
The policy implications for a neoclassical economist is that workers on lower pay need to increase their human capital, thereby increasing their returns for companies. Educational and training reforms would be paramount to this viewpoint. Segmentation theorists would press more for legislation and intervention in the market place such as antidiscrimination policy. There would also be an acceptance of the role of trade unions in bargaining for workers in the secondary sector.
True.
The segmented theorist would put forward the view that it is impossible to explain the behaviour of the labour market in relation to the rewards of individuals in it without taking social and institutional factors into consideration. Neoclassical economists would probably state that such factors can be incorporated into their own framework.
Activity 3
This activity examines evidence on three hypothetical labour markets. You will need to both interpret what is being shown by the graphs and then in turn show how they apply to the theory of segmentation.

Examine the three distributions of earnings as shown in Figure 6 overleaf. Which of these (if any) could be argued to be supportive of a dual labour market? Explain your reasoning.
Answer
An examination of the three markets in Figure 6 would suggest that (b) and (c) are segmented markets. (b) is an example of strict duality where two clearly defined sectors are evident. It is clear that the primary sector with the ‘better’ high earning jobs is separate from the other jobs of the secondary market. Note that since annual earnings are considered, the often part-time, casual nature of work in the secondary labour market will be reflected in these frequencies.
(c) could be described as having ‘heuristic’ duality where a case could be made that while there is no strict duality, there is a spectrum of what could be described as ‘good’ and ‘bad’ jobs. Market (a) with uni-modality and a relatively small dispersion would suggest a competitive market.
Activity 4
This activity gets you to think through the various theories you have examined and apply them to a particular article.
Read the following article and answer the questions that follow.
HOW TO ISOLATE THE RACIST EMPLOYER: SIMPLISTIC ECONOMIC THEORY GIVES FALSE HOPE TO BRITAIN'S MINORITY ETHNIC GROUPS
Minority ethnic groups form a small but growing proportion of Britain's 58m population. From 4 per cent in the 1970s, their share rose to 5 per cent in the late 1980s and it should stabilise eventually at almost double that level.
As these relatively young communities come to be integrated more fully into the labour market it has often been assumed that the economic disadvantage they suffer relative to the majority white population should gradually erode. But recent trends suggest not.
Monority ethnic groups in the UK labour market
| Hourly earnings (£) | Employed % | Unemployed % | Inactive % | |
|---|---|---|---|---|
| White | 7.44 | 58 | 5 | 37 |
| All ethnic | 6.82 | 50 | 10 | 40 |
| Black | 6.92 | 53 | 13 | 34 |
| Indian | 6.70 | 59 | 8 | 33 |
| Pakistani/Bangladeshi | 5.39 | 32 | 11 | 57 |
According to the annual General Household Survey, the labour market position of blacks deteriorated relative to that of whites between the 1970s and 1980s. The difference between the black and white wage rose from 7.3 to 12.1 per cent while the difference between unemployment rates rose from 2.6 to 10.9 percentage points.
And things have got worse in the last few years. During the 1980s and early 1990s the unemployment rates of the minority ethnic groups behaved ‘super cyclically’ which is to say they did worse than the rest of the population when the economy was doing badly and better when it was doing well. […]
Identifying the source of ethnic differences in labour market performance is no easy task. A typical approach is to look at the differences in such factors as age, education, work experience, job description and type of employer. Any residual wage gap is assumed to be the result of ‘discrimination’.
Nobel prize winner Kenneth Arrow, defined discrimination in this sense as ‘the valuation in the market place of personal characteristics of the worker that are unrelated to productivity’. The major flaw with this approach – aside from the inevitable measurement difficulties – is that discrimination may also play an important part in determining people's productivity by affecting their access to educational opportunities.
The analysis is further confused by the fact that differences between circumstances of the various minority communities can be bigger than the differences between the minority ethnic groups as a whole and the white population. Nonetheless it is clear from everyday experience that discrimination remains a pervasive influence. So what could or should be done?
Imagine that a racist employer would not take on any ethnic minority workers because he believed them lazy, less intelligent or less dependable than their white counterparts. In the looking-glass world of simplistic economic theory these attitudes would receive their just desserts. Enlightened employers would attract the best ethnic minority candidates, boosting their productivity and allowing them to undercut racist employers and drive them out of the market.
Howard Davies, the deputy governor of the Bank of England therefore concluded in a recent speech to the Equal Opportunities Commission that one policy response should be to take a tougher attitude towards monopolies.
But while there are many good reasons to promote competition this may not be one of them. Predicting a would-be employee's potential productivity is expensive, time consuming and inherently uncertain. If an employer discerns that the productivity of whites is, on average, higher than that of blacks – say because of educational differences – then he or she may use race as a low-cost screening method.
This is clearly undesirable ex post if a high quality black candidate is passed over in favour of low-quality white. But in a world of incomplete information it may be an entirely rational way ex ante for an employer to maximize his profits. If that were the case then tougher competition might actually encourage discrimination.
This same uncertainty about individual productivity also makes it problematic to simply legislate against discrimination, because it is difficult to prove it is taking place. From a libertarian perspective, one might also argue that however distasteful it is to right-thinking people that employers, co-workers and customers discriminate against minority ethnic groups, that is not sufficient reason to legislate against it if falls short of racial hatred.
The best way to tackle racial disadvantage in the labour market may therefore be to concentrate on areas such as education. Studies in the US have traditionally concluded that between 30 and 50 per cent of the black–white wage gap is the result of discrimination. But Derek Neal of Chicago University and William Johnson of Virginia University argued last year that most of this residual in fact reflects a skill gap which can in turn be traced at least in part to observable differences in the family backgrounds and school environments of black and white children.
In Britain the proportion of 16–24 year olds from minority ethnic groups in full-time education is already more than half as a high as the proportion of whites. Pressing home this advantage would probably be a more effective policy response than relying on competitive pressures or legalistic regulations.
Source: Robert Chote, Financial Times, 17 June 1996
To what extent does the table in the article suggest that minority ethnic groups are disadvantaged in the labour market?
Critically assess the policy advocated by Howard Davies (’… a tougher attitude towards monopolies’) to reduce discrimination in the labour market.
Answer
From the table in the article it can be seen that in terms of earnings white workers have a considerable advantage. Across the different ethnic groupings workers in the Pakistani and Bangladeshi community have the lowest average earnings at £5.39 compared to £7.44 among white workers. In terms of employment rates, Indian workers with 59 per cent employment is higher than the black population with 53 per cent, but Indian workers’ hourly earnings are less than those for black workers. Only 32 per cent of those of Pakistani and Bangladeshi origin are employed with hourly earnings of £5.39 being the lowest of all ethnic groups. Overall a clear picture emerges of white workers faring considerably better in the labour market compared to minority ethnic groups.
Howard Davies’ policy proposal is in line with the neoclassical theory of Becker (see Section 5.2). Becker's model assumes competition will drive out the discriminating employer as their profits are reduced. The article describes a ‘looking-glass world of simplistic economic theory’ and how enlightened employers would realise that they could undercut rivals by employing quality workers from minority ethnic groups. The analysis would suggest that the discriminating firm will be forsaking profit to those firms who are non-discriminating. Such firms would be forced to leave the market as they begin to make losses.
However, if workers are faced with a dual market some will find themselves in a secondary market with poor conditions and pay that is not directly determined by their levels of productivity. They will find it difficult to move away from these ‘bad’ jobs and into the primary sector where better jobs exist and a more interventionist policy would be needed. Discrimination may be so endemic to the two-tier labour market that opening up competition will not be sufficient to overcome the problem. The severity of this institutional constraint is perhaps evidenced by the high proportions of people from minority ethnic groups who attend full-time education but are unable to break into the primary sector.
Activity 5
Table 10 shows a wage equation estimated by Kuhn (1987) using a sample of workers taken from the Canadian ‘Quality of Life’ Survey. The dependent variable, (log) hourly wages, is regressed on various individual characteristics, such as the age, education and union membership of the sample of workers. The sample contains persons who normally work at least 20 hours a week and are over 18 years of age.
Interpreting the results in the table, are women discriminated against in comparison to men in the Canadian labour market?
(Hint: Take a look at the wage equations earlier in the course: statistical discrimination (Section 5.3) and empirical analysis sections (Section 5.4).
| Men Coefficient | Women Coefficient | ||
| Intercept | 1.260 (11.455) | 1.165 (9.708) | |
| Age | 25–34 | .095 (1.792) | .116 (2.275) |
| 35–44 | .227 (3.661) | .156 (2.557) | |
| 45–54 | .195 (2.955) | .024 (0.375) | |
| 55–64 | .180 (2.571) | .024 (0.279) | |
| 65–76 | –.607 (–3.866) | –.190 (–0.848) | |
| Education | 8 years | .017 (0.193) | –.156 (–1.405) |
| 9–11 years | .216 (2.769) | .064 (0.667) | |
| 12 years | .274 (3.425) | .175 (1.882) | |
| 13–15 years | .420 (5.000) | .267 (2.697) | |
| 16 years | .613 (6.888) | .539 (5.233) | |
| 17+ years | .655 (7.043) | .581 (4.611) | |
| Tenure with current employer | 1 year | .050 (0.588) | .138 (1.747) |
| 2–3 years | –.008 (–0.101) | .132 (1.760) | |
| 4–5 years | .175 (2.134) | .144 (1.714) | |
| 6–10 years | .153 (1.866) | .253 (3.163) | |
| 11–20 years | .241 (2.869) | .424 (4.930) | |
| 21+ years | .287 (3.154) | .401 (3.457) | |
| Previous experience dummy | .059 (1.553) | –.061 (–1.564) | |
| Technical school | .071 (1.127) | .017 (0.266) | |
| Union membership | .089 (2.697) | .112 (2.800) | |
| Physical disability | –.022 (0.550) | .060 (1.333) | |
| Number of observations | 658 | 448 | |
| R2 | .246 | .309 |
Footnotes
t statistics are shown in bracketsAnswer
To discuss the evidence provided in Table 10 we need to compare both the size and sign of the coefficients, and their statistical significance. Consider first the coefficients for age, which provide a proxy for the human capital accumulated by workers as they get older. The coefficient 0.227 shows that for Canadian men the return from being aged between 35 and 44 in terms of the (log) wage received is 0.227. Compare this with the return of 0.156 for Canadian women in this age group. This particular comparison shows that there is discrimination because the return for women is less than the return for men for the same amount of human capital. Women also fare worse for ages 45 to 54 and between 55 and 64, where the coefficients are 0.195 and 0.180 for men, and 0.024 and 0.024 for women. Note, however, that for the 25 to 34 age group, the coefficient for women is larger at 0.116 than the 0.095 for men.
These comparisons should also take into account the statistical significance of each coefficient. We need to make a decision as to whether a coefficient is statistically different from zero, or in the formal language, whether the null hypothesis H0, that the coefficient is zero, can be rejected. Since for both men and women the number of observations are easily above 29, the critical value is for infinite degrees of freedom. For a two-tailed test at the 5 per cent level, the critical value is therefore 1.96. Under a two-tailed test, the alternative hypothesis Ha is that the coefficient is either more or less than zero. If we were carrying out a test at, say, the 10 per cent level of significance the critical value would be 1.645.
Looking at Table 10, we need to compare the t statistics, which are shown in brackets, with the critical value of 1.96. For example, the coefficient for men aged between 45 and 54 has a t statistic of 2.955. Since 2.955 > 1.96, the null hypothesis is rejected which means that the coefficient 0.195 is statistically significant from zero at the 5 per cent level.
Note that for this 45 to 54 age group, the t statistic for women is only 0.375. Since 0.375<1.96, the null hypothesis is accepted at the 5 per cent level – the coefficient is not significantly different from zero. This further exaggerates the extent of the discrimination in relation to this particular variable: since the return on age is now found to be 0.195 for men and zero for women.
For some of the other variables in the table, women get a higher return for their human capital than men. For example, consider the variable for 6 to 10 years tenure with current employer. The female coefficient of 0.253 is significant to the 5 per cent level since the t statistic 3.163 is more than the critical value of 1.96. But the t statistic for the male coefficient is 1.866 which is less than the critical value of 1.96. This means that the male coefficient is not significantly different from zero at the 5 per cent level while the female coefficient is statistically significant. Women earn more for this amount of tenure than men. They also earn more for tenure of between 11 to 20 years and for 21+ years, although in these cases the male coefficients are statistically significant.
To test for discrimination more formally, the decomposition method introduced in Section 5.4 would have to be followed. However, the insights drawn from Table 10 in the discussion above show that the evidence for discrimination against women is inconclusive, since the human capital coefficients are larger for women than for men for some of the variables given in the table.
Conclusion
This free course provided an introduction to studying sociology. It took you through a series of exercises designed to develop your approach to study and learning at a distance and helped to improve your confidence as an independent learner.
References
Acknowledgements
This chapter adapted for OpenLearn is from ‘Microeconomics by Susan Himmelweit, Roberto Simonetti and Andrew Trigg, published by Thomson Learning in association with The Open University, 2001 and ‘Markets’ one of the three core books from the D319 course Understanding Economic Behaviour: Households, Firms and Markets.
The content acknowledged below is Proprietary (see terms and conditions) and is used under licence.
Grateful acknowledgement is made to the following sources for permission to reproduce material in this course:
Course image: aotaro in Flickr made available under Creative Commons Attribution 2.0 Licence.
Table 10: Kuhn, P. 1987, ‘Sex Discrimination in Labour Markets: The role of statistical evidence’, The American Economic Review, 77 (4), September 1987, American Economic Association.
All other materials included in this course are derived from content originated at the Open University.
Don't miss out:
If reading this text has inspired you to learn more, you may be interested in joining the millions of people who discover our free learning resources and qualifications by visiting The Open University - www.open.edu/ openlearn/ free-courses