

6 Traffic-light system
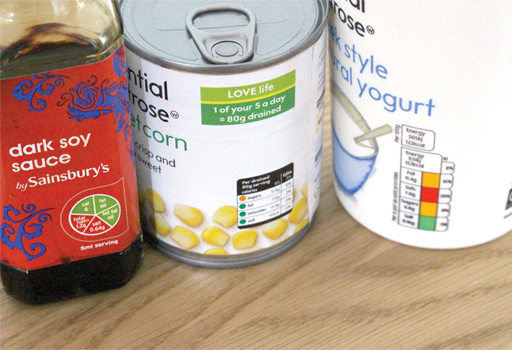
You will notice in Figure 8 that the nutrient values are coloured red, amber or green, depending on whether the value is high, medium or low. Table 2 shows the values for each colour per 100 g of food product. These values are based on the Scientific Advisory Committee on Nutrition (SACN). You can find out more using this link (Gov.uk, 2018b) [Tip: hold Ctrl and click a link to open it in a new tab. (Hide tip)] .
| Substance | Green (low) | Amber (medium) | Red (high) |
|---|---|---|---|
| Fat | less than 3 g | between 3 g and 17.5 g | more than 17.5 g |
| Saturated fats | less than 1.5 g | between 1.5 g and 5 g | more than 5 g |
| Sugar | less than 5 g | between 5 g and 22.5 g | more than 22.5 g |
| Salt | less than 0.3 g | between 0.3 g and 1.5 g | more than 1.5 g |
The limits for 100 ml of drinks are half those given for 100 g of food – except for the salt value, which is unchanged.
The advantage of this way of presenting the data is that shoppers can see at a glance which are ‘healthier’ foods, without having to check the percentages. Manufacturers were originally concerned that shoppers might stop buying foods that were classed as red. Some were reluctant to adopt the traffic-light system. However, it has now been adopted by many.