
8 PV economics and environmental impact
As with any energy source, the cost per kilowatt-hour of power from PV cells consists essentially of a combination of repayment of the capital cost, including interest, and the operation and maintenance (O&M) cost.
The capital cost of a PV energy system is proportional to its rated power output, usually quoted in £ (or euros or dollars) per peak kW (£ kWp−1). This includes not only the cost of the PV modules themselves, but also the ‘balance of system’ (BOS) costs, i.e. the costs of the interconnection of modules to form arrays, the array support structure, land and foundations (if the array is not building-mounted), the costs of cabling, charge regulators, switching, metering and inverters, plus the cost of either storage batteries or connection to the grid.
Activity 4
From what you have learned so far, what would you say are the economic pros and cons of PV systems?
Answer
| Cons | Pros |
|---|---|
| initial capital costs of PV systems are currently relatively high | operation and maintenance costs are extremely low in comparison with other energy systems (but PV systems including batteries have additional maintenance requirements) |
| no fuel requirements | |
| no moving parts (except in the case of tracking PV) therefore less maintenance |
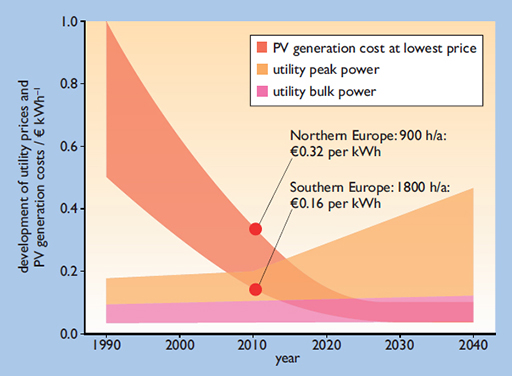
Over the past decade in many countries there has been a rapid decline in the price of electricity from PV and a steady increase in the price of electricity from conventional sources. In many regions with high solar radiation levels the price of PV power is already competitive with expensive daytime ‘peak’ power from electric utilities and auction prices for future developments are close to parity with off-peak ‘bulk’ prices, as you can see from Figure 13 which also shows projections of costs up to 2040.
In many countries contracts for very large PV systems >500 MWp are currently being sold in auctions for the lowest ‘bid price’. This has resulted in very low prices of under 4p kWh–1 in Mexico, Brazil, the USA, Saudi Arabia and the United Arab Emirates (IRENA, 2017). These prices are truly competitive with conventional fossil-fuelled generation from oil and gas.
In order for full grid parity to be reached in less sunny regions the installed cost per peak kilowatt of PV systems needs to decrease still further. The key to this lies in mass production, although technological improvements can also make a contribution. Historically, PV module production costs have dropped by more than 20% for every doubling of production quantity and in the past decade PV production has doubled every 2–3 years.

Figure 14 shows a breakdown of the capital costs of a large PV system in the UK in 2011, together with long-term projections of its likely costs in 2020, 2030 and 2040, these costs relating to a large, 10 MW ground-mounted system. The lines indicate the range of variation of capital cost estimates. They suggest that capital costs could be halved by 2030 and fall to perhaps a quarter of 2011 levels by 2040. The capital costs of smaller PV systems are expected to fall in similar fashion (CCC, 2011).
Having looked at the economics of PV, let’s now move on to its environmental impact.