Understanding and managing risk
Use 'Print preview' to check the number of pages and printer settings.
Print functionality varies between browsers.
Printable page generated Friday, 26 April 2024, 11:44 AM
Understanding and managing risk
Introduction
In this course we explore the subject of financial risk management. The processes of risk identification, risk measurement and risk management are explored. The course then goes on to examine reputational risk and operational risk.
This OpenLearn course is an adapted extract from the Open University course BB841 Managing financial risk.
Learning outcomes
After studying this course, you should be able to:
demonstrate knowledge of the range of financial and financial related risks facing organisations
understand the approach to risk management through risk identification, risk measurement and risk management (or mitigation)
understand reputational risk
understand operational risk and how to manage it.
1 Risk and the financial crisis
In September 2011, the eurozone governments were grappling with the debt crisis in Greece and the risks this posed to the banking system – given many banks had invested in Greece and other troubled European economies including Portugal, Spain and Italy. In the midst of this crisis one European bank – the United Bank of Switzerland (UBS) – announced that it had uncovered a huge and unexpected financial loss amounting to $2.3 billion as a result of the alleged activities of a rogue trader, Kweku Adoboli, based at the London offices of UBS.
Adoboli had allegedly run up these losses through transactions in the global equity markets – but had concealed these losses by establishing other fictitious transactions which covered up the actual losses the real transactions had made. Following the discovery of these losses, Adoboli was arrested and charged with fraud. At the time of writing he is on remand in prison awaiting his trial.
However, this was not the only consequence of the risk management failings at UBS.
Shortly after the discovery of the losses, the Chief Executive of UBS, Oswald Grubel, resigned. The bank was also criticised for its risk management failures by some of its largest shareholders. UBS subsequently announced plans to reduce its trading operations in London with a consequent loss of jobs.
This episode is yet another case of failings in financial risk management – indeed the use of fictitious transactions to mask losses on real transactions was a feature of previous risk management calamities at other banks, notably at Allfirst Bank in the US in 2001. Similarly, Adoboli’s actions mirror those of rogue trader Nick Leeson, infamous for his activities that led to the collapse of Barings Bank in 1995. Clearly, the lessons of the past have still not been fully learned. If you want to learn more about how to avoid such financial calamities then read on!
1.1 Risk management
The objective of Managing financial risk is not only to investigate the nature of different financial risks – looking at how they arise and how their extent can be measured – but also to explore how these risks, along with non-financial risks, can be managed. In your working life you may not play a direct role in financial risk management, but it is virtually inevitable that:
- Your organisation will, through its routine operations, generate or expose itself to at least some of the risks we examine. Understanding these risks is therefore essential for those wishing to develop well-rounded managerial competence.
- Your internal dealings with staff may link you to those who do have direct risk management responsibilities and understanding the nature of financial risks will help when having discussions or negotiations with them.
- For at least part of your career, you may work within your organisation’s finance department which has risk management responsibilities across the organisation’s balance sheet. Alternatively, you may have responsibility for auditing the work of the treasury function.
- In your dealings with customers and clients, you need to be aware of financial risks that may arise from the sale of products and the provision of services.
Box 1 'Organisation'
Throughout this free course, ‘organisation’ will be used as the generic term when referring to companies, governmental and other public sector bodies and ‘not-for-profit’ entities. The specific term for a particular type of organisation – e.g. ‘company’ – will, though, be used when referring to matters that are solely related to that particular type of organisation.
Additionally, if you make it to a senior management position – and particularly if you are on the board of a company or the senior management committee (or equivalent) of a public sector organisation – you will have managerial responsibility for those in the front line of financial risk management. If you lack competence in financial risk management you will not be in a position to perform your executive responsibilities properly. Indeed, you may recall the global banking crisis in 2007 and 2008 when executive and non-executive directors manifestly did not understand the financial risks that their banks were running, or turned a deaf ear to internal whistle-blowers who had highlighted the risk management failures in their bank’s business activities.
In the future, you may want to pursue a career in risk management – with an organisation, an auditing company or perhaps a regulatory body. The risk management business has grown over the past three decades in reaction to the glaringly apparent risk management failings of organisations. Certainly, since the global banking crisis, risk management has become a major growth area for employment around the world.
The objective, then, is to teach you the skills you need:
- in general management for managing financial risks
- if you are a risk management practitioner.
The study of risk management also requires an understanding of the International Financial Reporting Standards (IFRS) that apply to how financial instruments are used by organisations to manage financial risks. The key standard in this regard is IFRS 7 which covers disclosures in financial statements in respect of financial instruments. While the disclosures relate to accounting matters, they are of key relevance to the subject of risk management. This is because investors and other stakeholders will examine the disclosures made under IFRS 7 to help ascertain how exposed an organisation is to financial risks. Additionally, the very fact that these disclosures have to be made places a requirement on the managers of organisations to consider how they are currently managing financial risks – and this requirement should focus their minds on whether they are managing these risks properly!
Benjamin Franklin said that nothing was certain except death and taxes; the economist and 1990 Nobel prize winner Merton Miller revised this in his work on capital structure to debt and taxes. I think they both left out one other certainty – risk – but at least we can sometimes do something about risk and not merely allow the inevitable to happen!
1.2 The financial crisis – the cost of risk management failures
At the time of writing (in 2013), the global economy is in the aftermath of the financial crisis – principally a banking crisis – that emerged so spectacularly in 2007 and 2008. The features of the crisis demonstrated truly chronic failings in financial risk management. We will explore these failings throughout this free course.
The summary features of the crisis are well known.
During the 1990s and the first decade of the 2000s, many banks used funds borrowed from the wholesale markets – basically money borrowed from other banks and other financial companies – to expand their investment activities. While economic conditions were benign, with inflation and interest rates low and with the major economies experiencing steady economic growth and low unemployment, the risks inherent in this business model – which involved many banks expanding the size of their balance sheets at a fast pace – were not really exposed.
Things changed from around 2005/2006 as higher interest rates in the US triggered a sharp increase in defaults among customers – many of them with low incomes – who had borrowed funds to finance home purchases. This was the so-called ‘sub-prime’ debt crisis, where the term ‘sub-prime’ relates to the poor credit standing of those who had borrowed money.
So the start of the financial crisis was a significant example of credit risk – the risk that the money you invest is not repaid.
Very quickly, though, a credit risk problem turned into a liquidity risk crisis. As knowledge of the credit losses spread, those lending money in the wholesale markets became increasingly reluctant to provide funds to those they believed to be exposed to the sub-prime credit losses. Additionally, they began to exercise more general caution about the credit quality of the organisations they lent to.
The consequences of this shift in sentiment by lenders were inevitable. The cost of borrowing wholesale funds started to rise sharply and the depth of funds available shrank.
Those banks most reliant on wholesale funds to support their business were immediately exposed by what had become a liquidity crisis. One of the first casualties of this environment was Northern Rock Bank in the UK. This bank only avoided insolvency by being rescued by the Bank of England in 2007.
The combined credit and liquidity crisis continued to place many banks under severe pressure until, in September 2008, the collapse of the US investment bank Lehman Brothers triggered a virtual collapse of the global banking system. Autumn 2008 saw the governments and central banks of many of the world’s major economies taking emergency action to rescue their banking systems. This typically involved providing funding to deal with the liquidity crisis and injecting capital into the banks to accommodate the credit losses that the banks were incurring in their lending.
This ‘bail-out’ (financial rescue) of the banks – although essential to stabilise the financial system – understandably still evokes anger from the public.
The financial crisis not only provides vivid examples of credit and liquidity risks, but also the interrelationships between different types of financial risk. Indeed, the financial crisis also triggered certain non-financial risks, particularly reputational risk for those organisations found to be most vulnerable. The months following the peak of the crisis saw the management of these organisations publicly ridiculed.
One further significant development was that it became evident that many of the risk management systems being employed by organisations were not programmed to accommodate the scale of the problems that arose. Models that had previously been viewed as robust and trustworthy became revealed as unfit for risk management during such a major financial crisis. We will examine such failings later.
While the focus of attention during the early days of the financial crisis was on the near systemic failure in the global banking system, there were many other risk management calamities at a regional and national level.
In the UK, many local authorities (municipalities) had built up cash balances, largely from the sale of certain assets – principally, their stocks of rental properties for the public (council houses). This resulted in the authorities having funds to invest in the financial markets. In the middle of the first decade of the new millenium, many started to place funds with the Icelandic banks that had built up a presence in London and who were raising funds to finance their global investment activities. The scale of growth of these banks meant that they collectively had a balance sheet size in excess of the entire Gross Domestic Product (GDP) of Iceland itself!

The 2008 global banking crisis saw three of these banks – Glitnir, Lansbanki and Kaupthing Bank – collapse and rapidly end up in receivership. This left UK local authorities with, collectively, £953 million of credit exposure to these failed banks. Local authority treasury departments had relied on the credit ratings for these banks, supplied by the leading rating agencies – Standard & Poor’s (S&P), Moody’s and Fitch. These agencies had all rated them as creditworthy, at least until close to the point of their collapse. The local authorities consequently witnessed credit losses that attracted huge headlines and a parliamentary investigation. The investigation that followed led to criticisms of the reliance of the local authorities on ratings agencies, without looking to other sources to form effective credit risk judgements on the Icelandic banks. The so-called ‘credit crunch’ and the global banking crisis that began in 2007 brought attention to the notion of ‘liquidity risk’ – in effect, where organisations run out of money.
The Icelandic banks episode points clearly to the fact that the business of risk management and the risk of failures in risk management are not just the preserve of banks or private sector companies. Organisations outside the private sector are also exposed to financial risks and need to manage them effectively.
We have focused in this section on certain of the risk management failings revealed by the financial crisis. Our case studies will, though, not be confined to this recent period of financial history. Certainly risk management failings were not born in 2007!
Audiovisual activity
Activity 1 Risk management in action
Listen to the audio, Risk mapping and risk management, a discussion between:
- two treasurers of major companies – Paul Outridge of De La Rue and Neil Henfrey of Boots, now a brand for the international pharmacist Alliance Boots
- a banking risk management specialist – Hor Chan
- Head of the Department for Accounting and Finance at the Open University Business School – Martin Upton.
It examines the financial risks that organisations are exposed to and how they are addressed by management.
The audio contains some technical matters and terms that will probably be new to you. Do not worry about this, though. It is intended to give you a flavour of risk management in action and what risks organisations are concerned about.
You may be surprised, as I was to a degree, to see pension fund risk referred to in the audio as being a financial risk. Personally, I would see pension fund risk – the risk that organisational pension schemes fall into deficit – as arising from increasing longevity and the fall in returns on financial assets seen in recent decades. The former increases a pension fund’s liabilities due to the resultant need to pay out pensions for longer periods. The latter reduces a fund’s assets by reducing the returns on investments, which, in turn, may be re-invested.
However, increasing longevity is not a financial phenomenon and falling returns on assets are a result of adverse interest rate risk and equity price risk, both forms of market risk. So pension fund risk is really a form of market risk mixed with growing longevity. What do you think?

Transcript: Risk mapping and risk management
Music – 00:16
Music – dur: 00:05
The audio was recorded in 2006, but its contents are still very relevant for our understanding of contemporary risk management issues.
Case study
Activity 2 Risk in your organisation
Consider the risks that an organisation you know well is exposed to. It might be an organisation that you currently work for, or that you recently worked for, or one that you are familiar with.
If you are self-employed, the activity is still relevant to you since you should consider the risks you are exposed to given the nature of your business.
You may want to jot down some notes in the box below. Don’t forget to save them!
Discussion
How you answer this will clearly depend on the organisation you work for or the one you have focussed on for this activity. If you think carefully and work through the list of financial risks and financial-related risks (including operational risk) detailed in this free course, you may be surprised how exposed your organisation is to a variety of risks – even if your organisation is outside the private sector and/or small in size.
2 A helicopter overview of risk
2.1 Defining risk
Having looked at the general context of ‘risk’, we can now define more clearly what we mean by it and then categorise it into its main forms. We can then consider how we might analyse and manage both financial and non-financial risk for an organisation through risk assessment and risk mapping.
How do we define risk? You may have already met a couple of empirical definitions that cover the concept of the variability of stock prices (measured either by the standard deviation, or the beta of the returns of the stock or portfolio) as the definition of risk in the context of portfolio theory.
We now extend this into a more comprehensive definition.
The word ‘risk’ is thought to derive either from the Arabic word rizq or the Latin word risicum (Kedar, 1969, pp. 255-9). The two possibilities quite neatly combine to give us the meaning for the English term in our context. The Latin word originally referred to the challenge presented to seafarers by a barrier reef and so implied a possible negative outcome. The Arabic word, on the other hand, implies ‘anything that has been given to you (by God) and from which you draw profit’ and has connotations of a potential beneficial outcome.
A twelfth-century Greek derivative of the Arabic rizq related to chance outcomes in general with no positive or negative implications (Kedar, 1970). We can combine the above definitions to derive our concept of risk as being ‘an uncertain future outcome that will improve or worsen our position’.
There are two implied elements about this definition that should be noted:
- It is probabilistic – the likely outcome can be assessed, but is not known with certainty.
- The outcome may be favourable or unfavourable.
It should be noted that the definition does not necessarily imply ‘symmetry’, where the ‘upside’ and ‘downside’ are of an exact equivalent magnitude. Indeed in many risk situations the outcomes are skewed – for example, more ‘downside’ than ‘upside’ risk. For many financial matters, however, which are our main concern here, risk is more or less symmetrical or is assumed to be so. However, there can be dangers in this assumption – we will discuss these in more detail later on.
The term ‘risk’ as it is used in finance differs from the way it is commonly used in everyday life in that it can be quantified in terms of probabilities. In a situation where there are many potential outcomes, both negative and positive, and their probability cannot be quantified, the financial term to describe it is ‘uncertainty’, to differentiate it from risk (Russell-Jones and Day, 2005). Though outside the scope of this course, it is important to know that we can still assess and manage uncertainty through techniques such as ‘worst case scenario analysis’ (Crouhy et al., 2005).
2.2 The risk management process
An organisation’s attitude towards the various forms of risk to which it is exposed should be a direct interpretation of its business strategy. This has implications both ways: the strategy itself must address the appetite and capacity for risk within the business and the systems and actions of the organisation regarding risk should seek to attain the goals envisaged by the strategy. This process of linking risk exposure and risk appetite to an organisation’s policy is known as risk mapping and is a key part of the risk management process. It can be divided into sequential stages, as outlined in Figure 2.
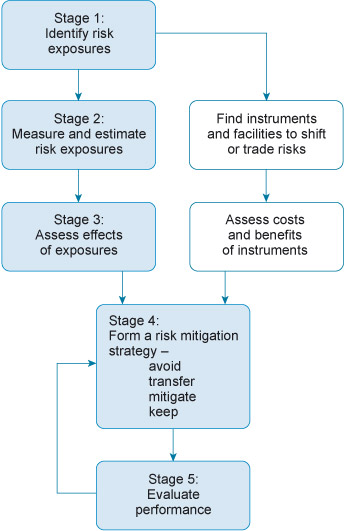
Stage 1: Identify risk exposures
There is no single or definitive way to subdivide risk. The key point, however, is to ensure that the categorisation chosen covers each type of risk and is understood by all those using the results. The process should be tailored to the size of the organisation and the complexity of the environment it faces. A small organisation may only consider a small number of risks and deal with them in a much more informal way than a company like Unilever. For the time being, let us consider the full range of risks – including financial and other risks – which an organisation could face in running its business. One possible way of subdividing risk categories is depicted in Figure 3.
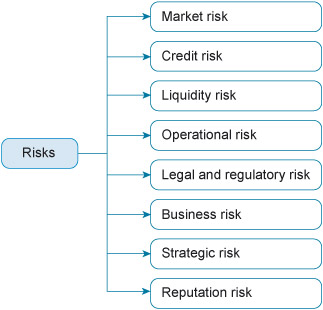
Financial risk
Financial risk is the focus of this free course and encompasses the top three risks in Figure 3. It refers to possible changes to the monetary value of wealth because of variations in cash balances (that is, liquidity) or in resources. Market risks include interest rate risk and foreign currency risk. You have already examined some aspects of financial risk management. You may have learned about gearing or leverage, which indicates the potential risk of future cash flows not being sufficient to service debt. Financial risk management does not take place in a vacuum; rather, it must be part of a larger, overall risk management strategy that takes into account non-financial risks. Managers have to balance the two types of risk. It may be advantageous, for example, for an organisation with a low level of non-financial risk to take on higher levels of financial risk to maximize its risk-return profile while the reverse is also true.
Operational risk
Operational risk is perhaps the most important and wide-ranging source of non-financial risk and accordingly is the only form of non-financial risk against which banks are explicitly required to hold capital. It embraces the risks arising from the failure of systems, controls or people. If key computer systems are not functioning, many organisations will have an impaired ability to deliver their goods and services, thereby adversely affecting earnings. If an organisation has an untalented or untrained workforce, its ability both to deliver current services and its capacity to engineer future development of the organisation is similarly impaired. Indeed, when looking at recent history there are several good examples of how operational failure has put organisations at a disadvantage relative to their competitors. Given the importance of this category of non-financial risk it is further explained in its own section later on.
Legal and regulatory risk
The second major category of non-financial risk arises from legal and regulatory forces which may cause financial losses to your organisation. It is of tremendous importance to certain sectors, such as banking, but much less important to some other industries. One example might be the recent changes in British tax laws that introduced a £2 billion windfall tax on oil companies: see Box 2.
Box 2 Statoil halts North Sea oil development over windfall tax

George Osborne is preparing to fend off a rebellion by the North Sea oil industry over his plan to impose a £2 billion tax on the sector.
The chancellor told the Treasury select committee that officials would contact Norwegian oil company Statoil, which has suspended development work on the new Mariner and Bressay fields to the south-east of Shetland while it studies the implications of the chancellor’s tax on the profitability of its operations.
Osborne’s £2 billion windfall tax on oil companies was a surprise measure in last week’s budget and will be used to offset a cut in fuel duty.
The North Sea oil industry is claiming that thousands of jobs are at risk and Statoil, which planned to operate from Aberdeen, said it would ‘pause and reflect’ before deciding whether to continue developing the fields which are due to come on stream from 2016/17.
Industry body Oil and Gas UK warned that the tax risked thousands of North Sea jobs. It called for immediate talks with the Treasury and an urgent meeting of Pilot, the government-sponsored oil and gas industry forum.
But Osborne defended the windfall tax to the MPs as ‘perfectly reasonable’ and insisted that Statoil had not yet cancelled any proposed investments. ‘They just want to talk to us about their investment plans,’ he said.
The chancellor, who came under fire from Labour MP John Mann for not knowing the exact amount of duty levied on a litre of petrol, insisted investment would increase despite the tax because of the surge in oil price.
The member companies of Oil and Gas UK – which include Shell and BP – met to discuss the new tax. Malcolm Webb, its chief executive, said the announcement had damaged trust in the government. It was now rerunning its survey of its members' investment and exploration plans. ‘The unexpected tax hike announced by the chancellor in last week’s budget looks to have been constructed hurriedly without rigorous analysis of its implications and has damaged investors' confidence in the UK as a stable destination for their capital,’ he said.
The Mariner and Bressay fields have estimated reserves of 640 million barrels. Bard Glad Pedersen, a Statoil spokesman, said the tax would have a ‘significant impact’ on the Mariner project. ‘We have to pause and reflect to evaluate what impact this will have and consider how to proceed after this. This is a project about to be developed. With this tax increase, there is a substantial impact.’
Peter Buchanan, chief executive of the Woking-based Valiant Petroleum, which specialises in smaller, marginal North Sea fields, said it would damage investment in the costlier fields, so North Sea production would decline faster.
‘The UK will import more oil and gas from parts of the world that contribute nothing to the Treasury. So increasing North Sea costs will have unintended adverse effects – it will reduce investment, put further pressure on oil and gas supply in the UK and ultimately could drive oil prices up further.’
The controversy is presenting significant political problems for the Liberal Democrats (Lib Dems) in the [UK] coalition government with reports that the party’s Members of Parliament in Scotland are planning to attack the proposal to protect their local party from a backlash by voters. The party is also struggling to defend seats around Aberdeen, the oil industry’s capital, against heavy pressure from the Scottish National party and Labour in campaigning for the 5 May Scottish parliamentary election. The latest opinion polls show the Liberal Democrats in Scotland are being very badly damaged by their links to the UK government, with their poll ratings 50 per cent down.
The city’s Press and Journal newspaper reports that two influential Lib Dem backbench MPs, Sir Robert Smith and Scottish party president Malcolm Bruce, are preparing to publicly criticise the plan. It has been defended by Michael Moore, the Lib Dem MP and Scottish secretary in the coalition cabinet, as the ‘right and fair thing to do’.
The Scottish National Party’s Treasury spokesperson at Westminster, Stewart Hosie, intensified the pressure by pressing Osborne to reconsider the tax during a Treasury select committee hearing in the Commons on Tuesday. Speaking after the meeting, Hosie said: ‘The tax changes announced by the Chancellor are totally ill-thought through and run the risk of diverting investment away from the North Sea. Statoil have already announced withdrawal from fields south of Shetland.
‘George Osborne must reconsider his plan before it endangers Scottish jobs further.’
Box 3 provides another example of legal risk, the recent fine of $308,000 that China imposed on Unilever for warning it might increase prices on some of its products.
Box 3 Unilever fined by China for price rise warning
Unilever and its rivals have been warning that higher commodity costs mean prices will have to rise
China has fined the consumer products giant Unilever $308,000 (£188,000) for warning it might increase prices on some of its products.
The National Development and Reform Commission (NDRC) said that comments by Unilever about possible price rises had created ‘market disorder’.
Both China and Unilever are struggling with higher commodity prices, including higher energy and food costs.
Unilever said it would abide by the agency’s decision.
The company told Chinese media some months ago that prices would have to rise, but Chinese officials said this had provoked panic buying.
The NDRC also said the warning had ‘intensified inflationary expectations among consumers’.
China, like other national governments, is battling to contain inflation, which is at a three-year high in the country.
Unilever, which sells a vast range of brands, including Cif cleaning products, PG Tips tea and Hellman’s mayonnaise, has been warning that it cannot keep absorbing higher raw material costs and will have to raise selling prices.
Its rivals, including Proctor & Gamble and Kraft, have also warned on prices.
All of them are increasingly looking to emerging markets, such as China, for growth.
While the amount of this fine is insignificant given Unilever’s size, the fact that it will not be allowed to raise prices in the huge Chinese market could have a substantial financial impact on the company.
Business risk
Business risk is another non-financial risk that managers must take into account. It encompasses various high-level risks that all organisations face, such as uncertainty about potential sales levels in different markets or the cost of producing goods or services for those markets (Crouhy et al., 2005). It is very difficult to accurately project these variables, particularly over longer time spans.
Strategic risk
A closely related type of risk, which many organisations include in the category of business risk, is strategic risk. This is the risk that arises from chosen strategies that are unsuccessful. One example might be BP’s strategy of partnering with the huge Russian state-owned oil company Rosneft to explore for oil together in the Arctic. This proposed strategy is being successfully opposed by one of BP’s major shareholders, as described in Box 4.
Box 4 BP’s Arctic future hangs in the balance
Among the throng of holidaymakers arriving in Cyprus at the end of this week was one of Russia’s most powerful businessmen.
Mikhail Fridman, however, was not there for the sunshine but to attend the board meeting of TNK-BP, a joint venture between BP and a group of Russian billionaires led by Mr Fridman.
Others attending included Tony Hayward, the UK oil major’s former chief executive; Lord Robertson, the former head of NATO; and Gerhard Schröeder, the former German chancellor.
The board meeting, although scheduled months ago, was anything but routine. It came after a momentous week. It was the first time BP met with its Russian partners since the collapse of the company’s proposed $16 billion share swap with Rosneft, the Russian state oil champion, on Monday night.
The swap, and an alliance to explore together in the Arctic, had been vigorously opposed by Alfa-Access-Renova (AAR), the vehicle through which Mr Fridman and his partners – Leonid Blavatnik and Viktor Vekselberg – hold their stake in TNK-BP.
Within days of the alliance being announced in January AAR claimed BP had broken the TNK-BP shareholder agreement. An international arbitration tribunal blocked the share swap following the protests.
Finally, after months of stalemate and with the original share swap agreement about to lapse at midnight on Monday, BP and Rosneft made a joint offer to buy out AAR from TNK-BP.
The three sides came tantalisingly close to a deal on Sunday that would have seen Mr Fridman and his partners receive about $32 billion for their 50 per cent stake in TNK-BP. The offer was a mix of cash and shares in BP.
Talks continued throughout Monday but no agreement could be reached. With Rosneft pushing for the share swap to be completed before a buy-out of AAR was concluded, the talks finally broke down.
On Tuesday, despite months of acrimonious wrangling, BP and AAR presented a united front, issuing a joint statement saying they would ‘intensify their efforts to ensure TNK-BP’s continued success following the lapse of the BP-Rosneft share swap transaction’.
Despite the warm words the collapse of the Rosneft alliance is a blow for Bob Dudley, BP’s new chief executive, who had presented it as a way for the company to rebuild itself after last year’s Gulf of Mexico spill and find a new area of growth in the Arctic.
Shareholders have not been impressed and expressed frustration with the way the deal had been handled. Mr Dudley, say some institutional investors, now needs to present a clear strategy for growth.
Whether it is all over remains to be seen – doing business in Russia is anything but a linear exercise. BP said earlier this week it continues to talk with Rosneft and AAR. Rosneft has seemingly blown hot and cold, signalling it is ready to talk to BP’s rivals such as ExxonMobil and Royal Dutch Shell about teaming up in the Arctic but also announcing on Wednesday that talks with BP and AAR had yielded fresh proposals from BP on cooperation.
BP declined to comment on how the talks in Cyprus had progressed. Long-term industry observers believe a deal could still happen, noting that BP is keen to team up with Rosneft, while the Russian oil champion needs BP’s technical expertise to explore in the Arctic and is keen on the share swap – something that no other oil major is likely to agree to. What all of that means is that the cards are very much in Mr Fridman’s hands.
Reputation risk
The final category of non-financial risk faced by all organisations is reputational risk. Reputation has been defined as how stakeholders view the organisation (Schultz et al., 2000). A positive reputation can increase the loyalty of customers, employees and suppliers and can therefore provide significant financial or operational advantages. In contrast, though, a negative reputation can have a severely detrimental impact. To provide an example of this risk, Box 5 describes a situation which could impact negatively on Unilever’s reputation.
Box 5 Unilever and Nestlé accused over sustainable palm oil scheme
Plantation owners and pressure groups are calling on food producers such as Unilever and Nestlé to stop exploiting an environmental offset scheme to buy palm oil from unsustainable sources.
The $50 billion palm oil market keeps the world in soap, margarine, cakes and chocolate. Growing demand and spiralling prices, which have swung between $800 and $1,200 a tonne in the past 12 months, mean plantation owners are clearing forests to plant more palm trees.
To reverse this trend, the industry-backed Roundtable on Sustainable Palm Oil promotes practices for the increase of yields from existing palms, including use of fertilisers.
Plantations signing up to the standards are certified by the RSPO, and big European food producers have committed to using only certified sustainable palm oil by about 2015.
But most food producers buy GreenPalm certificates to fulfil their sustainability obligations while continuing to buy palm oil from less rigorously run plantations.
The certificate trading scheme, backed by the RSPO, offsets consumption against the production of an equivalent amount of sustainable oil.
Under the scheme, a buyer pays the current market $1,100 a tonne for ‘any old palm oil’ and about $3 a tonne to the sustainable seller of certificates, according to Alan Chaytor, executive director of New Britain Palm Oil, a sustainable producer.
‘Buyers have little idea where their oil comes from and the vast majority is from uncertified sources.’
Unilever, the biggest palm oil buyer, last year bought virtually all its sustainable oil via GreenPalm certificates.
The Anglo-Dutch maker of Flora margarine and Dove shampoo says the complex supply chain and the fact that it requires a variety of processed oils make it harder to buy sustainable oil physically.
Kellogg and Avon both recently agreed to buy GreenPalm certificates to cover 100 per cent of their palm oil usage.
But Nestlé, which meets half its sustainable palm oil commitment this way, is seeking to deal with vertically integrated companies that deliver segregated, sustainable oil.
United Biscuits says 70 per cent of its supply is segregated, traceable and certified.
This categorisation of three financial and five non-financial risks is commonly used but each organisation should develop its own typology to suit its industry and market position.
Stage 2: Measure and estimate risk exposures
Having identified the categorisations appropriate to the organisation, using this typology or another one that better suits the major risks the organisation faces, the next task is to measure the assorted risks.
There are two main ways of thinking about the possible results of risk exposure. Either you can focus on the ‘expected return’ or on ‘possible outcome versus return’. The expected return method is usually easier to use in a quantitative or comparative way. For example, assume you are faced with choosing between action A and action B, each with the same level of risk. If it is possible to calculate the expected return of the alternatives then it is usually sensible to opt for whichever offers the better expected return.
How do you calculate expected return? This is the sum of the values of the return of each possible outcome multiplied by its probability of occurrence. The formula for this is represented as
where
E(R) = expected return
Ri = value of outcome i
Pi = probability of outcome i
This is the same definition as that for the mean return in statistics since ‘expected return’ and ‘mean return’ are the same thing.
The expected return method is very much applicable and useful in finance – for instance, in your study of portfolio theory.
An important use for expected return is when considering avoidable risk: that is, risk to which the organisation can choose whether or not to be exposed. The simplest form of the rule is: ‘only take on avoidable risk if the expected return is positive’. Similarly, if you have to decide between choices, the rule should be: ‘choose the option with the highest expected return’.
You should immediately realise that either form of this rule is not yet complete as it does not address the balance between level of risk and level of return. Strictly speaking, satisfying the rule as so far stated is a necessary, but not a sufficient, condition for accepting avoidable risk. Please accept this for the moment as it avoids judgements about ‘acceptable’ return for taking on risk: the simplification will allow us to investigate, in Box 6, another aspect of deciding on exposure to risk.
Box 6 When simplicity is not enough
You have the chance to play one of two coin-tossing games. Whichever you choose to play, you will only have the chance to toss once. Oh yes, notwithstanding the reputation of your opponent, the coin is fair! The probability of heads therefore equals the probability of tails, 0.5.
Game A If the coin lands on heads you will receive €12; if it comes up tails, you pay €10.
Game B If the coin lands on heads you will receive €12,500; if it comes up tails, you pay €10,000.
What should you do? First, calculate the expected return of each game.
Game A
E(R) = (+ €12 × 0.5) + (– €10 × 0.5) = + €1
Game B
E(R) = (+ €12,500 × 0.5) + (– €10,000 × 0.5) = + €1,250
So surely you play Game B? It offers €1,249 more expected return. It even offers a better percentage return, since for Game A
E(R)/Stake = €1/€10 = +10%
and for Game B
E(R)/Stake = €1,250/€10,000 = +12.5%
The simple decision rule is quite clear: play Game B.
But what if you lose on your one toss?
Personally, I could not afford the loss of €10,000 and I doubt if many of you could either. The possible negative outcome is not supportable, so I must decline to play Game B even though the expected return is more favourable.
The simple rule therefore needs to be extended to include checking that the downside possibilities are not ‘catastrophic’ if they actually occur.
Now, I can afford to invest €10 in Game A…
This idea of ‘avoiding catastrophic outcomes’ leads to the second factor we need to include when assessing risk: namely, ‘possible outcome versus return’. This does not contradict the ‘risk versus return’ as epitomised by portfolio theory and the capital asset pricing model (CAPM), but adds to it. ‘Risk versus return’ looks at the situation as a whole and judges whether on average the risk is worth accepting. This new criterion says that for some sorts of risk it is necessary to consider whether some possible outcomes are so insupportable as to outweigh almost any level of average return.
The standard deviation is a way of condensing into a single number information about the average amount of scatter around the mean of a distribution. Since this represents uncertainty about the return received in any particular period, it is truly a measure of risk as we have defined it. For some types of risk, however, it is not practical to calculate a proper statistical measure such as the standard deviation. Additionally, historic measures based on past returns may not capture ‘discontinuities’ that generate insupportable outcomes. For example, stock market declines, such as during 2001–03, may be seen as included in, and allowed for, by standard deviation analysis, but crashes that happen in the space of a few days, such as in 1929, 1987 and, arguably, 2008, reflect such radical and unusual changes as to preclude capture of such a measure.
In either situation, including a ‘catastrophe avoidance’ criterion is not a rival to the standard deviation, but an adjustment to it. Figure 5 illustrates the idea, perhaps rather crudely.
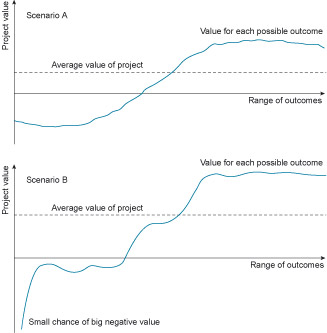
Scenario A shows the value of a project for the whole range of possible outcomes: it is not a true ‘distribution’ in the proper statistical sense, but is meant to represent qualitatively the same sort of idea. The project is more likely than not to end up with a positive value, as implied by E(R) > 0. Furthermore, all the possibilities give relatively modest values, some positive, some negative, none extreme.
Scenario B, on the other hand, is expected to give a higher value than Scenario A, but there is a small chance of it ending up horribly negative – a catastrophic outcome. While the expected return is better, we should also include in our consideration such an unpleasant possibility.
It is worth noting that the expected return system can encompass the possible outcome versus return method. If you look at each of the terms in the E(R) summation, as well as the final result, then you can analyse the individual outcomes as required for this second method of assessing risk. Here you consider each potential outcome and what would be the profit or loss should it actually occur. If one or more outcomes have an unacceptably large negative return, that is, a catastrophic result, then this information should be taken into account.
A benefit of this ‘summing over outcomes method’ is that it forces us to think through the consequences of each possibility. Sometimes this is more important than calculating expected value. Also, it is much easier to apply this system where the assessment must be essentially qualitative, either in respect of the values or of the probabilities. However, this method has one significant disadvantage: if it does not result in comparable measures, it makes assessing between options much more difficult, or, at the very least, less precise.
Activity 3 Stop and reflect
The net present value (NPV) rule of ‘accept capital investment projects with a positive NPV’ seems to be an example of the naïve version of our risk rule: that is, it does not consider the level of return. Is this true?
Discussion
No – providing the cost of capital has been correctly risk weighted. Assuming that this has been done, then a zero net present value means that the project is exactly ‘fair’. In the terms of this discussion, the expected return is just enough to justify the risk. If, however, the calculation has been done with an organisation’s ‘standard’ or non-risk-weighted discount rate, the NPV rule has potentially been impoverished as a decision tool, especially if the proposed project is much riskier or much safer than the average for the business.
Risk mapping
Risk mapping needs to show key areas of risk for the organisation in terms of danger and size of exposure. The aim is to provide the organisation’s policymakers with data to enable informed strategic decision making about the allocation of the organisation’s risk capacity. Where possible, the mapping might include benchmarks for some types of risk. This is likely to be feasible for market-oriented risks (for example, foreign currency, interest rate, commodity price and so on) as there is more chance of there being a published benchmark.
Box 7 shows the operational-research technique of decision-tree analysis, which can be useful for showing the links between choices and the risk implications of making those choices. Even if you do not go through the whole process of estimation and ‘roll back’, just drawing the tree will often clarify cause and effect.
Box 7 The concept of a decision tree
The principle in this operational-research technique is to draw a graph of decision points and outcomes for a project or process, which forms the ‘tree’ and its branches. In the full method, a monetary value and probability are assigned to each outcome and then the tree is ‘rolled back’ to work out the pathway through the project that offers the highest ‘expected monetary value’ (EMV). An example is shown in Figure 6 for a television company deciding whether to produce a new series.
Often, just going through the process of drawing the tree is useful in itself. In particular, it helps clarify where our choices branch away from each other: in other words, if we choose to do X we have ‘burned our boats’ (meaning that there is no chance to go back and change or reverse an earlier decision – the phrase relates to the action taken by Julius Caesar’s Roman army which, in 49 BC, burned its boats having crossed the River Rubicon in pursuit of the enemy) with respect to choices W, Y and Z. Clearly, the points at which we cut ourselves off from possible courses of action are significant when thinking about the risks of a project. At times, this graphical approach can be a direct help in itself by showing us where, for example, re-ordering of the project could serve to delay irreversible decisions – often an immediate aid to risk reduction. Adding in the values and probabilities is, in effect, providing the input for the calculation of an expected return, but in a way which also takes into account the chronological sequence of events. Sometimes this adds little to our decision making, but often with more complicated projects (or strategic plans, if considering a whole organisation) it does improve the manager’s knowledge to a worthwhile degree – and that ought, on average, to lead to better choices being made.

So what should be the output from this second stage of the risk management process? Against each category chosen in Stage 1 there should be an analysis, probably containing both numeric and qualitative information, assessed in whatever way is appropriate for the particular type of risk. During this stage instruments that can be used to shift or trade risks are also identified. The next step is to assess the effects of exposures.
Stage 3: Assess effects of exposures
In this stage, a further analysis of the effects of the various risks identified takes place and certain questions are answered:
- Why be exposed? Is the exposure unavoidable? The analysis may show how certain risks can be avoided, or at least minimised, if different choices are made.
- Size of exposure. This certainly needs to be assessed on a relative basis (that is, what proportion of the total risk does this element represent?), but if an absolute value can be placed on it, so much the better. It is often as useful to senior management to use a rating scale (for example, highest = 1, next highest = 2, etc.), as opposed to specific numbers, for measuring relative risk exposures provided the scale is understandable and can be sufficiently discriminating.
- Warnings. The analysis should flag any potential catastrophic outcomes arising from a particular risk element. Where feasible, it is helpful if the analysis shows what is currently done to avoid or reduce a risk. Alternatively, suggestions for future action can be included.
- Cost of risk. If the risk is avoidable, or can be reduced, what would be the cost of avoidance or reduction? What is the potential benefit?
- Correlation of risk. Many types of risk are interrelated. For key risk elements that are correlated, it is useful to make plain the linkage where this is material. This correlation of risk is clearly akin to portfolio theory. However, because here we are considering a much broader range of risks it is not possible to be as mathematically precise as in portfolio theory – but the idea is the same.
The overall goal for the mapping should be kept in mind: that is, to provide risk information to the organisation’s policymakers. As always, the objective is to end up with a succinct report to give the senior management the input needed for them to produce an appropriate definition of corporate strategy.
It is a good idea, where possible, to rank the risk factors within the groups, but how possible this is depends on the measures used. If the expected value and standard deviation method is predominant, then ordering is feasible. Most financial risks are amenable to this way of measuring risk/return, but whether the same is true of operational, business and strategic risks is less certain. Ranking may also be possible with a scaled system, but this will often depend on the degree of discrimination the chosen scale allows. In general, the ordering aims to put at the top of each group’s list the factors with the best risk/return profile, and the worst at the bottom.
If two factors, A and B, have the same risk assessment, perhaps measured by standard deviation, but A offers a better expected return, then the ordering is straightforward. It is less easy to be precise if A is also riskier. At this point the organisation’s particular attitude to risk becomes important. A very conservative business will require more return per unit of additional risk than will a more adventurous one, assuming the terms ‘conservative’ and ‘adventurous’ refer to the degree of risk aversion of the respective organisations. The rankings must reflect this attitude to risk.
Another way of partitioning within the groups is to treat linked risks together. For example, if there is a set of risks all associated with operating in a particular country, report them together, on the premise that strategic-level management may only be able to act on them as a group anyway. This form of partitioning can be used as well as, rather than instead of, the ranking procedure. It may add more complication than illumination to senior management’s interpretation, however, and can only be decided upon on a case-by-case basis.
By now you should have a sizeable report on the organisation’s overall risk profile – and hopefully a better understanding of that profile. It is time for decision making to take over from analysis.
Stage 4: Form a risk mitigation strategy
A risk mitigation strategy involves choosing among four major alternatives for dealing with the identified risks:
- avoid
- transfer
- mitigate
- keep.
We will discuss in more detail the ways in which financial risks can be transferred or mitigated. It is important to understand, though, that decisions must also be made as to whether risks should be avoided or kept: a process that is known as ‘allocating risk capacity’.
A first step in allocating risk is to rank the risks previously identified. A useful way to do this is to separate them into the following groups:
- risk unavoidable except by ceasing core activity
- avoidable risk, core activities
- avoidable risk, non-core activities
- selectable risk.
The intention is to help management by giving a sequence for consideration: that is, Group 1 ‘uses up’ some of the risk capacity before you can consider Groups 2 to 4, and so on.
Group 1 relates to risks that have to be run if an organisation wishes to conduct a core activity.
Group 2 relates to risks that can be avoided, if desired, in respect of an organisation’s core business activities.
Group 3 relates to risks that can be avoided, if desired, in respect of an organisation’s non-core business activities.
Group 4 relates to risks that an organisation can run (with a view to making money) if it chooses or can avoid without any impact on its core or non-core business.
Group 4 needs some further clarification. It is the set for types of risk where the degree of risk can be adjusted more or less voluntarily without changing the operations of the business. The classic example would be financial gearing – where the management can, at least in the medium term, choose the debt/equity ratio without altering the company’s activities.
Some risk elements can appear in both Group 4 and elsewhere. For example, it may be necessary to accept some foreign currency risk as a concomitant to doing business (Group 2). But the organisation could also take on foreign currency risk that was essentially speculative – that part would be Group 4. In effect, Group 4 can be regarded as a ‘balancing item’ between the total risk represented by the main business and the capacity for risk decided upon as acceptable by the management.
Stage 5: Evaluate performance
Risk management is but one input to policy making in an organisation. It is usually an important element, but can only be useful when put in context with other strategic requirements. In practice, risk is also a consequence of other policy decisions, and so should be seen in this context rather than in isolation.
It is reasonable to believe that an organisation has an intrinsic capacity for absorbing risk, dependent on such factors as its size, its access to capital, its economic and/or social role, the attitude of the owners and so on.
Unfortunately, it is seldom easy to put a figure on that capacity for any particular organisation, though there is often a consensus about the estimated area for the total. For example, most people would expect to see a biotechnology company accepting more risk than, say, a charity providing housing for disadvantaged people. Deciding which of two UK charities, for example, the British Heart Foundation or Macmillan Cancer Relief, has more risk capacity, however, would be a much more difficult, if not impossible, task.
In the corporate world – especially for exchange-listed companies – although determining what is the risk capacity for a business is still fraught with difficulty, the market will be very clear if it thinks a company has got it wrong. Too much risk and the share price declines or even collapses; too little (that is, excessive unused capacity) and a take-over bid may appear – nowadays, often a highly leveraged bid, using the excess risk capacity on offer.
Let us assume that the board of an organisation has, by some process – which will necessarily include evaluation of other strategic decisions already made – decided on an acceptable level of total risk. How should they go about formulating policy to allocate their risk?
It is important that risk allocation is seen as a constraint on the system, not a driver. By this we mean that it is the other inputs to strategy – corporate goals, market opportunities, core industry and so on – that should be promoting the direction of the organisation. The risk mapping and risk-capacity calculations should be used to assess that the organisation is functioning within its limits. However, the effect of different parts of a business acting like a portfolio may mean that simply adding up the risks of individual aspects of the organisation may overstate the net risk. This can be allowed for in the mapping process (with some difficulty) or it may be accommodated in a less precise way by senior management taking an optimistic view of the total risk capacity of the business – that is, an overestimate of risk capacity compensating for an overestimate of the net risk.
In practice, the information made available by the risk management process can help do more than just ensure that the business does not step over the risk cliff into the chasm of destruction. It can assist in the choice of path so that the direction taken heads most swiftly towards the organisation’s goals, without smashing on the rocks or meandering inefficiently. By clarifying what dangers the business faces, risk management better enables management to avoid them without having to leave an excessive margin for error. The likelihood of optimising the risk-to-return equation is, therefore, maximised.
With these factors in mind, it is vital that organisations regularly and systematically evaluate the overall performance of their risk management system and analyse whether it continues to best support organisational goals and is in line with the organisation’s capacity for absorbing risk. It is important to realise that both these factors will change over time.
Summary
So far, we have been concerned with defining risk and with answering two questions: what types of risk and how much risk is an organisation exposed to?
In this context, risk can be described as an uncertain future outcome that will improve or worsen the organisation’s position. Risk can be expressed in probabilities of an upside or a downside outcome.
Risk management is the process whereby an organisation assesses the types and degrees of risk to which the business is exposed, the effects of those exposures and then formulates a risk mitigation strategy. The process as we have described it can be broken down into five stages:
- Stage 1: Identify risk exposures
- Stage 2: Measure and estimate risk exposures
- Stage 3: Assess effects of exposures
- Stage 4: Form a risk mitigation strategy
- Stage 5: Evaluate performance.
The major risk categories include market, credit, liquidity, operational, legal and regulatory, business, strategic and reputational.
There are two main ways of thinking about the possible results of risk exposure: either by focusing on the expected return method or upon possible outcome versus return. Expected return can be calculated by estimating the total of every outcome multiplied by its probability. This then allows the organisation to accept avoidable risk only if the expected return is positive. It also allows the organisation to choose the option with the highest expected return and to avoid, where possible, catastrophic outcomes.
This expected return analysis leads to the collection of data on:
- why the organisation is exposed and whether the risk is avoidable
- the size of the risk – graded perhaps from 1 to 10 (an exercise that is admittedly difficult if you are solely relying on qualitative assessments)
- the warnings of possible catastrophic outcomes
- the costs of accepting or avoiding risks
- the identification of links to other risks.
The allocation of risk capacity can then be done by ranking risks as follows:
- risk unavoidable except by ceasing non-core activity
- avoidable risk, core activities
- avoidable risk, non-core activities
- selectable risk.
We now turn to examine in some detail one of the risks faced by all organisations – operational risk.
3 Operational risk
3.1 The implications of operational risk
As described above, operational risk – often shortened to ‘op. risk’ by practitioners – is a major type of non-financial risk that almost every organisation should consider and manage. In fact, for many smaller organisations with less formal risk management systems it might be the only non-financial risk taken into account. In these cases it is often defined quite broadly to encompass all the other non-financial risks.
The term ‘operational risk’ extends to the breakdown of controls and procedures within organisations – in effect, the processes intended to avoid the adverse consequences of all those other risks we have looked at in this free course. As we will discuss, carefully considered management controls must be applied by organisations to manage financial and non-financial risks, such as those arising from interest-rate and foreign-exchange changes and credit risk, that comprise the core of the content here. If, however, these controls are not observed – either deliberately through fraudulent activity or simply as a result of incompetence – then an organisation is potentially exposed to financial risks for which it has either no capacity or appetite.
As described in Boxes 8 and 9, the Sainsbury and Lufthansa examples both demonstrate that op. risk can have major adverse financial consequences.
Box 8 Sainsbury’s puts the brakes on IT after £290 million write-off
The United Kingdom supermarket Sainsbury’s revealed in 2004 that it had to take a £290 million loss. This arose when its disastrous IT project for its automated depots and supply chain failed to get goods onto the shelves of its supermarkets.
The extent of the problems, which arose from a £3 billion project, were revealed in Sainsbury’s new business plan put before investors in October 2004.
The write-off of redundant IT assets cost £140 million and the write-off of automated equipment in the new fulfilment depots cost £120 million. Another £30 million in stock losses arose due to the disruption caused by the new depots and IT systems. Remedial and completion capital spend on IT systems and the supply chain was estimated at an additional £200 million.
Sainsbury’s CEO Justin King said the business-transformation project distracted the company from its ‘customer offer’ and so he laid out plans to ‘fix the basics’ as part of a £2.5 billion ‘sales-led’ recovery for the embattled supermarket chain.
Sainsbury’s focus was now to be on getting cost savings by simplifying existing IT systems and, in some areas, this meant reintroducing manual processes where systems were failing.
Arguably, the cost to Sainsbury’s of the IT failures outlined in Box 8 was more than the financial write-offs detailed. The retailer’s competitors, particularly Tesco, were not standing still during this period of Sainsbury’s difficulties. Unsurprisingly, therefore, this period of operational difficulties saw Sainsbury’s lose market share to its rivals – and also saw a radical shake-up in the management of the company.
Box 9 Lufthansa cancels flights after computer failure

Lufthansa had to cancel about sixty European flights and its services around the world were delayed following a computer fault in its check-in system on 24 September 2004.
The company’s Star Alliance partners (Britain’s bmi, Poland’s LOT and Austrian Airlines) were also affected by the problem.
The flight cancellations affected about 6,000 passengers, while short-haul and long-haul departures were delayed by up to two hours. Some freight normally carried by plane had to be moved by truck.
At Berlin’s Tegel airport there were long queues as clerks had to write tickets by hand and tell passengers there was no assigned seating.
A Lufthansa clerk said the problem was not caused by a virus, but by the launch of a new computer program overnight, which brought the system down.
Unisys said it deeply regretted the failure of its check-in system, which went down following a planned outage.
‘After being rebooted, the operating system and hardware ran smoothly for approximately ninety minutes until a software problem brought the check-in system application down,’ Unisys said.
The company had to install new software to fix it.
The financial markets reacted to this operational failure, with shares in Lufthansa falling 1.8% to 9.32 euros.
It is consequently no surprise, particularly in the financial services sector, that greater scrutiny is being given to the operational risk being run by organisations. Indeed, the collapse of Barings in 1995, and the high-profile losses arising at the Allied Irish Bank’s US subsidiary Allfirst in 2001, were both classic examples of the financial mayhem that can arise through the existence of inadequate operational controls or a breach of the pre-set control procedures. Let us look more closely at the Barings episode in Box 10.
Box 10 Barings – a very simple (but costly) operational failure
As related earlier in this free course, the United Kingdom merchant bank Barings collapsed in February 1995 as a result of losses amounting to nearly £800m arising from derivatives trading by its Singapore subsidiary.

Derivatives are financial instruments whose prices are dependent upon or derived from one or more underlying assets. Derivative transactions are contracts between two – and sometimes more – counterparts. The value of derivative contracts is determined by movements in the prices of underlying assets.
Much of the media coverage focused on the complex nature of derivatives trading – although in the case of Barings the transactions on which money was lost were mostly simple bets on equity prices that went wrong.
It was not, then, the arcane nature of derivatives that caused the collapse of Barings – rather the lack of some basic operational controls. With limited staffing in its Singapore subsidiary, Barings failed to ensure the effective segregation between its trading activities and the recording and accounting of those trades. One trader, Nick Leeson, executed the transactions, took it upon himself to record the financial outcomes of certain of these trades (in a secret account coded 88888) and also managed the movements of funds to support them. This enabled him to start concealing loss-making transactions and their financial consequences for the bank for several months.
Eventually the adverse cash-flow consequences of the bets that had gone wrong had to surface as counterparties to the transactions sought their ‘winnings’. Barings collapsed at a spectacular speed and Nick Leeson, after fleeing, was apprehended at Frankfurt airport and returned to Singapore to serve time in prison for his fraudulent activities.
The collapse could so easily have been averted by applying a simple operational control. If Nick Leeson had not been able to record his own transactions and move funds to support his trading positions – that is, if the trading activities had been properly segregated from the settlements and accounting function in Singapore – then the loss-making trades would have been identified and reported by other staff at an early stage. This would have prevented the losses from escalating. Barings might have taken a financial loss as it unwound these trading positions, but it would have survived.
Ironically, the number eight is, according to the Chinese, supposed to bring luck. Clearly it failed to do so for Nick Leeson and Barings Bank!
3.2 Operational risk management
Operational risks are very wide ranging since they effectively can arise from any potential weaknesses in an organisation arising from its processes and staff.
Managing these risks is therefore a process that envelops all parts of an organisation. The list of practices that can be adopted to contain operational risk is therefore huge and, to a large degree, will be specific to the nature of the organisation. Certain generic rules, though, do apply. Let us look at these.
People
All organisations are vulnerable when staff levels are inadequate in either number or quality. The success of organisations or, indeed, the recovery of failing organisations can usually be ascribed not only to the quality of senior management, but the effectiveness of procedures put in place for recruiting, training and retaining good staff.
In assessing how well organisations avoid the risk of having inadequate staff resources in place, the following should therefore be tested:
- What is the staff turnover rate (rate of leavers per staff complement per annum) and how does it compare with the organisation’s peer group?
- What is the rate of absenteeism and how does it compare with the peer group?
- What procedures does the organisation have for the induction of new staff and for training staff?
- What percentage of staff positions is vacant and how does this compare with the peer group?
- Is there a succession plan in place for all key and senior staff? What procedures exist to replace key staff on their departure?
Organisations with high staff turnover, high absenteeism, weak training and development processes, high levels of staff vacancies and vulnerability to the departure of key staff are under prepared to take on competitors with better records in these areas. Even if organisations are not operating in a competitive environment (for example, in government organisations), weaknesses in these areas will undermine the delivery of the services for which they are responsible.
Systems
Failure of systems will interrupt business activity and, as with the example of Sainsbury’s, can result in large costs being incurred. In assessing the exposure to operational risk arising from inadequate systems, what should you therefore be looking for if you are doing a risk audit?
You should include the following key tests:
- How often are systems out of operation (or ‘down’)?
- What proportion of an organisation’s activities is supported by existing systems? Is there a high proportion of manual ‘work arounds’ – for example, analysis and record keeping using ‘homemade’ spreadsheets?
- What back-ups exist for existing systems?
- Are there contingency sites available from which back-up systems can be employed if the location of the main site is impaired, say by fire or flood or another disaster? Are these contingency sites in the right location? (See Box 11.)
- Are all new systems thoroughly tested and run on a parallel basis with existing systems during their launch period?
Again, any weaknesses here spell potential financial trouble for an organisation. Malfunctioning systems mean that organisations may be unable to conduct business. It is hard to identify a greater financial risk than that.
Box 11 The wrong place for your contingency site
The atrocity of the terrorist attack on the World Trade Centre on 11 September 2001 highlighted an operational risk run by many businesses in Lower Manhattan.
To accommodate systems failures and the risk that access to the main site of their business may be prevented, many organisations had established contingency sites in alternative Manhattan locations. These could then be put into operation, employing back-up systems, to ensure the continued operation of business activities.
In many cases these sites were shared by businesses on the basis that it was statistically unlikely that more than one business would need access to the contingency site at any one time – and sharing the sites reduces the cost of retaining and maintaining them in readiness for possible use.
The extent of the devastation resulting from 11 September meant that not only was there multiple demand for contingency sites, but also many of these sites were located in areas of Lower Manhattan that were, temporarily at least, closed off to the public after the attack.
Consequently, many businesses learned a lesson in operational risk: yes, you do want a contingency site and, yes, it should be close to the main business location so that staff can relocate to it quickly, but you should not have it so close that access is prevented by the same event that is barring access to your main site.
Controls
Finally, operational-risk management should include the maintenance of an effective set of internal controls with these being documented in an organisation’s procedures manual. This manual, or at least the parts of it relevant to the business area in which staff are employed, should ideally be required to be read by staff at least once a year to ensure they know the control environment applying to their responsibilities.
Compiling and reading a procedures manual may not be the most exciting thing anyone does, but it is an aid to reducing the incidence of operational failures and the financial risks they bring.
Control or procedures manuals should at least include details on the following:
- The delegation of powers to undertake transactions. These should detail the limits on the scope of an individual within an organisation to take business decisions.
- The reporting lines of employees to their superiors.
- The segregation of responsibilities between different parts of the business (for example, between the dealing room of a business and its settlements and accounting functions).
- The reporting of business activities – in terms of the timing and regularity of reports and their recipients. This should include ‘exception reporting’ – that is, the reporting of activities that occur only if a pre-defined limit has been exceeded or an event has taken place.
Applying these controls is the responsibility of managers. Testing the controls (regularly) is the responsibility of the organisation’s auditors.
Activity 5 Stop and reflect
One control that appears in many organisations’ procedures manuals is that employees are required to have at least one period of time off from work each year lasting a minimum of two weeks (or ten working days).
Why do you think this control is applied?
Discussion
The evidence is that if fraudulent activity is being committed by an individual there is a higher likelihood of it being discovered during the second week of their holiday than during the first week. Why is this? Well, in the first week the people covering for (fraudulent) colleagues on leave tend to spend time getting used to their additional and temporary responsibilities. By the second week they are familiar with the new routine and can more readily detect anything their colleagues were doing that, shall we say, looks abnormal! Particularly with positions that involve direct involvement with transactions and cash flows, the trend, therefore, is to require a two-week break (ten working days) each year.
3.3 IFRS and operational risk
Whilst International Financial Reporting Standards (IFRS) apply significant disclosure requirements for financial risks, they are less prescriptive when it comes to operational risk. In explaining its decision to limit required disclosure on operational risk, the International Accounting Standards Board (IASB) states that ‘the definition and measurement of operational risk are in their infancy’ and decided to ‘defer this issue to its research project on management commentary’ (IASB 2010, p. B534). While operational risk may be in its infancy in general, for certain industries such as banking, it is much more advanced and disclosure is typically required by regulators in the notes to the financial reports.
Summary
Operational (or op.) risk is not a core financial risk as such. Its linkages, however, to the ability of organisations to manage those core risks that we examine later make it imperative that we understand the subject. Indeed, many financial risk failings experienced by organisations – and particularly the most calamitous ones – have their source in organisational risk failures.
Audiovisual resource
Activity 6 BP oil spill
Watch the videos BP Oil Spill – Tony Hayward’s Testimony Part 1 (2010–7), about the catastrophic BP oil spillage in the Gulf of Mexico in 2010. BP’s reputation and that of its executives were enormously damaged by this operational failure, particularly in the US.

Transcript: BP Oil Spill – Part 1

Transcript: BP Oil Spill – Part 2
BP Oil Spill – Part 2

Transcript: BP Oil Spill – Part 3
BP Oil Spill – Part 3
What do you think were the immediate and long-term financial consequences to BP of this episode? You may want to note down and save your thoughts in the note box provided below.
Answer
The direct costs to BP of the oil spill in 2010 relate to the repair work and the cleaning up of the Gulf of Mexico. Additionally, BP faced fines for the spillage and claims for compensation from organisations – particularly marine organisations – whose business was adversely affected by the disaster. How far BP will be able to offset these direct costs, estimated as being of the order of $40 billion to $60 billion, by sharing the financial burden with its contractors or insurers is currently unclear.
Read more in this news story.
One immediate impact was a fall in BP’s share price from 650 pence in March 2010 to 300 pence in June 2010 – although subsequently the share price has recovered and stands (in January 2012) at 476 pence. Clearly this means that raising finance through equity issues would be more costly to BP now than in early 2010, before the spillage. Additionally, the cut in BP’s credit rating by the credit rating agency Standard & Poor’s would have slightly increased the cost of borrowing money from the financial markets.
Over the longer term it will be interesting to see the impact of the reputational damage to BP on its business – particularly in the US and especially in its retailing operations (i.e. petrol stations). As consumers become increasingly environmentally conscious, BP may suffer over the medium-term in the same way that the oil company Exxon did after its oil spill in Alaska in 1989.
Conclusion
In this free course we have:
- Explored the range of risks that organisations may be exposed to. We have not only introduced ourselves to the main financial risks but also to the other risks which may indirectly impact on the finances of organisations – such as operational, reputational and legal and regulatory risk.
- Examined how the process of risk management should be implemented within organisations – thereby providing the structure for examining each type of financial risk in detail.
The free course provides an overview of the risk management process which should be embedded in the operations and governance of every organisation. There is, however, no ‘one size fits all’ way of implementing risk management. Instead the process must be tailored to fit the size, complexity, industry competition and environmental uncertainty facing the organisation. For a small organisation the process may be very informal, while for a company like BP or Unilever it must be much more formalised, documented and provided with dedicated resources in the form of staff and budget.
It is important that the individual risks are not looked at entirely in isolation from each other. Doing so is what is known as a silo approach to risk management. Instead, managers must develop a holistic view of risk. Organisations may have small exposures to the individual risks, but when these are aggregated they may have, in total, substantial financial and non-financial risks that require careful management.
What we do certainly know – given the recent catalogue of high-profile financial calamities – is that the failure to manage risks can have devastating and, on occasion, terminal outcomes for organisations.
Glossary
- beta
- The beta of a share is a measure of its risk relative to the market as a whole (or its covariance with the market). The beta risk of a share is just one element of a share’s total risk or standard deviation. The other element is the risk specific to the share which can be diversified away. The capital asset pricing model shows how investors should only be rewarded for the beta risk of their investments. Beta is often abbreviated to b.
- capital asset pricing model (CAPM)
- A model which relates the expected return on a security to the expected return on the market as a whole and to its risk. The capital asset pricing model allows a company’s equity cost of capital to be estimated and provides performance benchmarks for equity investors.
- debt/equity ratio
- In financial risk analysis, this is a way to determine a company’s leverage. To calculate debt/equity ratio, a company’s long-term debt is divided by the value of its common stock.
- derivatives
- A future, forward or option contract. These are short term securities which establish their value (or potential exposure to risk) making reference to prices set up in another market (i.e. the market for the underlying asset).
- financial risk management
- Managing a risk arising from a financial based activity (e.g. foreign exchange transactions).
- gearing
- A measure of the amount of debt in the capital structure, typically the debt/ equity ratio which is debt as a percentage of debt plus equity capital. Gearing is a UK term, the US equivalent is leverage.
- Gross Domestic Product (GDP)
- The value of the economic output of an economy.
- International Accounting Standards Board (IASB)
- The accounting board that sets international financial reporting standards (see International Financial Reporting Standards).
- International Financial Reporting Standards (IFRS)
- The reporting standards for accounting standards set by the International Accounting Standards Board (IASB) (see International Accounting Standards Board).
- leverage
- A measure of the amount of debt in the capital structure, typically the debt/ equity ratio which is debt as a percentage of debt plus equity capital. Leverage is a US term; the UK equivalent is gearing.
- mean of a distribution
- The statistical average of a series of numbers or observations.
- net present value (NPV)
- The discounted present value of future cash flows (of, say, a project or investment) net of the cost.
- portfolio theory
- A model of the risk and return of a portfolio of shares.
- standard deviation
- A measure of volatility which is the square root of the sum of the squares of the differences between actual outcomes and the mean outcome.
- wholesale funds
- Funds raised from institutions via the financial markets.
References
Acknowledgements
This free course was written by Martin Upton
Except for third party materials and otherwise stated (see terms and conditions), this content is made available under a Creative Commons Attribution-NonCommercial-ShareAlike 4.0 Licence.
The material acknowledged below is Proprietary and used under licence (not subject to Creative Commons Licence). Grateful acknowledgement is made to the following sources for permission to reproduce material in this free course:
Cover image CGP Grey in Flickr made available under Creative Commons Attribution 2.0 Licence.
Every effort has been made to contact copyright owners. If any have been inadvertently overlooked, the publishers will be pleased to make the necessary arrangements at the first opportunity.
Text
Activity 6 (answer): BP's Gulf oil spill bill 'could hit $60bn', The Daily Telegraph, by Rowena Mason, Wednesday, April 20, 2011 © of Telegraph Media Limited.
Figures
Figure 4: © Michael St Maur Shell/Corbis
Figure 7: © http://www.joiseyshowaa.com/
Figure 8: © PATRICK LIM/AP/Press Association Images
Audio-Visual
Oil Spill video: © C-SPAN®
Don't miss out
If reading this text has inspired you to learn more, you may be interested in joining the millions of people who discover our free learning resources and qualifications by visiting The Open University – www.open.edu/ openlearn/ free-courses.