Meiosis and mitosis
Use 'Print preview' to check the number of pages and printer settings.
Print functionality varies between browsers.
Printable page generated Saturday, 20 April 2024, 3:38 AM
Meiosis and mitosis
Introduction
This course looks at how units if inheritance are transmitted from one generation to the next. First you will look at what happens to the chromosomes of animals and plants during the process of sexual reproduction. Then you will examine how genes are transmitted in particular patterns from generation to generation. These two approaches combine to illustrate how the patterns of inheritance can be explained by the behaviour of chromosomes during sexual reproduction.
This OpenLearn course provides a sample of level 1 study in Science
Learning outcomes
After studying this course, you should be able to:
understand that the number of chromosomes is characteristic of each species and can vary enormously between species
recognise that genetics is based on the concept of the gene as the unit of inheritance
understand that sexual reproduction always includes two distinctive processes: the production of gametes, which involves meiosis, and fertilisation.
understand that a particular phenotypic character is determined by the two copies of a gene that an organism possesses and these two copies are identical in a pure-breeding variety
understand that when organisms with contrasting characters for which they are pure-breeding are crossed, the dominant character appears in the first offspring or first filial generation and the recessive character is masked.
Introduction
Living organisms use the components of the world around themselves and convert these into their own living material. An acorn grows into an oak tree using only water, oxygen, carbon dioxide, some inorganic materials from the soil, and light energy. Similarly a human baby grows into an adult by digesting and metabolising food and drink. The parents in each case pass to their progeny, or offspring, the information and specification for building cells from materials around them. This information lies in the genetic material, or DNA, which is found in the chromosomes within the nucleus and which is transmitted from generation to generation. Chromosomes can be regarded as strings of genes, the units of inheritance. It is to the study of chromosomes and genes that we now turn.
The idea of passing on information from parents to offspring raises an important question: how are the units of inheritance transmitted from one generation to the next? This course takes two approaches to answering this question. First, we look at what happens to the chromosomes of animals and plants during the process of sexual reproduction. Second, we examine how genes are transmitted in particular patterns from generation to generation. Then these two approaches are combined to show how the patterns of inheritance can be explained by the behaviour of chromosomes during sexual reproduction. Since genes are an integral part of chromosomes, following the behaviour of chromosomes allows us to trace the movement of genes. Thus the focus of this section will be at both the gene and chromosomal levels of explanation.
The majority of the study time will be dedicated to learning about genes and chromosomes and their patterns of inheritance. You will practise some basic maths skills, particularly the use of ratios and the mathematical idea of probability.
1 Meiosis and the life cycle
You will begin this course by learning about the type of nuclear division called meiosis. This process is intimately linked to the life cycle of organisms that reproduce sexually.
1.1 Chromosomes and the life cycle
Chromosomes are present in the cells of all eukaryotes. Their number varies enormously and is characteristic for each species. The parasitic worm Ascaris lumbricoides has only four chromosomes whereas some ferns, such as the adder's tongue fern (Ophioglossum vulgatum), have more than 1 000 chromosomes. Most eukaryotes have between 10 and 50 chromosomes; for example humans have 46. However, there is no obvious relationship between chromosome number and an organism's complexity of organisation.
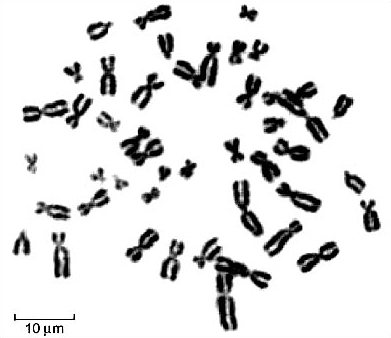
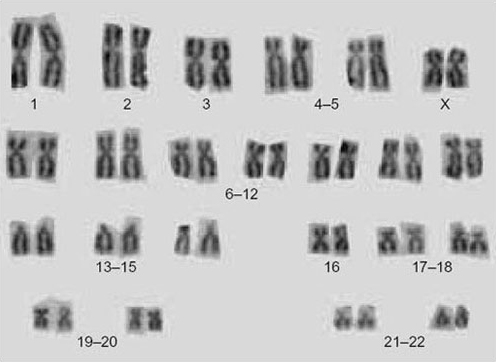
When the chromosomes are aligned along the centre of the cell during metaphase of mitosis (Figure 1), they are in their most condensed state so their number, size and shape can be most easily studied. Figure 1 shows the metaphase chromosomes of a human female. These have been stained and spread out so that they are readily distinguishable. The array of chromosomes that a particular species possesses is called the karyotype. For any one species, the male and female karyotypes may differ slightly because of the sex chromosomes. By cutting out the chromosomes from photographs taken down the microscope and lining them up according to their size and shape, the distinctive features of the karyotype can be revealed (Figure 2).
Question 1
What is the most striking feature of the karyotype shown in Figure 2?
Answer
All the chromosomes are present in pairs; each member of a pair has the same structure and appearance.
Each member of a pair of chromosomes is said to be homologous to its partner, that is, to have the same size, shape and function. Another feature of the karyotype in Figure 2 is the different appearances of the chromosomes; non-homologous chromosomes can be distinguished from each other by their length and the position of the centromere, and although many look very similar, to the trained eye and using more sophisticated staining techniques, each pair is different.
Question 2
How can you tell that the karyotype in Figure 2 is of a diploid cell?
Answer
The chromosomes are present in pairs — homologous pairs — hence they must be from a diploid cell.
1.2 Sexual reproduction
Sexual reproduction includes two distinctive processes:
-
The production of haploid gametes, such as sperm and ova, which involves the specialized nuclear division called meiosis.
-
The fusion of gametes at fertilisation, which results in the restoration of the diploid number of chromosomes.
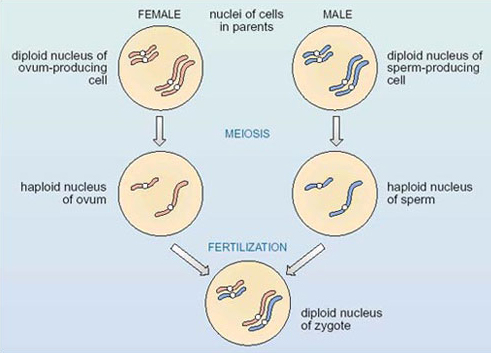
The relationship between these two processes, and the changes in chromosome number that each process brings about, is shown in outline in Figure 3. This figure represents a hypothetical organism with only four chromosomes, that is, two pairs of homologous chromosomes — one long pair and one short pair — as shown for each of the parents in the first row in the figure. The chromosomes of the female parent (maternal chromosomes) are shown in red and those of the male parent (paternal chromosomes) are shown in blue. As a result of meiosis, the chromosome number is halved in the gametes, each of which contains two chromosomes, as shown in the second row in Figure 3. Notice that the set of chromosomes in the gametes is not a random collection; it is made up of one member of each homologous pair — one long chromosome and one short. The bottom part of the figure shows that fertilisation restores the original number of four chromosomes in the zygote, which contains a pair of the long homologous chromosomes and a pair of the short homologous chromosomes. Note that in the zygote, half the chromosomes are shown in red and half in blue, since one member of each homologous pair comes from the female parent and its partner comes from the male parent.
Question 3
What would happen to the chromosome number in future generations if gamete production did not involve the halving of the diploid chromosome number?
Answer
If the chromosome number were not reduced by half during gamete formation, to produce the gametes containing the haploid number, a zygote would have twice the diploid number; the chromosome number would double in each subsequent generation.
The distribution of one member of each homologous pair of chromosomes to each gamete is a consequence of the precision of the process of meiosis. An understanding of the distribution of chromosomes, both during the production of gametes and at fertilisation, is important for exploring the inheritance of genes.
Activity 1
Insert the missing term in each of the following sentences.
-
____________chromosomes are pairs of chromosomes which are present in diploid cells and have the same appearance and function.
-
The number, size and shape of all the chromosomes in a cell is called the ____________and is characteristic for a species.
-
The process of____________is involved in the production of gametes, which have the haploid number of chromosomes.
-
The process of combining two gametes to produce a zygote is called____________.
Answer
The missing terms are: (1) homologous; (2) karyotype; (3) meiosis; (4) fertilization.
2 Like begets like
It is possible to follow a character, such as eye colour or hair colour in humans, that is handed down from generation to generation. Such characters are said to be inherited characters (or heritable characters) and are determined by genes. A gene can be considered as a unit of inheritance, which determines a particular character and which is passed on from parent to offspring.
Genes maintain the differences between species, such as oak and human, but they also contribute to differences between individuals within a species. For example, consider hair colour or eye colour within a family. Brothers and sisters may share features such as brown hair, that they also share with their biological parents, but in addition they have their own particular combination of characters that make them recognisable as individuals. For example, one sister may have blue eyes whilst her siblings have brown eyes; a brother may have curly hair whilst his siblings have straight hair, and so on. To understand the differences and similarities in characters between individuals, we need to look at how copies of genes are transmitted from parent to offspring. In so doing, we shall discover the rules that govern inheritance.
While at one level there is continuity from one generation to the next, at another level a degree of variation occurs. In fact there is so much variation that every human alive today is different from all others - we are all genetically unique (with the exception of identical twins, who have identical genes). Some of this variation can be seen with the unaided eye, whereas other variation, such as blood groups or the activity of a particular enzyme, is revealed only by more sophisticated molecular biological techniques. The sum of all the characters that an individual organism possesses, not only structural features but also biochemical, behavioural and physiological features, is described as the phenotype. All aspects of an organism's phenotype depend ultimately on that organism's chemical composition and on the biochemical reactions that go on inside it.
The full complement of an individual's genes is called the genotype. The phenotype of each individual is the result of the combined action of their genes (their genotype) and their environment, some characters being influenced more by the environment than are others.
Activity 2
From your own experience, can you suggest a human character that might be influenced by environmental factors?
Answer
One example is body mass, which is greatly influenced by the amount and type of food that people eat and the amount of exercise they take.
Phenotype, as well as meaning the sum total of all an individual's characters, also has a more restricted meaning; it is used as a shorthand way of referring to the expression of just one character, for example, 'blue-eyed phenotype'. Similarly, genotype is also used to refer to the specific genes associated with a particular character, for example, 'blue-eyed genotype'.
Activity 3
Which of the following is the same for every individual of a species: (a) karyotype; (b) genotype; (c) phenotype? Explain your answer.
Answer
(a) The karyotype is the number, size and shape of all the chromosomes and is characteristic of a species. Members of a species have the same karyotype, although there may be slight differences between males and females because of the sex chromosomes.
(b) The term genotype can mean either the full complement of genes or the copies of a gene for a particular character, present in an individual. The former will vary between individuals of the same species (unless they are identical twins or clones), while the latter may or may not vary.
(c) Likewise, for the phenotype — meaning either the sum total of all characters, or a particular character, of an individual. The former will vary between individuals of the same species, while the latter may or may not vary.
3 Patterns of inheritance
We can trace the inheritance of characters in animals and plants by following the phenotype from generation to generation, in breeding experiments. We will describe work with maize (Zea mays), alternatively called corn (sweetcorn, or corn on the cob), which occurs throughout the world as an extremely important commercial crop plant, and which is used extensively in genetic research. We can also study the inheritance of characters at the level of the genotype. In this section we will jump between these two levels, and in so doing we shall be jumping from the fundamental work of 19th century biologists, who could only trace phenotypes, to that of present-day geneticists, who work at the level of the gene.
3.1 Inheritance of colour in maize
We begin with one of the simplest known examples of inheritance, that of grain colour in maize. We will consider two of the possible colours: purple and white. A cob in which all the grains are purple has the 'purple phenotype'; a cob with white grains has the 'white phenotype'. The two cobs are said to have contrasting characters.
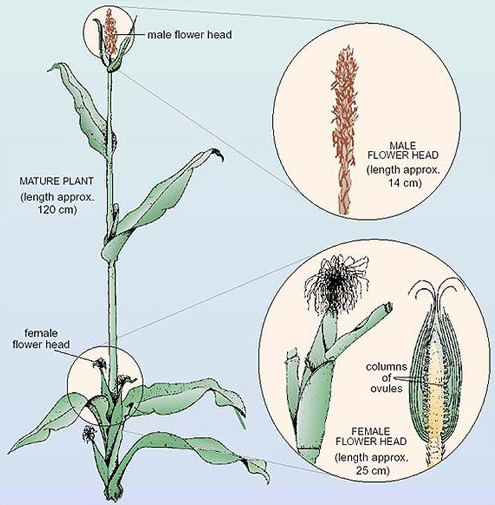
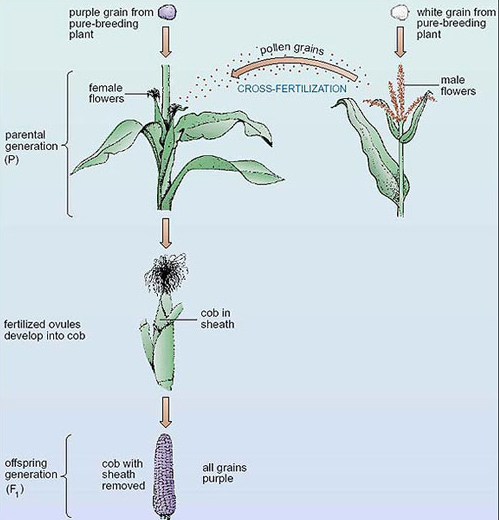
Maize cobs consist of hundreds of grains (seeds) arranged in columns. Each of the grains on the cob is the result of a separate fertilisation of a female gamete inside each ovule (Figure 4). Before fertilisation, each maize plant carries hundreds of flowers in the flower heads, but the male flowers are separated from the female ones, as shown in Figure 4. The male flowers produce pollen grains (each containing a male gamete) which, in maize, do not normally fertilise female gametes from the same plant. (Male and female gametes on the same plant mature at different times.) This ensures that the pollen from one plant fertilises the female gametes of another plant, a process called cross-fertilisation. We use the terms 'ovule' and 'pollen grain' as shorthand for the female and the male gametes, respectively although these structures are not actually the gametes of plants but contain the gametes.
Thus a maize cob is the result of several hundred cross-fertilisations, and each grain has the potential to develop into a new, individual plant. Each single cob therefore provides a wealth of information about inheritance in the maize plant.
A variety is said to be pure-breeding for a character if all its members have the same character, such as purple grains, and all breeding within that variety leads to offspring that have the same character. For example, purple-grained maize and white-grained maize are both pure-breeding varieties. But why should grain colour be different in the two varieties of maize? And if plants of these two varieties were cross-fertilised, what would be the grain colour of the offspring? In order to answer these questions we will describe a breeding experiment, carried out in two stages, using these two maize varieties.
3.2 A breeding experiment: stage one
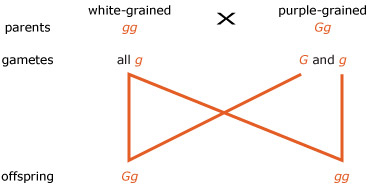
In the first stage of the breeding experiment, shown in Figure 5, plants from the pure-breeding purple-grained variety are crossed with (fertilised by) plants from the pure-breeding white-grained variety. This can be done by artificially dabbing pollen grains from one plant onto the female flowers of another plant. These plants are the parental generation (abbreviated to P), and the cobs resulting from the cross are the first offspring generation or first filial (pronounced 'phil-ee-al') generation, (abbreviated to F1). The subsequent generations in such an experiment are called F2, F3, and so on. Incidentally, if you read information on seed packets, you may well be familiar with F1 hybrid seeds, which are the product of crossing two pure-breeding parental varieties.
Returning to our maize cross (Figure 5), the most striking observation is that these cross-fertilisations result in F1 cobs all of which have purple grains. On average, each cob contains 500 grains, so examining the grains on only one cob means that we are examining a large number of offspring (or fertilisations).
Two important features of the results of this cross should be noted:
-
No F1 cobs have any white grains. This is true even if we examine large numbers of F1 cobs. Hence, one of the two characters present in the parental generation, white grain colour, has vanished in the F1 offspring generation.
-
It doesn't matter which way round the cross is carried out; that is, the result is the same whether the pollen comes from the purple-grained variety and the ovules from the white-grained variety, or vice versa. This rules out the possibility that grain colour is determined by the plant on which the cob has grown.
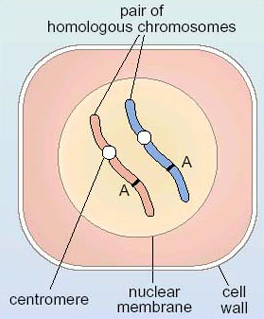
Now that we have examined the phenotype of the grains in the breeding experiment, we will explore what is happening at the level of the gene. We can consider a gene as a small section of the DNA in a chromosome, which issues instructions for a specific phenotypic character such that a maize grain is either purple (presence of purple pigment) or white (absence of purple pigment); for brevity it can be called the gene for grain colour. Most importantly for understanding the patterns of inheritance of genes, it is known that a gene has a particular location on a chromosome, such as band A in Figure 6. As this figure shows, a diploid cell contains two copies of a gene for a particular character situated at corresponding locations on the two homologous chromosomes. The technical term for the location of a gene on a chromosome is locus (plural loci).
Question 4
Where do each of these two copies of a gene in a diploid cell come from?
Answer
One comes from the female gamete and the other from the male gamete. (Fertilisation restores the chromosomes as homologous pairs, as shown in Figure 3.)
Question 5
Why is the outcome of the breeding experiment described above the same regardless of which of the parental phenotypes provides the ovules and which provides the pollen?
Answer
The simplest explanation is that the instructions that a gene issues are the same, irrespective of whether the gene is from the male or female parent.
Each gene can exist in one or more forms; each form is a different allele (pronounced 'a', as in apple, 'leel'). The existence of alleles of a gene is a powerful source of variation. It is conventional in genetics to represent each allele by a letter (either upper or lower case), printed in italics; alleles are given the same letter symbol to show that they are forms of the same gene. In the case of grain colour we will use the letter G (for grain) for the allele that is associated with purple grains and g for the different allele that is associated with white grains.
The terms 'allele' and 'gene' can be confusing because the terms are used interchangeably in some situations. For example, the 'allele for purple grain' and the 'gene for purple grain' both refer to the same thing in an interchangeable way. This stems from the fact that the forms (alleles) of any gene are of course genes themselves.
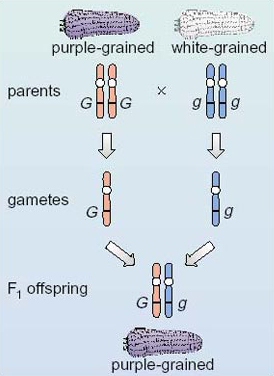
Now consider what happens at the gene level when we cross the pure-breeding purple-grained plant with the pure-breeding white-grained plant. We will designate the two copies of the gene in the purple-grained parent as GG and the two copies of the gene in the white-grained parent as gg, as shown in Figure 7. (The reason for this designation will become clear later in the section.) Note the convention of the multiplication sign to represent a breeding cross. Of course, the gametes contain a copy of each of the other maize genes too, but here we are considering only the gene for grain colour.
Question 6
Looking at Figure 7, what are the genotypes of the gametes produced by each parent?
Answer
G and g. Gametes from the purple-grained parent all contain the G allele and those from the white-grained parent all contain the g allele.
Recall from Figure 3 that meiosis ensures that each gamete contains one member of each homologous pair of chromosomes and hence only one copy of each gene.
Question 7
What would be the possible genotypes of the offspring of such a cross?
Answer
They would all be Gg or g G, and these are the same genotype.
The convention is to write the allele with the capital letter first, so the genotype of all the F1 offspring would be written as Gg. Notice that not only do all the F1 offspring have the same genotype, Gg, but that this genotype is different from that of either parent. Where the two copies of a gene are different, as in the offspring of this cross, they are said to be heterozygous (pronounced 'het-er-oh-zye-guss') and the individual is referred to as a heterozygote (pronounced 'het-er-oh-zye-goat') for that particular gene. When the two copies of the gene are the same (as in the case of each parent), they are said to be homozygous and the individual is a homozygote for the gene for grain colour.
But what is the phenotype of the F1 offspring with the heterozygous genotype Gg? You may recall (Figure 5) that the phenotype of all the F1 offspring of this cross was purple. The character that is expressed, or manifest, in the heterozygote, purple grain in this case, is said to be the dominant character because it masks the presence of the alternative character, white grain. The character that is not expressed in the heterozygote is said to be recessive. In this case, white grain is recessive to, or masked by, the dominant character, purple grain. Strictly speaking, it is the phenotype — rather than the allele — that is dominant or recessive; however, alleles are usually referred to as being dominant or recessive on the basis of the associated phenotype.
Activity 4
Match each of the terms (a)-(g) with one of the descriptions (i)-(vii).
(a) F1; (b) alleles; (c) locus; (d) heterozygous; (e) homozygote; (f) dominant; (g) recessive.
-
An individual in which both copies of the gene are the same.
-
The alternative forms of a gene.
-
The generation derived from a mating between two pure-breeding varieties.
-
The location of a gene on a chromosome.
-
A phenotype that masks the presence of the allele for a contrasting character.
-
A genotype with two different alleles of a gene.
-
A phenotype not expressed in the heterozygote.
Answer
The matches between the terms and the descriptions are as follows: (a) (iii); (b) (ii); (c) (iv); (d) (vi); (e) (i); (f) (v); (g) (vii).
3.3 A breeding experiment: stage two
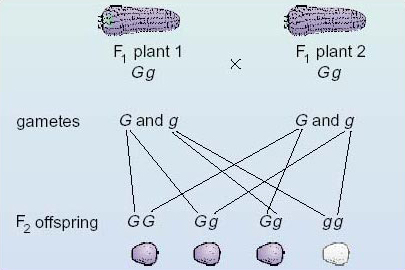
We now turn to the second stage of the breeding experiment, but this time we will follow the phenotypes and genotypes simultaneously. The purple (Gg) grains of the F1 generation are planted and when these have developed into mature F1 plants they produce male and female flowers. These F1 plants are crossed with each other, as shown in Figure 8. The fertilised ovules develop into grains borne on cobs, and these grains are the beginning of the second filial generation (F2).
The mating diagram and the outcome of the fertilisations of this cross are given in Figure 8. First consider the gametes produced by the F1 generation.
Question 8
What are the genotypes of the gametes produced by the F1 purple-grained plants?
Answer
The gametes are either G or g, since all F1 plants are Gg.
Question 9
In what ratio would these two genotypes be produced, and why?
Answer
The ratio would be 1 G: 1 g because the pair of homologous chromosomes on which they are located separate into different gametes in equal proportions.
Now consider the possible fertilisations between the gametes produced by the F1 generation, as shown in Figure 8, and the genotypes and phenotypes of the F2 generation that arises from these fertilisations.
Looking at Figure 8, you can see that the allele G of plant 1 might combine with either the G or the g allele of plant 2 at fertilisation. Over a large number of fertilisations a G-bearing ovule of plant 1 would combine with a G-bearing pollen grain of plant 2 in half of the fertilisations and combine with a g-bearing pollen grain of plant 2 in the other half. Similarly, the allele g of plant 1 might combine with either the G or g allele of plant 2. Hence, in the F2 generation three different genotypes are produced: GG, Gg and gg.
Question 10
What is the expected ratio of the three genotypes in the F2 generation? )
Answer
The expected ratio is 1GG:2Gg: 1gg (see Figure 8).
This ratio follows for two reasons. First, the two different gametes, G and g, are produced in equal numbers. Second, which ovule is fertilised by which pollen grain occurs at random; that is, a G ovule is equally likely to be fertilised by either a G pollen grain or g pollen grain.
The phenotype of each of these genotypes in the F2 generation can be determined since we know that the allele G (purple grain) is dominant to g.
Question 11
What are the phenotypes corresponding to each of the genotypes, GG, Gg and gg of the F2 generation?
Answer
G G and Gg plants are purple-grained and gg plants are white-grained.
Question 12
In what ratio would grains with the purple phenotype and grains with the white phenotype be expected to occur in the F2 generation?
Answer
The expected ratio is three purple (the dominant phenotype): one white (the recessive phenotype), since three of the four possible fertilizations have at least one dominant G allele (see Figure 8).
The phenotypic ratio of 3 : 1 (three of the dominant phenotype: one of the recessive phenotype) and the genotypic ratio of 1 : 2 : 1 (one homozygous dominant: two heterozygous : one homozygous recessive) are of fundamental importance in genetics.
Figure 9 presents the same information about the breeding experiment as shown in Figure 8, but the information is laid out in a different way. Either way of presenting the details of a cross can be used, and when producing your own diagrams you can use whichever is easier for you (although you are not expected to draw the phenotypes).
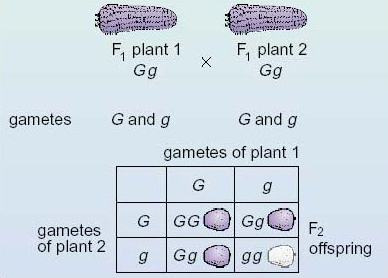
In Figure 9 the fertilisations between the various combinations of gametes from the F1 generation are shown in boxes at the bottom. Along the top you can see the two types of gamete produced by plant 1 of the F1 generation; down the left-hand side you can see the two types of gamete produced by plant 2 of the F1 generation. Inside the other boxes are the genotypes of the products of fertilisation between the various kinds of gamete, that is, the F2 generation. Thus, for example, the top left-hand box records the outcome of fertilisation between a G ovule and a G pollen grain. An examination of the contents of the four boxes should convince you that the expected ratio of genotypes of the F2 generation is 1 GG:2Gg: 1 gg (one homozygous dominant: two heterozygous : one homozygous recessive) and that the expected phenotypic ratio is therefore three purple : one white (three of the dominant phenotype : one of the recessive phenotype).
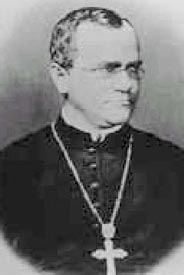
This breeding experiment in maize, which we just have described, is similar in essence to a famous series of experiments carried out by Gregor Mendel (Figure 10) on the garden pea, Pisum sativum. Mendel introduced the scientific approach to breeding experiments by:
-
following a single pair of contrasting characters in each investigation;
-
breeding beyond one generation;
-
counting the individuals showing each of the phenotypes;
-
working with large numbers of offspring.
Although the existence of genes and chromosomes was not known in Mendel's time, he predicted the separation or segregation of units (now called genes and alleles) during gamete formation. We now know that meiosis ensures that each gamete contains only one copy of a gene, because the pairs of chromosomes on which the genes are located separate into different gametes (Figure 7). This segregation of genes (units) has been given formal recognition as Mendel's law of segregation.
The breeding experiment in maize shows that characters due to dominant or recessive alleles, such as grain colour, show a particular pattern of inheritance from generation to generation: the F1 offspring all resemble one of the parents (Figure 7), and the F2 offspring have the phenotypic ratio of 3 :1 and the genotypic ratio of 1: 2 :1 (Figures 8 and 9). The action of dominant alleles explains why the recessive character 'disappears' in the F1 generation and why this character reappears in the F2 generation. Most importantly, this pattern of inheritance is a consequence of two events.
-
The two copies of a gene separate into different gametes in equal numbers.
-
The combining of a female gamete and a male gamete at fertilisation occurs at random.
The conclusions we have drawn from the breeding experiment in maize are the same as those drawn by Mendel and apply to all sexually reproducing eukaryotes, including humans. The main features of the experiment that we have described so far, and that can be explained by the theory of inheritance, are summarised in Table 1.
| 1 | The phenotype of pure-breeding varieties for a particular character is constant when crossed with members of the same variety. |
| 2 | One parental character disappears in the F1 generation when parents differ in the character for which each is pure-breeding (the recessive character is masked by the dominant character). |
| 3 | The outcome of a cross is independent of which parent provides the ovules and which the pollen. |
| 4 | The vanished (recessive) character reappears in about one-quarter of the F2 generation. |
| 5 | The two copies of a gene segregate to different gametes at meiosis and in equal numbers. |
| 6 | Gametes combine at random at fertilisation. |
Activity 5
In what respect does each of the following hypothetical breeding experiments produce results that differ in an important way from the results described in the breeding experiment in maize? Note down in each case how the results differ.
Experiment 1 100 pure-breeding red-flowered plants are crossed with 100 pure-breeding white-flowered plants. All of the offspring have red flowers. These offspring are then crossed with each other. About three-quarters of their offspring have white flowers, and about one-quarter have red flowers.
Experiment 2 100 pure-breeding red-flowered plants are crossed with 100 pure-breeding white-flowered plants. All of the offspring have pink flowers.
Experiment 3 When the pollen from 100 pure-breeding red-flowered plants fertilises the ovules of 100 pure-breeding white-flowered plants, all of the offspring have white flowers. When the pollen from 100 pure-breeding white-flowered plants fertilises the ovules of 100 pure-breeding red-flowered plants, all of the offspring have red flowers.
Answer
The results of Experiment 1 differ from those we have described for maize because in this experiment the character that vanishes in the first offspring generation is the one that reappears in about three-quarters of the individuals in the second generation. This is the other way round from the results in the maize breeding experiments, where it was the character that persisted in the F1 generation that appeared in about three-quarters of the F2 generation.
The results of Experiment 2 differ from the maize results because the colour of the first generation of offspring is intermediate between those of the parents. In the corresponding maize cross, one parental character persisted and the other vanished. {This outcome is possible in some situations; it is described as incomplete dominance}
The results of Experiment 3 contrast with those for maize in that the outcome was different depending upon which plant provided the ovules and which the pollen. With maize, the outcome of the breeding experiment was the same, irrespective of which parental phenotypes provided the ovules and which provided the pollen.
3.4 Predicting the outcome of crosses
By knowing the pattern of inheritance of genes as described above, it is possible to make some predictions about the phenotypes and genotypes of each generation in breeding experiments. This section considers some examples of such predictions.
First consider whether it is possible to determine the genotype for certain characters, such as grain colour, from observing an organism's phenotype.
Question 13
Is it possible to determine the genotype of all white-grained cobs just by observing their phenotype?
Answer
Yes, it is possible; since white grain colour is recessive, white-grained cobs must be gg.
Question 14
Is it possible to determine the genotype of all purple-grained cobs just by observing their colour?
Answer
No, it is not possible, because purple-grained cobs may be either G G or Gg. It is possible to say that one copy of the gene must be G but it is not possible to predict the identity of the second copy without further information.
Think back to our original pure-breeding parents (Figure 7). The white-grained parent was gg and any crosses between individuals of that variety would involve only g gametes. All offspring, therefore, must also be gg. Hence this is a pure-breeding variety because all breeding within the variety would lead to offspring that have the same character. Similarly, all the white-grained plants in the F2 generation (Figures 8 and 9) would also be pure-breeding for grain colour when crossed with each other.
Now consider the parental pure-breeding purple-grained variety (Figure 7).
Question 15
Why must this variety be G G and not Gg?
Answer
To be pure-breeding all the offspring must have the same phenotype as the parents — this is the definition of pure-breeding. If the parent variety had the genotype Gg, then a cross between individuals of this variety would produce offspring some of which would be purple-grained and some of which would be white-grained (similar to the cross shown in Figures 8 and 9). Hence it would not be pure-breeding.
Therefore, all members of a pure-breeding variety not only have the same phenotype, but they also have the same genotype.
One of the important things that can be learned from the study of genetics, particularly in the case of humans and agricultural breeding, is that many of the outcomes of inheritance are statistical ones; that is, they are to do with probability, as explained in Box 1, Chance and probability in genetics.
Box 1 Chance and probability in genetics
When tossing a coin there is an even chance that heads or tails will turn up, i.e. each is equally likely. The probability of throwing heads is described mathematically as 1 out of 2, or ½. In general, the probability of a particular outcome, such as heads, is defined mathematically as:
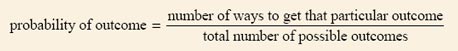
In the case of throwing a six-sided die and getting a 4, there is only one way of getting that outcome, but there are six possible outcomes, so the probability is 1/6.
What would be the probability of throwing an even number with the die?
3/6 or ½, since three of the six possible different outcomes are even numbers.
What is the probability that a gamete produced by a Gg plant will have the white-grained allele?
The probability is ½, since there are two possible outcomes and each one is equally likely. Only one of these corresponds to the white-grained allele.
Recall the reason why each of these two possibilities is equally likely.
It is because the two copies of a chromosome separate from each other into different gametes at meiosis, and in equal numbers.
What is the probability that an offspring of a cross between two maize plants that are heterozygous for grain colour (Gg) will have the white-grained genotype? (Hint: You might find it helpful to draw out such a cross, or to look at the one drawn in Figures 8 and 9.)
The probability is ¼, since there are four possible outcomes (G G, two G g, and g g), and only one of these corresponds to the white-grained genotype.
Again recall that this probability is based on two events: first on an equal number of G and g gametes being produced by each Gg plant; and second, on male and female gametes combining at random at fertilisation.
Question 16
What is the probability that an F2 maize grain, shown in Figures 8 and 9, will contain at least one g allele?
Answer
There are four possible outcomes: G G; two g G; and g g. Since three of the four possible fertilizations contain at least one g allele, the probability that the offspring will contain at least one g allele is 3/4
So far in Section 3 we have considered only two types of cross, one between two pure-breeding varieties which gives rise to the F1 generation, and one between F1 individuals which gives rise to the F2 generation. However, other crosses can be carried out and they show that inheritance of the copies of a gene follows the same basic rules. An understanding of probability, the relationship between dominant and recessive alleles, and the way that the two copies of a gene segregate at meiosis, enables us to predict the outcome of many breeding experiments.
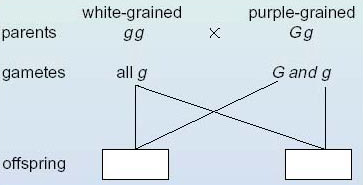
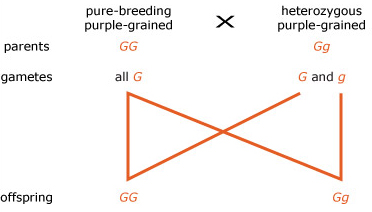
Let's consider an example. Suppose a breeding experiment was carried out in which plants from a pure-breeding white-grained variety of maize (gg) were crossed with heterozygous maize plants of genotype Gg. What are the expected genotypes and phenotypes in the offspring arising from this cross, and in what ratio would they occur? We can begin to answer this question by first determining the genotypes of the gametes produced by each of the parents. The pure-breeding white-grained plants (gg) will produce gametes that all carry the g allele, as shown in Figure 11. The heterozygous Gg plants will produce gametes, half of which carry the G allele and half the g allele (Figure 11).
Activity 6
What symbols should be entered into the empty boxes in Figure 11 and hence determine the ratios of the genotypes and phenotypes of the offspring?
Answer
The completed Figure 11 is shown in Figure 11a. The ratio of the genotypes of the offspring will be 1 G g : 1 g g, and the phenotypic ratio will be 1 purple : 1 white.
The expected outcome of the cross reveals a further important genetic ratio of 1:1. This ratio confirms that during meiosis alleles G and g in a Gg plant segregate from each other into equal numbers of gametes containing G and g alleles, and that fertilisations between these gametes and those of the other parent occurs at random and therefore both possible combinations are equally likely.
We have seen that the phenotypes of members of each generation in a breeding experiment can be understood by using a model of inheritance. This model involves representing alleles by letters. The relative proportions of the possible combinations of letters then account for the ratio of the phenotypes. In fact this is an example of mathematical modelling; the mechanism of inheritance is regarded as equivalent to a mathematical process whose consequence can be calculated by the well-established laws of chance and probability.
In the next two questions you are asked to predict the results of some different sorts of crosses using the same rules of dominant/recessive alleles, the segregation of the two copies of a gene and the combining of gametes at random.
Activity 7
A breeding experiment was carried out in which plants from a pure-breeding purple-grained variety of maize were crossed with plants that were heterozygous for grain colour. Draw the mating diagram for this cross and then predict the genotypic and phenotypic ratios of the offspring.
Answer
The mating diagram for this cross is shown below.
The genotypic ratio of the offspring is 1 G G : 1 G g ; the phenotype of all the offspring is purple-grained, since they all carry at least one, dominant, G allele.
Activity 8
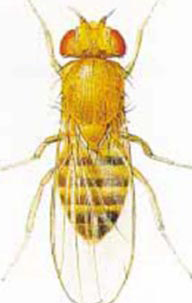
Which, if any, of the following breeding experiments in the common fruit-fly (Drosophila melanogaster), shown in Figure 12, could have involved parents that were pure-breeding for eye colour? Assume that red eye colour is dominant to brown eye colour. Give reasons for your choice, and reasons for rejecting any options you do not choose.
-
300 brown-eyed flies are crossed with 300 red-eyed flies. All the offspring are red-eyed.
-
300 brown-eyed flies are crossed with 300 red-eyed flies. Half of the offspring are brown-eyed and half are red-eyed.
-
300 brown-eyed flies are crossed with 300 brown-eyed flies. All of the offspring are brown-eyed.
Answer
Brown-eyed parents must be pure-breeding in all cases, since their genotype must be homozygous recessive.
(a) The red-eyed parents must have been pure-breeding; had they not been pure-breeding, then two different phenotypes would have been observed in the offspring. The situation is analogous to the maize example shown in Figure 7.
(b) This experiment cannot have involved pure-breeding red-eyed parents. If the red-eyed parents had been pure-breeding, all of the offspring would have been red-eyed.
(c) The crosses between the brown-eyed flies produce brown-eyed offspring, and this is the result you would expect to find if the parental lines are homozygous recessive.
Activity 9: Tackling problems in genetics
This activity provides hints on how to tackle problems in genetics that you will be expected to solve.
General hints for tackling problems in genetics
Here we will offer some guidelines on how to set about solving genetics problems, and you will then tackle a problem using these guidelines. You need to bear in mind that genetics problems cannot be solved by rote learning; each one has to be tackled afresh using your understanding of genetic principles, common sense, and sometimes trial and error. Here is a list of guidelines, which should help you to tackle a wide range of genetics problems; you may need to adjust the order in which you work through the steps according to the information given in the question.
Read the question and make sure that you understand all of the terms that are used (e.g. pure-breeding, heterozygous, etc.).
Draw out the crosses as mating diagrams, using one of the two alternative layouts shown in Figures 8 and 9, and include all the information that is given in the question, e.g. pure-breeding tells you that a variety is homozygous. This will help you to think about the problem logically, and show what information you need to deduce, e.g. the genotypes of one or more of the generations involved.
Assign letters to the alleles of the genes, or the copies of genes, that are involved, if they are not specified in the question. You may need to use information provided in the question to deduce which phenotype is dominant and which is recessive; for example, if a particular phenotype disappears in the progeny of one generation and reappears in the next generation, you can infer that this phenotype is recessive to the phenotype that is masking its presence.
Complete the mating diagram; for example, use the genotypes of each generation to deduce the genotypes of the gametes, and use the genotypes of the gametes to determine the genotypes of the offspring. (With some problems you may be working from genotypes of offspring back to the genotypes of the parents.)
Use information about the dominant allele or character to determine the phenotypes of each generation. (In some problems, such as the one given here, you will start by using phenotypes to determine genotypes.)
Calculate the ratios of the genotypes and of the phenotypes from the mating diagram.
Ask yourself whether the results are consistent with what you have learned about genetics and probability.
We suggest that you tackle the following problem using the above guidelines.
A genetics problem
The fruit-fly Drosophila melanogaster is widely used by geneticists for breeding experiments in the laboratory because it is easy and cheap to rear and each female produces hundreds of eggs. Suppose that you carry out a breeding experiment using two pure-breeding varieties of D. malanogaster, one with normal-shaped eyes and one with eyes reduced to about half the normal size, called 'eye-less'. The first cross is between these two varieties. The F1 offspring all have normal eyes. The second cross is between an F1 normal-eyed fruit-fly and a pure-breeding eye-less variety. What is the expected ratio of genotypes, and the expected ratio of phenotypes of the offspring of the second cross?
Answer
We solved the problem by working through each step in the guidelines in turn:
1. Pure-breeding parents, by definition, must be homozygous, since they breed true; since the two varieties have contrasting characters, they are homozygous for different alleles of the gene for eye shape.
2. We drew out a mating diagram using the information given in the question:
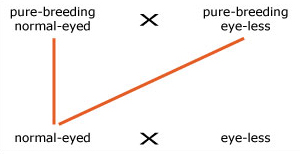
3. Next we assigned letters to alleles of the gene for eye shape. Since normal shape appears in the F1 generation we deduced that normal shape is dominant to eye-less; we used EE for normal-eyed flies and ee for eye-less, but you may have chosen a different letter.
4 We then drew the mating diagram as shown in Figure b. (The normal-eyed F1 fly must be heterozygous (Ee) since it is the offspring of EE and ee pure-breeding parents. All eye-less flies must be ee because this phenotype is recessive.)
5. The phenotypes of the offspring of the second cross are (Ee) normal-eyed (since E is dominant to e) and (ee) eye-less.
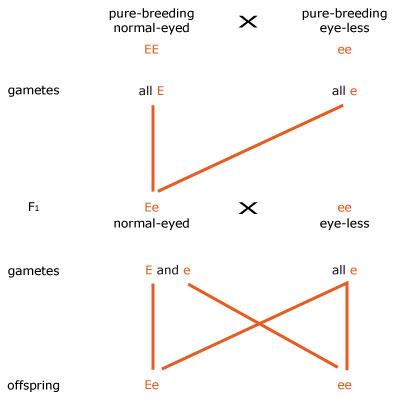
6. The ratio of the two genotypes of the offspring of the second cross is 1 Ee : 1 ee, and the ratio of the two phenotypes is one normal-eyed (Ee) : one eye-less (ee).
7. The results appear consistent with what we know of genetics, and the ratio is a familiar genetic ratio.
You can use the guidelines again when tackling genetics problems later in the course.
4 Why not an exact 3:1 ratio?
Before we leave the maize breeding experiments we will look more closely at some actual values obtained for the F2 generation and how closely they fit the expected phenotypic ratio of 3:1. Table 2 gives the ratios of purple to white grains for eight cobs of the F2 generation, counted by members of the S103 Course Team.
Notice the variability of the results between cobs in Table 2. One of the most striking features of biological results is their variability. First, consider the total number of grains in each cob. None of the figures in the table is the 'right' answer; each set reflects the particular feature of the individual cob from which they were taken. Some of the cobs may have more grains than others because there were more female flowers and hence more ovules, or because a larger proportion of the ovules were fertilised.
| Total no. of grains | No. of purple grains | No. of white grains | Ratio of purple to white grains |
|---|---|---|---|
| 565 | 434 | 131 | 3.31:1 |
| 487 | 364 | 123 | 2.96:1 |
| 554 | 436 | 118 | 3.69:1 |
| 521 | 398 | 123 | 3.24:1 |
| 760 | 562 | 198 | 2.84:1 |
| 426 | 316 | 110 | 2.87:1 |
| 544 | 398 | 146 | 2.73:1 |
| 676 | 501 | 175 | 2.86:1 |
Now consider the variation around the 3 : 1 ratio. Why is there a variation in the ratio of purple to white grains, i.e. why is this ratio not exactly the expected ratio of 3 :1? The short answer is 'chance'. The predicted or expected ratio does not tell us the actual ratio of purple to white grains in a particular cob, but rather the most probable ratio, as explained in Box 2, More about chance and probability in genetics.
Box 2 More about chance and probability in genetics
The observed deviations in genetics experiments from predicted ratios like 3 :1 are similar, in principle, to what you observe when you toss a coin. The expected ratio of heads to tails is 1 : 1 because each is equally likely. If you were to toss a coin a million times, the result would be a ratio very close to 1 : 1. If you tossed it only ten times, however, the result might be quite a marked deviation from a 1 : 1 ratio (e.g. six heads and four tails — a ratio of 3 :2, or 1.5 : 1 — instead of five heads and five tails).
In an experiment with maize, suppose that exactly half of the ovules on a female flower head contained the allele G and the other half contained g. Imagine also that of the millions of pollen grains that are artificially dabbed onto the female flowers in a breeding experiment, exactly half contain G and the other half contain g. Which of the millions of pollen grains produces the few hundred gametes that win the race to fertilise the ovules is totally independent of whether the gametes contain G or g. Purely by chance, the proportion of G-bearing gametes that succeed in this way may be rather higher than one-half for one flower head. The cob would then develop rather more than the 3 : 1 ratio of purple to white grains. On another flower head the opposite might occur, with a disproportionately higher number of g-bearing pollen grains fertilising the ovules. Similarly, the proportion of g-bearing ovules fertilised may be more (or less) than one-half. If a sufficiently large number of flower heads are investigated, giving a very large total of the number of grains counted, then the ratio will be very close to 3 : 1, but for any one flower head it may deviate quite markedly from 3:1.
Adding all the purple grains and all the white grains of the cobs given in Table 2, gives an overall ratio close to the expected ratio of 3 : 1, in fact a ratio of 3.03 : 1.
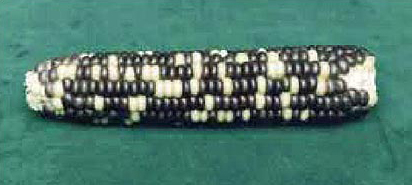
Returning to our examination of the expected phenotypic ratio of 3 : 1, a cob of the F2 generation is shown in Figure 8.13. You can see how the purple and yellow grains (the latter are white when fresh) are distributed at random throughout the cob. This distribution reflects the chance events of which allele, G or g, each ovule bears and whether it was fertilised by a G-bearing or a g-bearing pollen grain.
Click on 'view document' and print the page required for the activity.
Activity 10 The 3:1 phenotypic ratio
This activity involves you in calculating the ratio of the two phenotypes in the cob in Figure 13, and thinking about what this tells you.
This activity is designed to consolidate your understanding of ratios, fractions and probability. It takes the form of a series of very short questions. Try to answer all of the questions before revealing the answers given beow. The comments also contain some general advice on ratios and fractions.
a. Count the purple and the white grains (yellow in this dried cob) on the one visible side of the F2 cob in Figure 13. Calculate the ratio of purple to white grains, expressing your answer in the way shown in the right-hand column of Table 2.
b. Write your results down if you don't think that you will be able to remember them. How do your results compare with our results given in Table 2?
c. The grains on the cob are the result of fertilizations between two kinds of pollen grains, G-bearing and g-bearing, and two kinds of ovules, G-bearing and g-bearing. Thus the expected phenotypic ratio is three dominant (purple) : one recessive (white). Explain the deviation from the 3 : 1 ratio for the part cob that you counted.
d. Now think again about the grains you counted. How many grains are visible altogether? Give the number of white grains as a fraction of the total number of visible grains.
e. What is the probability that an F2 maize grain will have the genotype g g? Compare this with your answer to part (d).
Answer
a. There are 134 purple and 42 white grains visible (your may have counted slightly different numbers depending on whether or not you included part grains that are visible). This gives a ratio of 134 : 42, which simplifies to 3.19 : 1.
b. The numbers of purple and white grains that you counted will be much smaller than the values in Table 2, since you counted grains on only part of a cob. However, for each cob in Table 2 the ratio of purple to white grains, to the nearest whole number, is 3 : 1, although all the cobs show a slight deviation from this. Your ratio will show a deviation from 3 : 1, but the deviation is likely to be within the range covered by the ratios in Table 2.
c. The deviation from a 3 : 1 ratio is due to chance events. Possibly the number of G-bearing ovules on the cob was not equal to the number of g-bearing ovules and/or possibly the numbers of G-bearing pollen and g-bearing pollen that succeeded in fertilizing the ovules were not equal. The total number of grains counted was relatively small, hence the chance of a deviation from the expected ratio is high.
d. There are 134 purple and 42 white grains visible, giving a total of 176.
Thus the number of white grains as a fraction of the total number is 42/176 which is 1/4.19 i.e. approximately ¼.
e. There are four possible outcomes for a cross between two maize plants that are heterozygous for grain colour. Two of these outcomes give the Gg genotype, one gives GG and one gives gg, so the probability that an F2 maize grain has the genotype gg is ¼.
The value that we calculated in (d) is in good agreement with the expected value of c, although it is not exactly the same because of chance variation.
Activity 11
Table 3 gives the numbers of the two contrasting phenotypes in the F2 generation for two of Mendel's pea-breeding experiments. In the seed colour experiment he counted the largest number of F2 progeny and in the pod colour experiment he counted the smallest number of F2 progeny. In both cases, the phenotype printed in italics is the dominant one.
-
Calculate the actual F2 phenotypic ratios in these two experiments.
-
Comment on the ratios that you have calculated.
Answer
(a) The F2 phenotypic ratio for seed colour is 3.01 : 1 (yellow : green) and that for pod colour is 2.82 : 1 (green : yellow).
(b) The deviations from a 3 : 1 ratio are due to chance. However, we do expect larger variations with smaller samples. This is what we observe in Mendel's results. In the experiment in which Mendel counted a large number of seeds, he obtained a ratio very close to 3 : 1. In the experiment in which he counted a much smaller sample of pods, he obtained a ratio that showed a greater deviation from a 3 : 1 ratio. {You may also have observed that in the phenotype for seed colour, yellow is dominant to green, but in the phenotype for pod colour, green is dominant to yellow! So one should not make assumptions about which phenotype is dominant and which is recessive.}
| Character | Numbers of each phenotype | Ratio of phenotypes |
|---|---|---|
| seed colour (yellow or green) | 6 022 yellow | 2 001 green |
| pod colour (green or yellow) | 428 green | 152 yellow |
5 Inheritance of more than one pair of contrasting characters
We have considered the inheritance of one pair of contrasting characters that involves the segregation of the two copies of one gene in maize. A single chromosome carries many genes, of the order of 2 000 to 4 000 in each human chromosome, each carrying its own information, and each with its specific location, its own locus, on the chromosome. In a pair of homologous chromosomes, there will be many pairs of genes strung along their length.
These observations raise some intriguing questions. What happens when a cross is made that involves two pairs of genes affecting two different characters? Are genes that are present on the same chromosome inherited together?
Activity 12
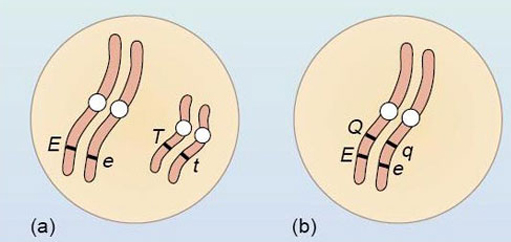
A heterozygous plant with the genotype Ee Tt produces four kinds of gametes, E T, e t, E t and e T in the ratio 1:1:1:1. Another heterozygous plant, with the genotype Ee Qq, produces four kinds of gametes, E Q, e q, E q and e Q in the ratio 8:8:1:1. How can these differences between the two ratios be explained?
Answer
In the first plant, the genes are on different pairs of homologous chromosomes — E and e on one pair and T and t on another pair, as shown in Figure 16a. This means that at gamete formation the genes assort independently from each other to give the four different gamete genotypes in equal proportions.
In the second plant, the genes must be linked on the same chromosome, as shown in Figure 16b. This means that at gamete formation E and Q, and e and q, will stay together more often than they separate. Only when the linkage is broken by crossing over will the gametes of genotypes E q and e Q be produced. As this is a relatively rare event, most of the gametes will be E Q and e q, with only a small proportion of E q and e Q; hence the 8E Q : 8 e q: 1 E q : 1 e Q ratio.
Question 17
If the genes making up the genotype of an animal were shown to be organized into five groups of linked genes, how many chromosomes would you expect to find: (a) in each gamete; (b) in each fertilized ovum?
Answer
Genes that are in the same linkage group are on the same chromosome, so you would expect to find (a) five chromosomes in each gamete and (b) ten chromosomes in each fertilized ovum.
Conclusion
The number of chromosomes is characteristic of each species and can vary enormously between species.
Sexual reproduction always includes two distinctive processes: the production of gametes, which involves meiosis, and fertilisation. The two processes are accompanied by changes in the chromosome number, from diploid to haploid and from haploid to diploid, respectively.
Genetics is based on the concept of the gene as the unit of inheritance. A particular phenotypic character is determined by the two copies of a gene that an organism possesses and these two copies are identical in a pure-breeding variety.
When organisms with contrasting characters for which they are pure-breeding are crossed, the dominant character appears in the F1 generation and the recessive character is masked. Crossing the F1 offspring gives rise to the F2 offspring with a phenotypic ratio of 3 :1 (three with the dominant phenotype : one with the recessive phenotype) and a corresponding genotypic ratio of 1: 2 :1 (one homozygous dominant: two heterozygous : one homozygous recessive). A cross of a heterozygote with a homozygous recessive individual produces offspring with a 1 :1 phenotypic and genotypic ratio (one heterozygous : one homozygous recessive).
The genotypic ratios of a cross result from the separation of the two copies of a gene to different gametes in equal numbers, and because gametes combine at random at fertilisation. The expected ratios in genetics do not tell us the actual ratios observed, but rather the most probable ratios.
The behaviour of chromosomes at meiosis explains the segregation of the two copies of a gene and the independent assortment of genes. The linkage of genes on a chromosome can be broken by means of crossing over.
Recombination – the production of new combinations of alleles – arises during meiosis from independent assortment of chromosomes and crossing over between homologous chromosomes.
The amount of crossing over between linked genes differs according to their distance apart. This observation is the basis for mapping the order of genes along a chromosome, and hence drawing up genetic (or linkage) maps.
Acknowledgements
The content acknowledged below is Proprietary (see terms and conditions) and is used under licence.
Course image: Zappys Technology Solutions in Flickr made available under Creative Commons Attribution-NonCommercial-ShareAlike 2.0 Licence.
Grateful acknowledgement is made to the following sources for permission to reproduce material within this course.
Figures 1, 2 Institute of Cancer Studies, University of Birmingham;
Figure 10 Science Photo Library;
Figure 12 From Flies and Disease, Vol. 1, 1971, by Bernard Greenberg, published by Princeton University Press, 1971. F. Gregor, artist;
Don't miss out:
If reading this text has inspired you to learn more, you may be interested in joining the millions of people who discover our free learning resources and qualifications by visiting The Open University - www.open.edu/ openlearn/ free-courses