Understanding water quality
Use 'Print preview' to check the number of pages and printer settings.
Print functionality varies between browsers.
Printable page generated Thursday, 25 April 2024, 8:02 AM
Understanding water quality
Introduction
Please note, this course was written in 2003/2004 therefore some of the information is now outdated.
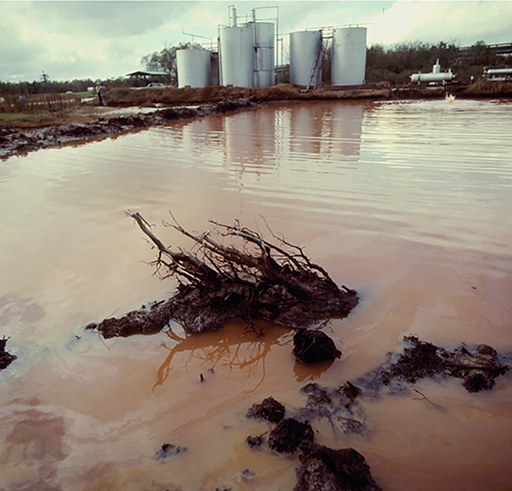
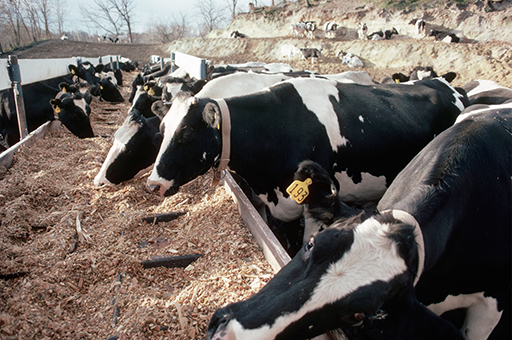
In this free course, Understanding water quality, you will look at the main properties of natural water and how these may be altered by pollutants of various types. Natural water is not just H2O: all natural waters contain dissolved and suspended substances - seawater is an obvious example of water containing dissolved salts, but freshwater does also, although at a far lower concentration. Water pollution is defined as a change in the quality of the water due to human activity that makes the water less suitable for use than it was originally (Figure 1). It is difficult to set absolute standards of purity that apply for all uses of water however, because water that is considered clean enough for one purpose may be too polluted for another.
This OpenLearn course provides a sample of level 2 study in Environment & Development.
Learning outcomes
After studying this course, you should be able to:
describe the chemical compositions of natural waters, and explain how and why these compositions vary
describe the main sources of water pollution, the main types of pollutant and how each type may be controlled
outline the extent of water pollution in the UK and in selected global locations
identify the criteria for drinking water acceptability in the EU, and outline the processes used to treat water for a public water supply
outline how sewage may be treated before discharge to the environment.
1 Natural waters
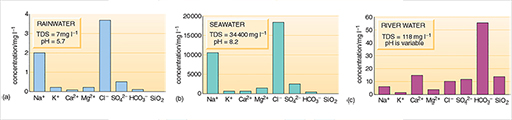
Rainwater, seawater and river water (Figure 2) and groundwaters (Figure 3) generally have very different chemical compositions and differ widely in their concentrations of total dissolved solids (TDS). Average TDS values are: 7mg l-1 for rainwater, 118mg l-1 for river water and 34 400 mg l -1 for seawater. TDS values for groundwater vary too much for an average to be meaningful. TDS is a good indicator of water quality, and standards that have been set for drinking water and for water used in other ways include maximum values for TDS.
Rainwater and seawater (Figure 2a and b) have similar relative proportions of dissolved solids, although rainwater is much more dilute. Most of the dissolved salts in rainwater come from sea spray dispersed into the atmosphere. A major difference in composition is the greater relative proportions of dissolved gases in rainwater, particularly carbon dioxide. Natural rainwater is slightly acidic as a result of this reaction, with an average pH of 5.7, whereas the average pH of seawater is 8.2 (Box 1). Rainwater may be even more acidic in areas where the highly soluble acidic gases sulphur dioxide and nitrogen dioxide (both produced by fossil fuel power generation, transportation and industrial processes) are present in the atmosphere.
Box 1 pH
pH is a measure of how acidic or alkaline a solution is. The pH scale ranges from less than 1 to 14, with low values the most acid, and high values the most alkaline. A neutral solution (or pure water) has a pH value of 7.
An acidic solution has a higher concentration of hydrogen ions, H+, than pure water (this is where the 'H' in the term 'pH' comes from) and a pH of less than 7. For example, when carbon dioxide (CO2) dissolves in water, a slightly acidic solution is formed:

The pH of most natural waters lies between 5.5 and 8.5.
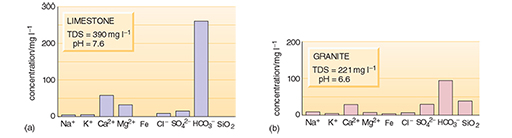
River water and groundwater differ from rainwater in that both have greater TDS values and different relative proportions of dissolved substances (Figures 2c and 3). Rivers may also contain solid particles in suspension, in addition to dissolved substances. Groundwater usually has a low content of suspended solids because these are filtered out as the water passes through the ground. Organic processes in soils, the solution of soluble minerals in rocks, interaction with clays and other minerals, and the chemical weathering of rocks are responsible for the changes in composition as rainwater becomes surface water or groundwater. The relative proportions of the dissolved substances change and the TDS value increases as a result of these processes. In general, groundwater takes on the chemical properties of the rocks through which it passes.
Activity 1
What are the three principal dissolved constituents of river water and both groundwaters in Figures 2c and 3?
Answer
For the river water and granitic groundwater the three most abundant are bicarbonate (HCO3-), calcium (Ca2+) and silica (SiO2). For the limestone groundwater, bicarbonate and calcium are again abundant, but magnesium (Mg2+) is more abundant than silica (although this may not be the case for all limestones).
The main reason for the abundance of HCO3- and Ca2+ is the solution of calcium carbonate (CaCO3) which can be present as limestone or as a cement in sandstone. Limestone is a fairly common rock, and it dissolves readily in acidic waters such as rainwater:

The mineral dolomite (CaMg(CO3)2) has a similar reaction in acidic water, and provides a source of magnesium ions. Magnesium also comes from the weathering of minerals such as olivine and pyroxene. Silica comes from the weathering of silicate minerals, which are a major constituent of most common rocks.
Box 2 Hardness in water
Hardness in water is mainly due to the presence of ions of the elements calcium, magnesium and iron. High concentrations of these ions have objectionable side-effects, particularly scum and scaling. The ions react with soap, forming insoluble compounds and preventing the soap from lathering properly, causing rings on bathtubs and leaving a grey soap scum on washed clothes. Hard water also leaves mineral deposits (limescale) in plumbing and appliances that use water, particularly kettles.
If the hard water contains bicarbonate ions, carbonate salts of the metals are precipitated when the water is boiled or heated above 70°C. Such water is said to possess temporary hardness because the carbonate salts are largely insoluble and are thus removed from the water as limescale deposits.

When the main anions (negatively charged ions) present are chloride, sulphate or nitrate, the hardness is called permanent hardness, which cannot be removed by boiling.
Some people in hard water areas use water softeners, which usually replace calcium, magnesium, and certain other ions in the water with sodium ions. The sodium ions are supplied from common salt (sodium chloride) in the water softener. While softened water containing sodium ions in moderate concentration is unobjectionable in taste or household use, it may be of concern to those who, for health reasons, are on diets involving restricted sodium intake.
In spite of the problems encountered when boiling and using soap in hard water, the dissolved solids may give hard water a pleasant taste and have various medicinal benefits.
The extent of hard water in Britain tends to follow a north to south-east gradient; the softest water is in Scotland, northern England and Wales, and the hardest is in East Anglia and south-east England. Death from cardiovascular (CV) disease (heart disease and stroke) tends to follow a similar pattern — a higher rate in the north and north-west than the south and the south-east. Several statistical surveys in a number of other countries have also shown this inverse relationship between CV disease and water hardness, i.e. CV disease is more common in softer water areas. However, there is no evidence of a direct causative link between CV disease and soft water, but as a precaution standards have been set for water that has been artificially softened. The UK has set restrictions on levels of water softening, and UK drinking water should now have a minimum hardness, if it has been softened, of 60 mg l -1 of Ca2+.
The composition of water will vary with the type of rock the water has flowed over or through. Water flowing through igneous and metamorphic rocks usually has lower TDS values than that flowing through sedimentary rocks, because igneous and metamorphic rocks contain minerals that are generally less soluble. Water that has flowed through deposits of ore minerals will often have a high metal ion content and may have a high sulphate content, derived from sulphide ore minerals.
The TDS value of the water also depends on the length of time the water has been in contact with rock. Groundwaters usually have higher TDS values because the residence time of groundwater is generally higher than that of surface water. The composition of groundwater changes as it passes through an aquifer. Near the recharge area, groundwater has low TDS values, but as the water flows through the aquifer it gains more dissolved substances, so the TDS values are usually higher at discharge points.
In hot dry regions where rainfall is low and evaporation is high, there is little infiltration and the soluble products of chemical weathering are flushed from aquifers very slowly. So groundwaters can have high TDS values in these areas.
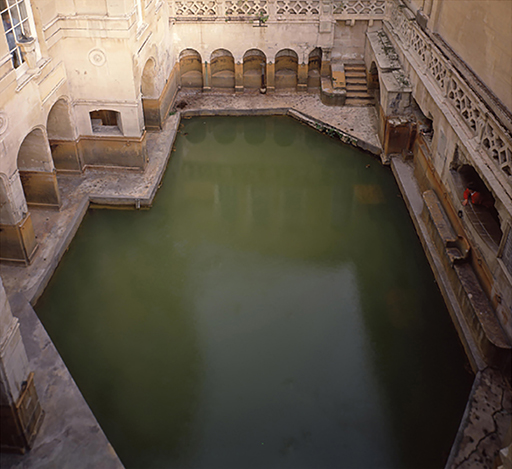
Deeper groundwaters that are slow moving often have particularly high concentrations of dissolved substances with TDS values exceeding a few thousand milligrams per litre. Sodium chloride is usually a major constituent of these waters. When these saline waters are discharged at the surface they are often called mineral waters (Figure 4).
Activity 2
Looking back at Figure 3, why does the groundwater from the limestone area have a higher TDS value than the groundwater from the granite area?
Answer
Minerals in the limestone are much more soluble than the minerals in granite, especially if the water is slightly acidic. The high TDS is caused mainly by calcium and bicarbonate ions.
The variation in natural waters may make it hard to determine when water is polluted. Although pollution means a deterioration in water quality caused by human agencies, the same effect may occur naturally. For instance, large amounts of sediment and vegetable matter can be washed into rivers during rainstorms; toxic metals and acid waters can get into rivers and groundwaters where concentrations of ore minerals occur; and contamination can result from oil seepages at the surface. These are all natural processes, and many of the effects will be neutralised in time; the environment has ways of adapting itself in the long term. Pollution, on the other hand, can be on a very large scale, can happen rapidly, can take a variety of forms, and can upset the ecological balance where it occurs.
2 Pollutants
We shall now look at the most common water pollutants, their sources, their effects, and how they can be controlled. A summary is provided in Table 1 and some points are discussed below in more detail.
| Pollutant | Nature | Common sources | Effects of pollution | Control |
| natural organic material | biodegradable organic materials; normally decomposed by aerobic bacteria (which require water-dissolved oxygen) | domestic sewage; food-processing industries; farms | excessive depletion of oxygen in water damages aquatic life; complete removal of oxygen causes anaerobic bacterial action on pollutants, resulting in offensive smells | sewage treatment works, by physical and biological processes; containment of sewage, cattle slurry and silage effluent |
| living organisms | disease-causing organisms (bacteria, viruses) | human and animal wastes; certain industries (e.g. tanning, slaughtering) | curtailed recreational use of rivers, lakes, etc. | most commonly controlled with chlorine; seldom possible to remove all bacterial and viral contamination, but concentrations are greatly reduced |
| plant nutrients | principally nitrogen and phosphorus compounds | domestic sewage; industrial wastes; farms (especially from chemical fertilizers) | excessive growth of aquatic plant life leads to oxygen depletion, offensive smells, bad taste; excess nitrate in drinking water could be toxic | serious problem: not removed by ordinary sewage treatment methods; very expensive to reduce |
| organic chemicals | detergents, herbicides, pesticides, industrial by-products, medicines | domestic sewage and industrial waste; farms | poison — threat to fish and other wildlife; possible long-term hazards to human beings | very often not removed by usual sewage or water purification treatments |
| inorganic chemicals | salt, acids, metallic salts, cyanides, etc. | mining; industrial processes; natural deposits (e.g. salt); road salting in winter | toxic effects on humans and wildlife; interference with manufacturing processes; bad smells and tastes; corrosion of equipment | difficult: non-standard processes necessary |
| sediments | primarily soils and minerals; also some industrial by-products | land erosion by storms; flood waters; some industrial, quarrying and mining processes | obstruction or filling of rivers, lakes, reservoirs; increased cost of water purification; interference with manufacturing processes; equipment corrosion; reduced aquatic life and diversity | controlled by use of soil conservation and flood control methods; also by improvement of industrial technology; reduced by settling ponds |
| heat | heated water returned to rivers and lakes | electric power plants; steel mills; refineries and other industrial cooling units | reduction of oxygen in the water, resulting in slower or incomplete pollutant decomposition and harm to aquatic life | minimised by recirculation and reuse of industrial cooling waters |
2.1 Natural organic material
Much of the natural organic material found as a pollutant in water comes from domestic sewage and the effluents of farms and food-processing industries. Farm waste can be especially polluting and is an important EU issue: cattle slurry is up to 100 times as polluting per cubic metre as domestic sewage, and silage effluent is up to 200 times as polluting (Figure 5). Natural organic material consists of carbohydrates, proteins and fats, plus a number of other substances in lesser amounts. These are biodegradable; that is, they can be broken down by bacteria and other organisms into relatively harmless end-products. If sufficient oxygen is present in the water, aerobic bacteria (oxygen-using bacteria) feed on the organic material, using oxygen dissolved in the water. The polluting material is converted into water, carbon dioxide (CO2), nitrates (NO3-), sulphates (SO42-) and phosphates (PO43-). This process can continue as long as the bacteria can get enough oxygen from the water.
The oxygen concentration of unpolluted fresh water is around 10 mg l-1. The actual concentration depends partly on the rate at which oxygen is supplied by aquatic plants through photosynthesis and partly on the rate at which it is dissolved from the air—more oxygen is dissolved where there is a proportionately large surface area of water in contact with the air, such as in shallow ponds or turbulent rivers. Another important influence on oxygen concentration is temperature. The higher the temperature, the lower the amount of dissolved oxygen in the water: at 10 °C the concentration is about 11 mg l-1, falling to about 9mg l-1 at 20°C.
If excessive amounts of natural organic materials are discharged into a body of water, the demands of the bacteria feeding on it exceed the rate at which the oxygen can be replenished, and the oxygen concentration falls. This brings about a reduction in aquatic life; many animals in the water will die as the oxygen concentration decreases, and few plants thrive when organic pollution is severe. Trout and salmon die when the oxygen concentration falls below 3 mg l-1, and aerobic bacteria will not survive at concentrations below about 0.5 mg l-1.
At this point the decomposition of the polluting organic material is taken over by anaerobic bacteria (bacteria that exist in the absence of oxygen). These bacteria reduce the organic material to a different set of end-products — hydrogen sulphide (H2S), ammonia (NH3) and methane (CH4). They give the water a foul smell and indicate severe pollution.
The biochemical oxygen demand (BOD) is a measure of how much natural organic material—sewage, sewage effluent or industrial effluent —is present in a body of water. BOD is defined as the amount of oxygen taken up by microorganisms (principally bacteria) in decomposing the organic material in a water sample stored in darkness for 5 days at 20°C. Water with a high BOD has a low level of dissolved oxygen.
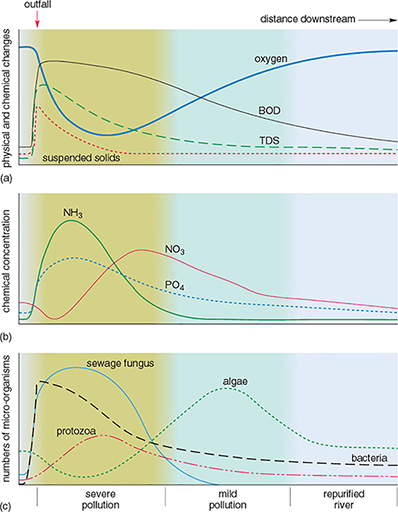
Rivers have some capacity for self-purification after pollution by biodegradable, natural organic materials. Figure 6 shows the effects of pollution downstream from a sewage outfall on one particular river.
Activity 3
Downstream from the sewage outfall, the dissolved oxygen in the water rapidly decreases and then gradually increases again (Figure 6a). How can this be explained?
How do the concentrations of ammonia (NH3) in Figure 6b vary?
Which organisms appear to be most able to tolerate the pollution (Figure 6c)?
What is the most likely explanation for the changes in the distribution of the organisms downstream of the sewage outfall?
Answer
The sudden decrease in oxygen a short distance downstream from the sewage outfall is caused by the oxidation of organic material, as shown by the increase in oxygen demand (BOD) just below the sewage outfall. After this, the water is slowly reoxygenated from the atmosphere and from aquatic plants, as the algal population increases.
Ammonia (NH3) concentrations increase after sewage enters the river, then gradually decrease downstream. (The increase is due to nitrogen-containing compounds being decomposed by anaerobic bacteria. The values decrease downstream as the ammoniacal compounds are oxidised, giving an increase in nitrate (NO3) concentrations.)
Bacteria, protozoa and sewage fungus appear to be most able to tolerate the pollution. These organisms are most abundant in the polluted parts of the river.
Organisms that tolerate low levels of dissolved oxygen are able to breed and thrive in the parts of the river closest to the sewage outfall. They have little competition and few predators. As the level of dissolved oxygen increases downstream, the less tolerant species are able to exist and may compete with others also able to survive there. As higher levels of dissolved oxygen are restored (that is, the river is self-purified), a more balanced aquatic ecosystem becomes established.
2.2 Living organisms
Besides the living organisms that form part of the natural cycle in rivers, there are other organisms that are less desirable. Their presence is generally due to human activities, and they are a form of pollution. Many of these organisms are pathogenic bacteria, which can cause disease. The most common source of pathogenic bacteria is sewage, and the purpose of the 19th Century legislation in England and Wales prohibiting the discharge of raw sewage into rivers was to prevent the spread of disease. Pathogenic bacteria are adapted to body temperatures so they die off relatively quickly in cold river waters. For example, typhoid bacteria die within seven days in river water at the temperatures found in Britain—but a week is long enough to spread infection.
As well as bacteria, there are other aquatic organisms that may be harmful. Diseases may also be transmitted by protozoa, worms, snails and insect larvae (Figure 7).

Non-pathogenic bacteria are also part of the aquatic system. One such bacterium, Escherichia coli (E. coli), has various strains, most of which are non-pathogenic and exist in human and animal intestines in a symbiotic relationship, making substances needed by humans and animals. The presence of E. coli in river water is therefore a useful indication of faecal pollution. The coliform count (the number of coliform bacteria, of which E. coli is one, present in a fixed volume of water) is used as a measure of the extent of such pollution.
2.3 Plant nutrients
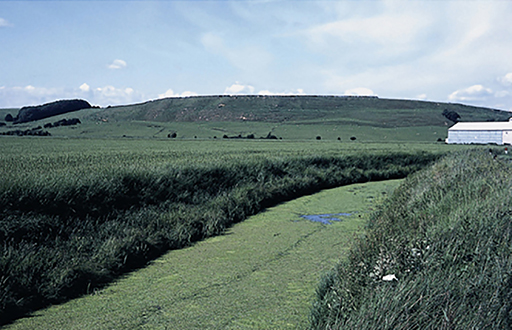
Plant nutrients are inorganic substances — mainly nitrogen and phosphorus compounds— that are essential for normal plant growth. Nitrogen and phosphorus come from human and animal faeces, detergents and fertilizers, and are not removed by standard water treatment processes or by sewage treatment. If the concentration of these nutrients in water gets too high they can cause a rapid proliferation of algae—an algal bloom (Figure 8). This can discolour the water, give it a bad taste and smell, and may produce a green scum on the surface. When they die, the algae sink and decay, forming large amounts of natural organic material with a high oxygen demand. The water becomes deoxygenated and polluted even further. This type of pollution is not usually a problem in British rivers but it does affect some reservoirs, lakes and canals.
2.4 Organic and inorganic chemicals
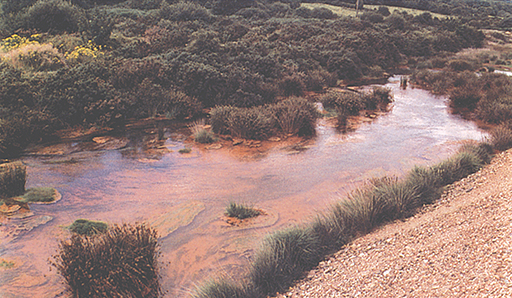
Organic and inorganic chemicals can become pollutants when they are washed into rivers, lakes or the sea. Some of the chemicals are toxic, depending on their concentrations. Toxic organic substances include agricultural pesticides such as dichlorodiphenyltrichloroethane (DDT) and dimethyl mercury and also polychlorinated biphenyls (PCBs), which are byproducts of the plastics industry. DDT and PCBs are particularly dangerous as they are very stable and not biodegradable, so they can accumulate in water and in living organisms. Because of this, the use of DDT is now banned in most industrialised countries, although it is still used in some developing ones as it is a cheap and effective pesticide. Toxic inorganic substances include salts of the metals copper, silver, lead, gold, nickel, chromium, zinc, cadmium and mercury, and the metalloid arsenic. Many of these are toxic even at low concentrations: less than 1mg l-1. Most are wastes from industrial processes or mining (Figure 9).
2.5 Heat
Heat has two main effects. As mentioned when discussing natural organic pollutants, a rise in temperature brings about a decrease in the amount of oxygen dissolved in the water. At the same time, a rise in temperature increases the metabolic rate of organisms and therefore their demand for oxygen.
Heat can also cause fish to spawn and hatch out of season and to alter their migration patterns. To avoid such problems, when heated water is returned to rivers after being used for cooling (in power stations, for example), there should always be a minimum flow in the river to dissipate the heat sufficiently and so keep the temperature rise to only a few degrees.
3 The extent of water pollution
Water may become polluted by discharges (e.g. from sewage works or industry), overland flow (e.g. from farmland) or incidents (e.g. rupture of a farm slurry tank).We will start by looking at surface water pollution, then consider groundwater pollution.
3.1 Surface water
River water quality is important because rivers are a major source of water used for drinking and by industry. Rivers also support a wide variety of wildlife and in some areas of the world are used extensively for recreation. Chemical and biological quality is affected by the management of abstractions from rivers and groundwaters and how effluent returns to them, and by the design and maintenance of navigation and flood control measures.
In the UK, discharges into surface waters require the consent of the pollution control authority: the Environment Agency (EA) in England and Wales, the Scottish Environment Protection Agency (SEPA) in Scotland and the Northern Ireland Environment Agency of the Department of Agriculture, Environment and Rural Affairs in Northern Ireland.
River water quality is one of the UK government's headline indicators of sustainable development. These are a 'quality of life barometer' measuring everyday concerns like housing development, health, jobs, air quality, educational achievement, wildlife and economic prosperity. The indicators provide an overview of national progress towards a more sustainable economy, society and environment. The SDIs are used as a means of assessing whether the nation as a whole is developing sustainably, and as a means for policy-makers to identify more sustainable policy options (DEFRA, 2013). River water quality is measured by indicators of chemical quality and biological quality. In England, Wales and Northern Ireland, three measurements are used for the chemical quality classification of river water: BOD, dissolved oxygen and ammonia. In Scotland, iron and pH are also included. Biological testing provides a more comprehensive picture of the health of rivers and canals, and is based on the monitoring of tiny animals which live in or on the bed of the river. Species groups recorded at a site are compared with those which would be expected to be present in the absence of pollution, allowing for different environmental characteristics in different parts of the country.
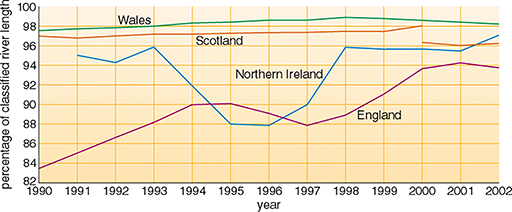
Table 2 gives chemical quality data for the rivers in the UK in 2002. Overall for the UK, it is estimated that about 95% of rivers were of good or fair chemical quality in 2002. These estimates are approximate because the classification scheme in Scotland differs from that in England, Wales and Northern Ireland. There has been an improvement in the proportion of rivers of good or fair quality in the UK since 1990 (Figure 10). This conclusion is based on a comparison of the trends for individual countries—an exact percentage change cannot be given because of changes both in monitoring methods and the monitored river networks through the period. Regional variations in England and Wales are illustrated in more detail in Figure 11.
| % of classified river length | Total river lengths classified/km | ||||
| Good | Fair | Poor/Bad | |||
| England | 65 | 28 | 6 | 36 170 | |
| Wales | 92 | 6 | 2 | 4570 | |
| Northern Ireland | 55 | 42 | 4 | 4130 | |
| Scotland | 86 | 10 | 4 | 25440 | |

In 2002, approximately 95% of the UK's river network was classified as being of good or fair biological quality (Table 3). Between 1990 and 2002, the biological quality of rivers improved in England. In Wales almost all rivers are of good or fair quality. The river length used for biological monitoring in Northern Ireland was more than doubled between 1995 and 2000 and there was a fall in river length of good quality. In Scotland biological quality is generally high, but changes in monitoring and network definitions mean it is difficult to draw conclusions about trends.
| % of classified river length | Total river lengths classified/km | ||||
| Good | Fair | Poor/Bad | |||
| England | 68 | 27 | 5 | 33 500 | |
| Wales | 78 | 21 | 1 | 4 380 | |
| Northern Ireland | 57 | 40 | 3 | 5140 | |
| Scotland | 86 | 11 | 3 | 8 610 | |
Although there has been a general improvement in river water quality in England and Wales between 1990 and 2002, before this, between 1980 and 1990, there was a general deterioration of water quality. This deterioration was caused by a combination of greater discharges from sewage works, industry and farms, overland flow from farmland, and two years of low rainfall and hot summers. In the south-west, intensive agriculture was the main cause, producing large quantities of animal slurry and silage effluent. Drought and pollution from sewage works were the main causes in the Thames area. In contrast, river quality surveys before 1980 showed a gradual improvement: the Thames is an appropriate example of this (Box 3).
Box 3 The River Thames: pollution, cleanup, pollution, cleanup
The River Thames in London has had a history of pollution problems.
Before the 19th century, domestic waste from London was collected in cesspools and used as a fertilizer on agricultural land (the origin of the term 'sewage farm'). Water closets began to be introduced in the mid-19th Century, the waste flowing through sewers untreated to the Thames, and with the rise of industrial waste during the Industrial Revolution, which also flowed into the Thames, the river became highly polluted. The smell of the river was so bad that the Houses of Parliament (on the bank of the Thames) became a very unpleasant place to be and, in the best NIMBY ('not in my backyard') tradition, spurred Parliament to pass laws to control discharges to the river. London's sewage was piped downstream of the city where it was discharged, still untreated. This produced some improvement, and by the end of the 19th century the river quality began to improve (Figure 12). A good quality river will have an oxygen level close to 100% saturation—but if a river is polluted, oxygen in the water will be used in the breakdown of organic pollutants (Section 2) and the oxygen concentration will fall. The oxygen in the river in Figure 6, for example, was reduced to about a quarter just downstream of the sewage outfall.
However, by the mid-20th century, increasing population and industrialisation, poor sewage treatment and sewer damage during the Second World War caused pollution of the river to increase, and oxygen was almost absent over a 60 km stretch of the River Thames by the 1950s (Figure 12). This part of the river contained water of very poor quality, and fish were absent. Since the 1950s, however, more extensive and improved treatment of sewage before the effluent is discharged to the river has improved the quality of the water.

Activity 4
From Figure 11, how does the chemical river quality of the river(s) where you live (or if you live outside England and Wales, at the location of the Open University, about 80 km north of London) compare with the average for England or Wales (Table 2)?
Answer
Your answer to this will obviously depend on where you live. Near the OU in Milton Keynes the class of rivers is generally B, good. This compares well with the national average; 65% of English rivers fall into Classes A, B and C in Table 2.
On an international scale, cleaning up polluted rivers or lakes is more complicated when they pass through more than one country. For example, the River Rhine has parts of its catchment in eight countries, and an almost total lack of pollution control resulted in the Rhine being one of the most polluted large rivers in Europe for many years (Box 4).
Box 4 The River Rhine: attempts at international management of pollution
The headwaters of the River Rhine are in the Swiss Alps. It then flows through one of the most industrialised and densely populated areas of the world in Germany, France and the Netherlands. The Rhine river catchment area is 190 000 km2. In the past, countries tended to dump waste into the River Rhine and then leave it to be dealt with by the next country downstream. There are 58 million inhabitants in the highly industrialised Rhine river basin, and their domestic and industrial wastes, often untreated, go into the river. Parts of the Rhine basin are intensively farmed, and fertilizers and agricultural chemicals also add to pollution in the river. The uses are often at odds with each other; for example, the Netherlands needs Rhine water for irrigation, but the high salinity of the Rhine, which can reach 600 mg l-1 at the Germany-Netherlands border, and comes mainly from French potash mines, can make the water unsuitable.
International agreements and cooperation have been necessary to reduce pollution of the river. At the insistence of the Netherlands, which was concerned about increased salinity, France, Germany, Luxembourg, the Netherlands, and Switzerland began discussing arrangements for reducing pollution in the 1950s, and formed the International Commission for the Protection of the Rhine against Pollution (IKSR) in 1953. This was a technical commission, charged with monitoring pollutants. To stem increasing pollution from industrial and municipal sources, the parties to the IKSR signed the Convention for the Protection of the Rhine against Chemical Pollution in 1976. In 1986 they agreed to the Rhine Action Programme, which seeks to produce drinkable water from the Rhine, reduce sediment pollution, and restore the Rhine environment so that aquatic life returns. The IKSR parties agreed to a 50% reduction (from 1985 levels) in the discharge of 30 priority pollutants into the river by 1995, and this was achieved. France, Germany, the Netherlands and Switzerland agreed to share costs of $136 million. In the summer of 1991, the German chemical industry federation agreed to reduce the discharge of toxic chemicals into the Rhine. These international efforts, combined with domestic pollution controls, particularly sewage treatment, have produced measurable benefits: since the early 1970s, concentrations of heavy metals have fallen and biological treatment of organic waste has reduced oxygen depletion and fish deaths.
There has been some success in reducing pollution; metal pollution has declined considerably, mainly due to better industrial sewage treatment. However, so far (2004), international agreements have failed to control some key pollutants; salt pollution is still a problem and desalination would be expensive. Nitrate concentrations, mainly because of heavy fertilizer use, continue to rise, and groundwater in Germany is increasingly contaminated with nitrate and pesticides. There is also the danger of accidental pollution. In 1986 a warehouse full of pesticides caught fire near Basel, Switzerland. The water used to control the fire washed 10 000 tonnes of toxic chemicals into the river, killing fish and other living organisms for several hundred kilometres downstream.
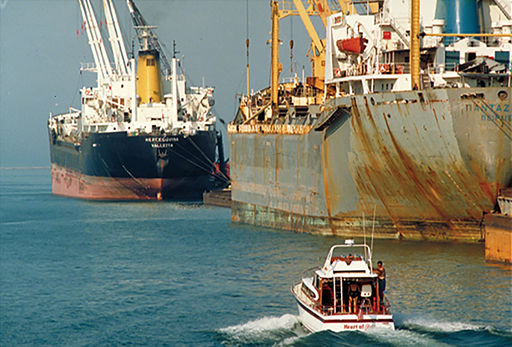
The North American Great Lakes (Figure 13) also have major pollution problems. The Great Lakes are the world's largest freshwater ecosystem, with a catchment area of around 520 000 km2. The lakes are interconnected, and have just one outlet to the sea, through the St Lawrence River to the Atlantic Ocean. They have many uses — as a large freshwater fishery, a source of water and hydroelectric power, transport by shipping (Figure 14), and recreation—and are surrounded by urban, agricultural and industrial development. This vast area falls under the control of eight US states and Canada.
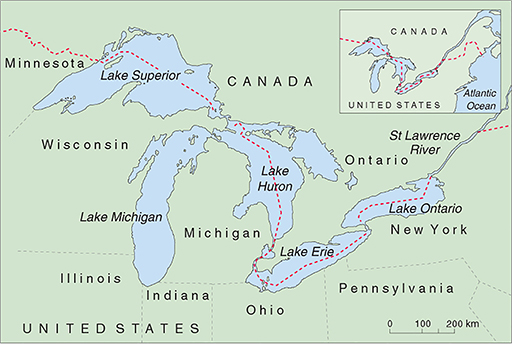
The problems of the Great Lakes began with logging, which polluted the rivers with sawdust, followed by indiscriminate fishing, untreated sewage disposal which caused cholera and typhoid outbreaks in the early part of the 20th Century, and lastly industrial waste disposal that was a particular problem from the 1950s. Lake Erie is bordered by five states, each of which dumped untreated sewage, acid, oil, iron and other industrial waste into the lake; by the 1960s the lake suffered from algal blooms and beaches were covered with rotting algae and dead fish. Many aquatic species became locally extinct and the fishing industry of Lake Erie was destroyed. This crisis provided an impetus for Canada and the USA to reduce sewage and industrial waste-water discharges into the lakes and rivers, but despite these stricter regulations pollution is still a problem. Only about 1% of the water in the system flows out to sea each year, so pollution of the water and in the bottom sediments tends to remain for a long time. Persistent organic chemicals and toxic metallic salts are the biggest problem.
3.2 Groundwater
Pollution is not restricted to surface waters; groundwater can also be polluted. Aquifers are vulnerable to contamination from human activities associated with agriculture, industry and waste disposal, and from chemical spills such as solvents and fuel oils. Pollution can either come from a point source, or from a widespread area of land (for example, agriculture). Once in an aquifer, groundwater pollution is difficult to clean up because it is not easily accessible, flow rates are low and residence times are long, so it may take a long time to disperse pollutants naturally and their effects may continue for a long time.
The only way to protect groundwater from pollution is, therefore, to prevent pollution happening. Protection zones can be established to reduce widespread pollution by restricting potentially polluting activities (as we shall see for nitrate in Section 4). Point discharges can also be controlled. Some of the potentially most polluting point sources are from landfills. Landfills are used to dispose of solid waste from domestic and industrial sources, and are used as they are often the cheapest method of disposal. Landfill waste can be a source of groundwater pollution as they produce leachates, liquids that form as water percolates through the waste, dissolving soluble compounds and the products of chemical and biochemical reactions that have taken place in the waste.
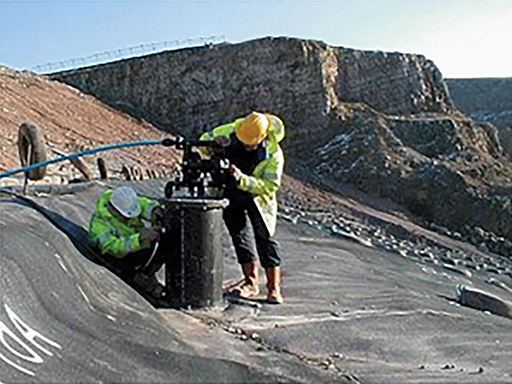
In the past, leachates were allowed to infiltrate into the ground below the landfill and into underlying aquifers where it was diluted by groundwater and gradually dispersed. However, this pollution of groundwater may lead to problems with the quality of groundwater used for water supply, and the practice is now regarded as unacceptable. To prevent the leachate from infiltrating into the ground below a landfill site, a landfill needs to be constructed so that the leachate is contained. The site can be lined with impermeable clay and/or a synthetic membrane, to prevent leachate escaping (Figure 15). The leachate is then collected and treated.
4 Treatment of water supplies
Water quality standards are necessary to ensure that supplies are suitable for use. The quality required depends on the intended use: drinking water, for example, needs quality standards different from those for industrial or irrigation water. The World Health Organisation (WHO) has set guidelines for drinking water (1993), and so has the EU (1998) in Directive 98/83/EC (Table 4a). The standards cover:
- bacteria;
- chemicals such as metals, nitrate and pesticides;
- the way water looks and how it tastes.
However, in many developing countries, which have a piped water supply only in some areas, there are no drinking water standards; water is often taken from the nearest river, and may be of very poor quality, leading to disease. A better source in these areas is pumped groundwater, as groundwater is often less polluted than surface water, but again there is no control on quality.
| Concentration | ||
|---|---|---|
| Guide value/mg l-1 | Maximum acceptable/µgl-1 | |
| Aluminium | 0.2 | |
| Ammonium | 0.5 | |
| Arsenic | 10 | |
| Benzene | 1 | |
| Cadmium | 5 | |
| Calcium | 250 | |
| Chloride | 250 | |
| Copper | 2 | |
| Cyanide | 50 | |
| Fluoride | 1.5 | |
| Iron | 0.2 | |
| Lead | 10 | |
| Mercury | 1 | |
| Nitrate | 50 | |
| pesticides, individual | 0.1 | |
| pesticides, total | 0.5 | |
| Sodium | 200 | |
| Sulphate | 250 | |
| Other parameters | ||
| pH range | 6.5-9.5 | |
| Coliforms | none | |
| Clostridium | none | |
| The full standards include many other substances not listed here. 1 mg 1-1= 1000 µg l -1; 1 mg 1-1= 1 ppm; | ||
Activity 5
This activity looks at the chemical composition of bottled drinking water. Bottled waters are often described on the label as mineral waters, a scientifically inappropriate term, as the scientific meaning of mineral water is high-TDS groundwater, which would not be suitable for drinking. Bottled water is perhaps surprisingly not subject to the general EU Drinking Water Directive, but has its own directive.
- a.Examine the label of any bottled water you have at home (or visit a shop to examine the label of such a bottle) and write down the dissolved substances it contains, with their concentrations (EU regulations require bottled waters to give this on their labels).
- b.Compare your list with the EU drinking water standards in Table 4. Does your bottled water exceed the EU guide values or maximum acceptable concentrations for any dissolved substance in drinking water?
Answer
| Concentration of dissolved substances/mg l-1 | ||
|---|---|---|
| Buxton | Perthshire | |
| aluminium | 0 | |
| bicarbonate | 248 | 128 |
| calcium | 55 | 27 |
| chloride | 42 | 9 |
| iron | 0 | |
| magnesium | 519 | 9 |
| nitrate | less than 0.1 | 1 |
| potassium | 1 | 0.6 |
| sodium | 24 | 6 |
| sulphate | 23 | 6 |
| TDS | 280 | 128 |
| p H | 7.4 | |
- I had two different types of bottled water at home: 'Buxton Carbonated Natural Mineral Water' and 'Mountain Spring Natural Mineral Water, Perthshire'.
- Neither of the bottles breaches the EU guidelines for the substances listed in Table 4a.
The quality of the water required for industrial processes depends on the process so there is no general set of standards for industrial water equivalent to the standards for drinking water. High-pressure boilers require water of the highest quality, with more rigorous standards than for drinking water, whereas low-quality water, such as seawater, is usually adequate for cooling.
There are also no general standards for irrigation water; but there are three main quality criteria, as given below:
The maximum TDS of water that can be used for irrigation is usually 3000 mg l-1, but this is not a precise limit, as different crops have different salt tolerances. Few fruit trees, for example, will tolerate much salt (2500 mg l-1 is usually the limit), vegetables and most cereals have a moderate salt tolerance (3500 mg l-1), and grasses, cotton and date palms have a high tolerance (6000 mg l-1).
Water with a higher sodium concentration than the combined calcium and magnesium concentrations is also generally unsuitable as it may damage the soil structure. The sodium ions can replace calcium and magnesium ions in the soil, which reduces the permeability, and the soil will be sticky when wet and very hard when dry.
Toxic substances, if present in more than very small quantities in irrigation water, will prevent plant growth. For example, a concentration of more than about 1mgl-1 of the element boron will restrict growth.
4.1 Water treatment processes
The quality of public water supplies can be improved by water treatment, and this may be necessary before water from a particular source can be used. The most common treatment processes, in sequence, are:
Screening: Debris such as leaves and plant fragments are removed by passing the water through a series of coarse metal screens.
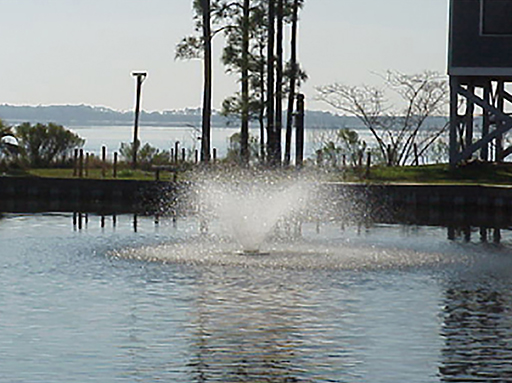
Settling and oxidising: The water is then stored in a reservoir (or settling pond), so that sediments and some of the organic particles that escaped the straining process settle on the bottom, and the bacteria (which are all too small to be removed by straining) gradually die. Storage has the disadvantages that the reservoirs required use a lot of land, and algae may grow in the water because of a build-up of nitrates. Other organic impurities, which can give a taste or odour to the water, are oxidised in the upper layers of the reservoir. Water sprays, rather like fountains, are often used to aerate the water (Figure 16) so that the concentration of dissolved oxygen in the water is increased. Thus organic impurities can be oxidised to harmless substances, and some dissolved metal ions are oxidised to give insoluble compounds that can then be filtered out of the water.
Flocculation: Even after straining and storage, raw water may contain considerable quantities of suspended matter. Most of this consists of colloidal matter (which is matter about 10-8 m in diameter in a form between solution and particulate form, and having negative electric charges).
The colloidal matter can be reduced by filtration; but if there is a considerable quantity, it is usually more economic to make it flocculate. (The colloidal particles are neutralised by adding a chemical to the water that has the opposite charge to the colloidal particles. The particles then coalesce into bigger particles and sink out of the water.)
Filtration: Filtration through sand and gravel then removes any fine particles of suspended matter and small organisms (mostly less than about 6 × 10⁻⁵ m in diameter) that still remain. In addition, algae and bacteria develop on and below the surface of the sand, where they decompose organic matter in the water passing through and digest some of the nitrates, phosphates and carbon dioxide dissolved in it, thus further purifying the water.
pH correction: The EU guideline for the pH of drinking water is 6.5-9.5 (Table 4a); this range was chosen because more acidic water might dissolve metal pipes in the distribution system and more alkaline water might leave salt deposits in the pipes. In the UK it is often necessary to add an alkali such as lime to water with a low pH, especially the water from peaty upland areas.
Disinfection: The final treated water should contain no pathogenic bacteria, so the water must be disinfected. In the UK the most common method of disinfection is the use of chlorine (occasionally you may notice a slight smell of chlorine in your tap water). It is a method that has been used extensively for over 70 years. Water companies have to ensure that enough chlorine remains in the water after it leaves the treatment works to help keep the water safe on its journey to the tap. Other forms of disinfection include ozone and ultraviolet light, but these do not remain in the water during distribution, so in both cases a small amount of chlorine is added before the water goes into the distribution system. Disinfection is not very effective against parasites such as Cryptosporidium and Giardia (which can cause illnesses with severe diarrhoea lasting a number of weeks). If there is a risk of these being present they must be removed during the filtration stage of treatment.
Some waters require more specialised treatments which are expensive, such as:
Ion exchange: This process is used to remove nitrate from groundwater (Box 5), and in some cases to soften water. Ion exchange is very similar to the process used in domestic water softeners, where water is passed through a bed of special resin particles.
Activated carbon: Activated carbon, often in association with ozone, is used to remove organic substances. Some of these substances occur naturally and others are contaminants, such as pesticides, that occur because of human activities. The ozone breaks down the organic substances, which are then adsorbed on the surface of the carbon.
Softening: Excessive hardness of water is usually reduced ('softened') by precipitation or by the exchange of ions brought about by adding appropriate chemicals.
Most developing countries, however, not only cannot afford to disinfect their water, but outside the main towns often have no piped water to disinfect. Every year, millions of people, particularly children, die of diarrhoea infections carried by contaminated water.
Box 5 Nitrate in drinking water
Intensive farming has caused the nitrate concentration in surface water and groundwater in some areas to increase. In parts of the UK it is now above the EU guide value of 50 mg l-1 (Table 4a).
There is concern that human health may be affected if these high-nitrate waters are used for drinking water. The nitrate comes from:
High levels of fertilizer used in intensive farming to obtain high cereal yields. Some of the nitrogen in the fertilizer may not be taken up by the crop, and then may be leached from the soil, or infiltrate into groundwater.
Spreading large quantities of manure or slurry on farmland from intensive stock-rearing.
Effluent discharges from some sewage works, and the use of sewage sludge on farmland (Section 5).
The first two bullet points mean that all major intensively farmed areas are affected, particularly the cereal-growing areas of northern Europe and the USA, and the stock-rearing parts of northern Europe (Brittany, the Netherlands and Denmark).
To reduce nitrate concentrations by water treatment methods requires ion exchange or biological denitrification. Both are very expensive procedures. Other 'lateral' approaches are being used instead:
Finding alternative sources of water—closing some boreholes and opening new, low-nitrate ones.
Blending (diluting) high-nitrate water with that from a low-nitrate source.
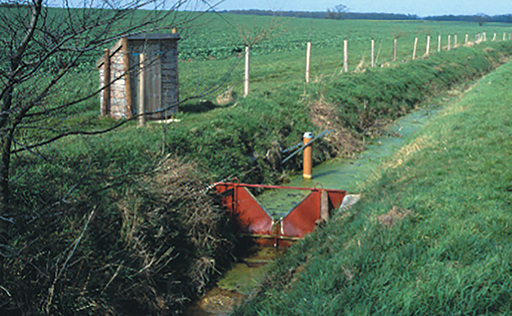
Reducing the inputs of nitrate into water, by using government legislation to reduce the use of fertilizers, manure and slurry in designated areas, called Nitrate Vulnerable Zones in the EU. In these zones there are compulsory restrictions to reduce nitrate leaching from the soil, encouraging farmers to change their farming operations to less intensive ones, such as switching from cereals to grassland or using buffer strips (Figure 17).
Groundwater seldom requires much treatment, mainly because aquifers are efficient natural filters; disinfection is usually enough. Surface water, however, presents more problems. Unpolluted river water may require straining, storage, aeration, filtration and disinfection. If the source of raw water is a poorer quality river, these treatments may have to be repeated several times. Amsterdam, for example, has the misfortune to be at the downstream end of the Rhine. To make the poor quality Rhine water palatable it is successively aerated, filtered, aerated, disinfected, aerated, filtered, stored, aerated, filtered, aerated and disinfected again. Although it may be safe to drink after all this treatment, it still occasionally tastes awful!
The Amsterdam water is river water that has been used many times on its way to the sea, as is the water from the Thames used by London. The quality of such recycled water depends on the efficiency of the sewage treatment, and in the next section we look at the processes involved.
Activity 6
Table 5 gives the chemical compositions of a natural water. Would the water in Table 5 be a suitable source of water for (1) an EU public water supply, or (2) irrigation?
| Concentration/mg l-1 | |
| bicarbonate | 50 |
| Calcium | 5 |
| Chloride | 4 |
| Iron | 0.1 |
| Magnesium | 1 |
| Potassium | 4 |
| Silica | 135 |
| Sodium | 28 |
| Sulphate | 8 |
| TDS | 242 |
| p H | 7.6 |
Answer
a.The EU standards in Table 4a suggest that the water is suitable for a public water supply as far as indicated for the substances listed in Table 4a (but this is not the full list). However, the water may have to be treated to reduce any organic pollutants (not given in Table 5).
b.The water is unsuitable for irrigation as the sodium concentration is much greater than the combined calcium and magnesium concentrations.
5 Sewage treatment
Sewage treatment has two main aims: to control the spread of disease, by isolating the sewage so that viruses and other pathogens die, and to break down the sewage into relatively harmless substances to protect the environment into which it is discharged. In the UK around 97% of the population are connected to waste water treatment works by sewers, but this is very different on a global scale. In developing countries the figure is less than 5%; most of the urban sewage is discharged into surface waters without any form of treatment. Many cities in developing countries lack sewer systems, let alone treatment plants. Sewage is often drained into rivers or lakes that may also be used as water sources— with obvious problems for health. For many developing countries, contaminated water containing bacteria, parasites and viruses derived from human waste is a major cause of death.
Communities situated on coasts commonly discharge untreated sewage into the sea. This is an acceptable method of disposal if the outfall is far enough offshore, if currents do not bring the sewage back to land, and if the discharge is not too great. In these circumstances, the organic matter can be broken down by bacteria in the sea. Sea discharges are not always satisfactory, and a few of England’s beaches, for example, still breach the EU Directive on bathing water quality. However, by 2018, 97.7% of England’s beaches met at least the minimum standard of the Bathing Water Quality Directive (DEFRA, 2018).
In inland areas of industrialised countries, sewage is usually treated to reduce the amount of oxygen-consuming organic material before it is discharged into lakes or rivers. Sewage treatment aims to reduce biodegradable material and material in suspension, remove toxic materials and eliminate pathogenic bacteria. It converts sewage into a liquid effluent, mainly water, leaving behind a sludge. The discharge of effluent to streams and rivers in the UK is controlled through a system of discharge consents by the EA, SEPA and the EHS. These limit the total volume, the BOD and the suspended solid concentration. There is no fixed standard, as the character and use of rivers varies greatly; for example, if a small quantity of effluent is discharged into a river with a high capacity for self-purification, it may be harmless provided the effluent is not toxic. Effluents from industry often have to conform to additional standards, which may include limits on water temperature or content of toxic substances.
5.1 Sewage treatment processes
The processes at a sewage treatment works are relatively simple, and mostly mimic natural processes. Not all treatment works use all the treatment stages — some plants provide only preliminary and primary treatment, and tertiary treatment is relatively rare. The processes are summarised in Figure 18 and amplified below:
Preliminary treatment: This is the mechanical removal of coarse and fine solid material. The sewage passes through screens, which trap pieces of wood, rags, wire, etc. The extracted material is usually buried, but it may be burned.
Primary treatment: The sewage then flows slowly through grit tanks, where particles of sand or grit settle out. Fine particles still remain suspended in the sewage, so it is passed to large primary sedimentation tanks where most of the remaining particles settle out to form a sludge. Primary treatment removes about 60-70% of suspended solids (Table 6). The liquid leaving the primary sedimentation tanks still contains very fine solids and dissolved matter, so secondary treatment is usually required.
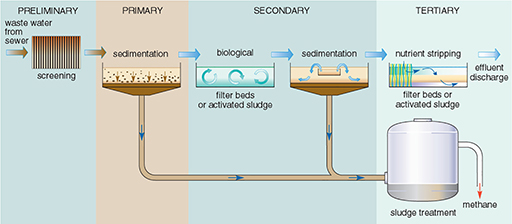 Figure 18 Flow diagram of the stages of treatment in a sewage treatment plant.
| Constituent | Primary | Secondary | Tertiary |
| suspended solids | 60-70 | 80-95 | 90-95 |
| BOD | 20-40 | 70-90 | >95 |
| phosphorus | 10-30 | 20-40 | 85-97 |
| nitrogen | 10-20 | 20-40 | 20-40 |
| E. coli bacteria | 60-90 | 90-99 | >99 |
| viruses | 30-70 | 90-99 | >99 |
| cadmium and zinc | 5-20 | 20-40 | 40-60 |
| copper, lead and chromium | 40-60 | 70-90 | 80-89 |
Secondary treatment: This is a biological process, involving the oxidation of dissolved organic material by micro-organisms to decompose the organic compounds, a process similar to that taking place in rivers, the soil, or filter beds in water treatment works. The process is speeded up by increasing the amount of oxygen available, which can be done by two possible methods:
Filter beds: The liquid is sprayed slowly over beds of broken stones, gravel, coke or plastic (Figure 19), which provide a large surface area for oxidation, and the micro-organisms (mainly bacteria) living within the filter bed break down the organic matter. The liquid that collects at the base of the filter bed contains some waste products from the filter organisms. These are separated from the effluent in secondary sedimentation tanks, producing more sludge. Filter beds need very little supervision, but take up a lot of land.
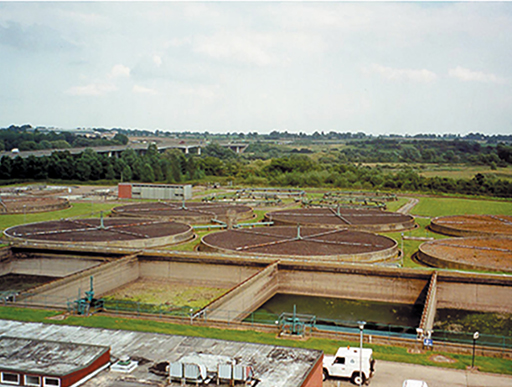 Figure 19 Filter beds at a waste water treatment plant. Rotating arms spray sewage onto the circular beds, where it is broken down by bacteria.
Activated sludge: A sludge containing bacteria and other organisms is mixed with the liquid, and the whole mixture is agitated by paddles or has compressed air bubbles through it, to keep it well oxygenated. This process lasts about 10 hours, after which the mixture flows to sedimentation tanks where the sludge settles out from the effluent.
Secondary treatment in addition to primary treatment removes about 70-90% of the BOD in the sewage (Table 6), so the effluent is usually sufficiently purified to be discharged to a river, lake or the sea.
Tertiary treatment: Primary and secondary treatment remove only 20-40% of the phosphorus and nitrogen, and about half of the toxic compounds. If it is necessary to reduce plant nutrients or toxic compounds beyond these levels tertiary treatment is required, but this is very expensive and not commonly used. Various types of tertiary treatment exist, e.g. nutrient stripping, disinfection by UV light or filter membranes. Where land area is available, allowing the effluent to flow through constructed ponds or lagoons is another option.
5.2 Sludge disposal
What to do with the remaining sludge is more of a problem. Sludge is a nasty smelling, thick liquid, about 96% water, and sewage treatment plants have to dispose of vast quantities of it — a large plant will produce over a thousand tonnes each day. Before final disposal, sludge is sometimes held in closed tanks (Figure 18), where, in the absence of oxygen, anaerobic bacteria further decompose the organic material, producing a relatively inoffensive digested sludge. The anaerobic digestion process takes 20 to 30 days at a temperature of around 30 °C. The gases methane and carbon dioxide are produced, and the methane can be used as a fuel to heat the tanks or to generate electricity for the treatment works. There are three main methods of sludge disposal. A fourth option, dumping at sea, is no longer considered acceptable because of the environmental impact and has been banned in many parts of the world including the EU. The three options are:
Farmland: Sludge disposal on agricultural land is useful as a fertilizer and soil conditioner and it is a more convenient method of sludge disposal for sewage works that are not on the coast. Tankers are used to transport the large volumes of sludge to farms. The UK disposes of much of its sludge by this method.
Landfill: Not all sludge is suitable for farmland. For example, sludge containing toxic waste cannot be spread on fields. Instead it is dumped in natural or artificial depressions in the ground or in trenches, where it dries and decomposes slowly (and may cause unpleasant smells), and covered with a layer of soil.
Incineration: Sludge may be dried and incinerated, leaving an inert ash. This is often the most expensive option.
6 What do you know about your water supply?
It could be claimed that water is probably the most important physical resource that we use. We often take its presence for granted in the UK: for most of us it arrives painlessly in our home out of a tap and we can easily dispose of it by pouring or flushing it away. However, how much do you really know about your own water supply and sewage disposal? Are you drinking groundwater or river water? Is it recycled? What is its quality? Where does your sewage go? How much does it cost you? In the next activity you will consider all these questions.
Activity 7
To answer some of these questions you may need to contact your water supply and sewage disposal company.
- Do you have a piped water supply? (1% or so of homes in the UK do not.)
- What is the source of your water? Perhaps there are several sources. (Does it come from a reservoir, a river, groundwater or a combination?)
- Where is your local water treatment works for water supply and what processes does it use?
- What is the chemical analysis of your water? Are there any particularly high concentrations, over or near EU limits?
- Do you have a water meter?
- What was the cost per person for water supply to your home last year?
- Is your home connected to sewers, or do you have a septic tank or cesspit?
- If your home is connected to sewers, where is your local waste water treatment works and what processes take place there?
- How does the waste water treatment works dispose of the effluent (into which river, lake, or sea) and the sludge (farmland, landfill or incineration)?
- What was the cost per person for sewage disposal from your home last year?
Answer
There is obviously no single answer to this question! It will vary depending on where you live. Below I have given the answers for my house (which is in a small village to the south of Milton Keynes) so you can see the type of answer that could be given.
- Yes, my house has a piped water supply (and life would be very difficult without it).
- I had to telephone my local water company to check on this: although I thought I knew the answer it proved to be more complicated than I expected. I live on a good sandstone aquifer (the Cretaceous Lower Greensand) and expected my water supply to be just groundwater from local boreholes. However, although part of the supply comes from two local boreholes, this water is linked in a water grid to other parts of my water company region, so my local borehole water is blended with that from two major lowland reservoirs, Rutland Water and Grafham Water, 100 km and 60 km away. I presume this is for security of supply and quality purposes.
- Again, I had to ask the water company. The borehole water is just filtered and disinfected, but the reservoir water is screened, stored, settled, filtered and disinfected.
In England and Wales you can get this information from your water company on request. I was sent an analysis for my water supply which showed it to be within the EU limits (Table 4, Section 4) except for iron, which had a mean concentration of 0.1 mg l-1 and a maximum of 0.42 mg l-1, whereas the EU recommended maximum is 0.2mg l-1.
The water analysis was for a total of 101 different parameters (many more than in Table 4) and I was also sent the full prescribed concentration list from which I was able to work out that my supply breached regulations additionally for manganese, nitrite, pesticides and phosphorus.
I found the high iron concentration unsurprising, as the sandstone aquifer supplying most of my water has a high concentration of iron. The high nitrite, phosphorus and pesticide values are in the reservoir water, and could be caused by agricultural runoff.
- I had a water meter installed in 1992, having calculated that it would save money on water bills to my house, and in the hope that it would also provide encouragement for me to use less water (it has).
For 2003 I used a metered 64m3 of water at £1.13 per m3, which cost £1.13 × 64 = £72.32.

- My house is connected to a sewer.
- I knew the answer to part of this — that my village has its own small sewage works for primary and secondary treatment — but not the full story. My water company told me that the effluent is discharged to our local small river (the Ouzel) but the sludge is tankered 10 km to the major sewage works in Milton Keynes for further treatment: anaerobic digestion. The digested sludge is then spread on farmland.
The cost is £1.86 per m3, taken as 90% of the water supplied (as sewerage is not metered). So

Conclusion
This free course, Understanding water quality, provided an introduction to studying Environment & Development. It described the main characteristics of natural water and how these may be altered by pollutants of various types. The course also outlined the key stages of treatment for water supply and for treating waste water in sewage treatment works.
In this course you have learned that:
- Pollution is a deterioration of water quality caused by human agencies that makes the water less suitable for use than it was originally. Water does not have to be completely pure to be considered unpolluted.
- Natural waters are not completely pure. Rainwater contains dissolved salts in relative proportions similar to those in seawater, but over a thousand times less concentrated. Rainwater contains a greater relative proportion of dissolved gases, particularly carbon dioxide, than seawater, and this makes it slightly acidic. River water has a composition different from both rainwater and seawater; it has a greater concentration of dissolved solids (TDS) than rainwater, and may contain suspended solids. Groundwater usually has slightly greater TDS values than surface water, and varies in composition, depending on the rocks through which it has passed. The TDS value of groundwater depends on the length of time the water has been in contact with rock, so slow-moving, deeper groundwater has a higher TDS value.
- Pollution can come from many different sources, including domestic sewage, farms, industry, mining, quarrying and cooling. There are many types of pollutants, including natural organic materials, living organisms, plant nutrients, organic and inorganic chemicals, sediments and heat.
- Water often has to be treated before it is of suitable quality for use. The quality needed depends on the use to which the water is to be put; quality standards for public water supplies are set by the WHO, the EU and some individual countries; but the quality required for industrial water and irrigation water can vary.
- Sewage treatment aims to reduce the amount of organic and suspended solid material present, remove toxic materials and eliminate pathogenic bacteria, mainly by settlement or biological processes. The effluent is discharged into rivers, lakes or the sea, and the remaining sludge may be dumped at sea (but not in the EU), disposed of on farmland, dumped in landfills or incinerated.
References
Acknowledgements
Course image: Jon Eby in Flickr made available under Creative Commons Attribution-NonCommercial-ShareAlike 2.0 Licence.
Grateful acknowledgement is made to the following sources for permission to reproduce material in this course:
The material acknowledged below is Proprietary and used under licence (not subject to Creative Commons Licence). See Terms and Conditions.
Figure 1:Arthur Trees/Science Photo Library
Figure 4: Roman Baths, Bath and NE Somerset Council
Figure 5: Richard Hamilton-Smith/Corbis
Figure 8: Copyright © Owen Mountford/Centre for Ecology and Hydrology
Figure 9: Dr Peter Webb, The Open University
Figure 10: Crown copyright material is reproduced under Class Licence Number C01W0000065 with the permission of the Controller of HMSO and the Queens Printer for Scotland
Figure 11: Copyright ©Environment Agency; Figure 5.12 Sir Frederick Warner (1994) Conference Paper No. 4, Industry and Society, HRH The Duke of Edinburghs Study Conference, July 1994
Figure 14: David Riecks, Illinois-Indiana Sea Great: courtesy Visualizing the Great Lakes www.epa.gov/ ginpo/ image
Figure 15: Race Engineering, North Wales
Figure 16: Environmental Consulting Associates, USA
Figure 17: Peter Leeds-Harrison, Cranfield University
Figure 18: Davie, T. (2002) Fundamentals of Hydrology, Routledge
Figure 19: Courtesy of the Environment Agency
All other material contained within this course originated at the Open University
This resource was created by the Open University and released in OpenLearn as part of the 'C-change in GEES' project exploring the open licensing of climate change and sustainability resources in the Geography, Earth and Environmental Sciences. The C-change in GEES project was funded by HEFCE as part of the JISC/HE Academy UKOER programme and coordinated by the GEES Subject Centre.
Don't miss out:
If reading this text has inspired you to learn more, you may be interested in joining the millions of people who discover our free learning resources and qualifications by visiting The Open University - www.open.edu/ openlearn/ free-courses