Animals at the extremes: Hibernation and torpor
Use 'Print preview' to check the number of pages and printer settings.
Print functionality varies between browsers.
Printable page generated Sunday, 5 May 2024, 12:31 AM
Animals at the extremes: Hibernation and torpor
Introduction
This is the second in a series of three courses on Animals at the extremes. In order to get the most from it, you should have previously studied Animals at the extremes: The desert environment (S324_1). After completing this course you might like to complete the series by studying Animals at the extremes: Polar biology (S324_3).
This OpenLearn course provides a sample of Level 3 study in Science.
Learning outcomes
After studying this course, you should be able to:
define and use, or recognise definitions and applications of, each of the bold terms
give definitions of the terms ‘hibernation’, ‘torpor’ and ‘adaptive hypothermia’, and the three physiological processes that underlie them
give examples of the diversity of the major groups of mammals and birds that contain hibernating species
describe the physiological changes occurring during entry to hibernation and at least three of the cues that may trigger entry
present evidence to show that hibernating mammals and birds retain physiological control of their Tb.
1 Hibernation and torpor: An introduction
This course examines hibernation, a special form of adaptation that animals can make to the ecological demands of remaining in a chosen habitat in winter. Hibernation is a state which enables energy-efficient survival when ambient temperatures are so low that foraging or simply maintaining normal core body temperature and basal metabolic rate are either energetically too costly or impossible.
Polar endotherms can maintain a high T b even when living actively at sub-zero temperatures. Such animals have very good thermal insulation and may have a plentiful food supply to sustain the increased thermogenesis needed to maintain a large difference between T a and T b. For many animals, however, the food supply in a cold environment becomes scarce or inaccessible beneath snow or ice.
Question 1
What are the options for surviving a very cold winter?
Answer
To remain active. This strategy is possible for an animal with appropriate insulation, considerable energy reserves and the ability to compete successfully for a continuing food source. The arctic fox and the emperor penguin are examples of such animals.
To migrate to another habitat for the duration of an inhospitably cold season. This strategy is possible if the animal has sufficient mobility to leave the extreme latitudes as the available food dwindles. Many birds and bats adopt this strategy.
To endure the periods of low temperature extremes in the chosen habitat at low metabolic cost – by reducing T b, locomotion and other life functions at all levels. The use of this approach, to varying extents, is seen in a huge and diverse group of birds and mammals. It has also been adopted by poikilothermic vertebrates and invertebrates, though often for different reasons.
Option 3 is adaptive hypothermia, as seen in torpor and hibernation. Small homeotherms living at latitudes (or altitudes) at which they experience long periods of cold weather and lack of solar radiation have few options. Consider the problems a small animal is likely to encounter compared with a large one. It has a relatively high surface area to volume ratio and therefore a high potential for heat loss: even at moderate T a, it normally has a high metabolic rate and cannot carry enough really effective insulation, whether of fur, feathers or blubber. Some species can survive in burrows if they can emerge regularly and find enough plant material to eat beneath the snow, but even these animals are likely to use energy-conserving strategies for much of the time. Thus, small rodents and insectivores, for example, have little choice but to exploit option (iii) above, uncoupling their homeothermic mechanisms or resetting the critical body temperature (Tc): in other words adaptive hypothermia.
Thermal adaptation in animals overcomes the ecological and bioenergetic constraints of living in extreme climates. For warm-blooded vertebrates, evolution has generated almost every imaginable approach to this problem, and the adaptations adopted for each species reflect different approaches to the evolutionary cost-benefit analysis of variations on conventional endothermy. Whilst most hibernating endotherms lower the temperature of all or parts of their bodies by between 5 and 25° C, many ectotherms and some mammals are characterized by their ability to depress their T b to below the freezing point of water. In either situation, physiological adaptations must include:
thermoregulatory systems with control mechanisms different from, or with the ability to override, those which operate in the seasons when the animal is euthermic;
biochemical and cellular control mechanisms capable of protecting tissues against damage, and compensating for energetic and metabolic disadvantages which are manifested at low body temperatures.
The terminology used to describe the different forms in which adaptive hypothermia is observed in animals is complicated. However, it is best viewed as a way of identifying a more or less persistent entry into a state of sustained physiological depression and metabolic dormancy. A source of clear definitions which is reasonably contemporary at the date of writing is provided by Körtner and Geiser (2000).
Torpor is best defined as entry of the whole animal into a state of hypothermia which is accompanied by behavioural inactivity, regulated by a combination of external and internal signals. Hibernation is defined as a sustained and profound state of torpor, entry to and exit from which is governed by internal signals together with exclusively seasonal external cues.
We can place the methods of reducing body temperature for the purpose of energy saving into the hierarchy below:
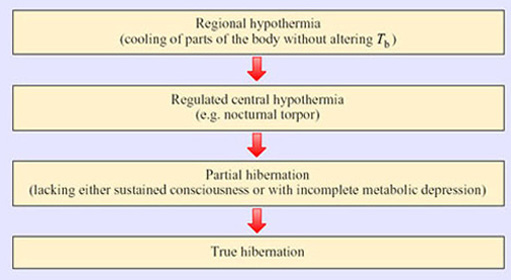
True hibernators undergo three definitive and coordinated physiological changes:
Thermal dormancy – the ability of an animal to operate its biological functions at very low core body temperatures.
Behavioural suppression – the cessation of activity of many muscles, which depends upon the ability of the brain to override sensory inputs and endogenous rhythms such as breathing.
Metabolic inhibition – the ability of an animal to undergo episodic bradymetabolic changes: the depression of energy-related and anabolic reactions.
Adaptation to climatic extremes affects organisms at several levels. In plants, which have little coordination at the level of systems, physiological adaptations to extreme heat, cold and dehydration can occur just as they do in animals that have such control. Adaptation is manifested not only at the level of tissue and organ systems but also at the level of genes, proteins, protein complexes and cells. Many of the fundamental responses to hypothermic extremes mirror those seen in aestivation – a state of torpor seen in some ectotherms adapting to arid rather than cold conditions. In both hibernation and aestivation, further adaptations can be seen at the level of cells and tissues: the existence of protective measures that enable rapid recovery from very cold temperatures, lack of oxygen and low energy supplies.
Question 2
What protective measures might be required to keep cells alive during periods of torpor?
Answer
Such protective measures might include: prevention from freezing of the cytosol and organelles; maintenance of life functions in the absence of oxygen or energy-yielding substrates; delay or neutralization of processes which normally eliminate dying cells that may harm tissues if they remain.
Almost all hibernating animals prepare during the summer and autumn seasons by eating large amounts of food that they convert into fat, providing additional energy stores. Cellular metabolic processes are linked to a central regulatory mechanism, an ‘internal clock’, that provides the reference point for entering hibernation and when to resume normal behaviour.
Apart from occasional periods of arousal to forage and excrete, hibernating animals are inactive for several months on end. During this period, the lack of food and water means that physiological processes, blood and cellular biochemistry undergo major changes. Animals may be inactive for shorter periods toward the end of hibernation periods, as they emerge to access signals (e.g. light levels, T a) which trigger the switch to normal activity. Environmental signals are integrated in the brain, pineal gland and other centres implicated in controlling seasonal changes in physiology and behaviour.
The annual cycle that governs entry into and exit from hibernation is also under the control of internal physiological systems. For example, as the bodies of hibernating male squirrels return to normal in the spring, a sustained, increased secretion of sex hormones prevents return to hibernation.
Termination of hibernation is highly sensitive to temperature change. In fact, current global upward trends in ambient temperature are having a measurable effect in shortening the hibernation seasons of a number of species, such as the yellow-bellied marmot living in the Rocky mountains of the northwestern USA. Snowfalls have also increased with the changing climate, so that the ground is still covered with snow when the marmots arouse from hibernation (earlier than used to be the case), making food hard to find.
Summary of Section 1
Hibernation is a physiological and behavioural adaptation whose function is to maximize energy efficiency in animals remaining in the same area the whole year round. It is an alternative to the provision of sufficient insulation to remain warm, forage continuously and sustain a constant high metabolic rate.
There are three aspects of coordinated regulation in hibernating or torpid animals: thermal, behavioural and metabolic. They operate independently, at least to some degree, and at the level of the whole organism down to that of individual molecules. There are also adaptations that protect the organism against cell and tissue damage.
Hibernation and torpor are regulated at the level of the whole animal by biological rhythm generators that are adjusted by environmental stimuli which initiate rapid reversal signals at the conclusion of the period of dormancy.
2 The nature and extent of hibernation and torpor in endotherms
2.1 Degrees of torpor
Adaptive hypothermia occurs in at least six distantly related mammalian orders (Table 1) and in several orders of birds. There is a spectrum running from those species which can tolerate a drop in T b by 2° C for a few hours, to the seasonal deep hibernators which maintain a T b as low as 4° C for weeks on end.
| Group | Sub-group (and example) | Comments |
|---|---|---|
| Prototheria | spiny anteater | seasonal |
| Metatheria | Didelphidae (American opossums) | occasional |
| Dasyuridae (insectivorous mice) | occasional | |
| Phalangeridae (possums) | seasonal | |
| Eutheria | Rodentia* (see Table 2) | seasonal (and daily) |
| Primates (dwarf lemurs) | seasonal | |
| Chiroptera* (temperate bats) | seasonal (and daily) | |
| Insectivora* (tenrec, African shrew, golden mole, hedgehog) | seasonal | |
| Carnivora (black bear, brown bear, badger) | seasonal lethargy – not deep hibernation | |
| * Includes native British species. |
Question 3
What characteristics would you expect to find in seasonal hibernators?
Answer
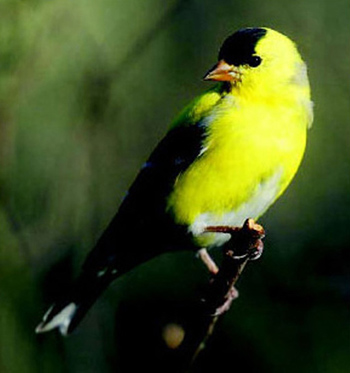
Seasonal (deep) hibernators are likely to be small and to live in an environment where there may be a large difference between T a and T b, and their food is likely to be absent or inaccessible for long periods. Most such animals are herbivorous or insectivorous. Size is a critical factor in the depth of torpor: for example, black and brown bears inhabit the same territory as several deep hibernators, but provided they have shelter, they can manage on stored energy reserves, mainly of fat, for extended periods by lowering their T b by only 2–6° C. The availability of food is another factor: a number of small birds, for example the American goldfinch (Carduelis tristis*; Figure 2) can survive in winter temperatures down to −60° C, remaining active and maintaining T b with a huge (in excess of 500% over summer levels) increase in thermogenesis. However, other species, such as the redpoll (Carduelis flammea), which inhabits the northern United States show, in addition, a nocturnal hypothermic torpor.
If an animal is very small, quite short periods without food may present a problem, and nocturnal hypothermia and torpor can be important for energy conservation. For example, several species of tropical hummingbird undergo nocturnal torpor, even though the difference between T a and T b is not huge.
Note: In this course we make reference to a wide range of species and have given both a common and the scientific name. There is no need to learn these scientific names. They do though allow you to check precisely which species is involved in a study. The same species may have a different common name in different locations. Moreover, one common name may be used for different species in different locations.
2.2 Species showing torpor or deep hibernation
Among the birds, torpor occurs in a number of species in the orders Apodiformes (hummingbirds and swifts), Caprimulgiformes (nightjars, nighthawks, goatsuckers and poor wills) and Coliiformes (mousebirds). In all of the hummingbirds (family Trochilidae) studied to date, torpor, if it occurs, takes place on a daily (or more usually nightly) basis. They are able to re-warm themselves independently of T a and show an increased thermogenesis if T a falls below 18° C during the time when the bird is not searching for food. The tiny rufous hummingbird (Selasphorus rufus; Figure 3), weighing only 3.0–5.5 g, has a summer range in North America that extends to Alaska, but it overwinters in Mexico. While undertaking this huge migration it undergoes overnight torpor, especially when breaking its journey for a few days, feeding on nectar to rebuild its energy reserves.

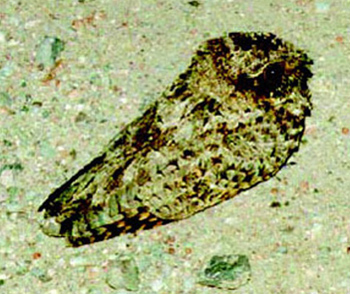
There is no evidence for long periods of unbroken torpor in the hummingbirds. The poor will (Phalaenoptilus nuttalli; Figure 4), which lives in the southern USA, is perhaps the only bird studied so far that shows bouts of torpor at all comparable to those of seasonally hibernating mammals. Poor wills kept in the laboratory at a T a of 1° C without food go into torpor, with a T b of 6° C, from which they arouse spontaneously about once every 4 days, showing an exceptionally large rise in their metabolic rate in the process. The pattern of torpor and change in T b that they undergo in the wild is not known.
Many birds, including doves and pigeons, enter shallow torpor (with the T b falling to about 32° C) when deprived of food. If food is available, the pigeon responds to low T a by a large (up to 55%) increase in basal metabolic rate (BMR). Indeed, a reduction in food supply seems to be a major factor in the induction of torpor in almost all the bird species studied. The white-throated swift (Aeronautes saxatilis) and the mousebird (Colius sp.) can tolerate a T b of −20° C and spontaneously re-warm at low ambient temperatures.
Among mammals, many groups contain species that undergo different degrees of adaptive hypothermia. Of the placental mammals, the largest number of hibernating species is found among rodents (see Table 2 in Section 2.2) and bats. All temperate-zone bats, including the 15 UK species, undergo daily torpor during certain seasons with some species remaining torpid for extended periods, as also does the European hedgehog (Erinaceus europaeus). Another famous example, which was a food valued by the Romans because of its habit of storing fat prior to hibernation, and was the sleepy guest of the Mad Hatter, is the hazel dormouse (Muscardinus avellanarius). Most research on hibernating mammals has focused on bats, hedgehogs, hamsters and in particular, the sciurid rodents (squirrels).
| Family | Examples | Comments |
|---|---|---|
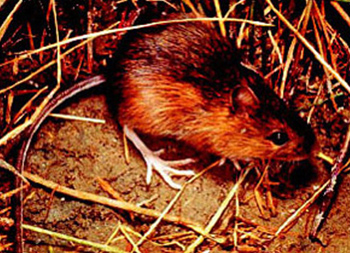
| Zapodidae | meadow jumping mouse, Scandinavian birch mouse | deep hibernation |
| Heteromyidae | pocket mice, kangaroo mice | erratic, seasonal hibernation |
| Gliridaed | dormice (including the native British species) | deep hibernation |
| Muridae | African fat mouse | daily torpor |
| Cricetidae | hamsters | deep hibernation |
| white-footed mice | daily torpor | |
| Sciuridae | chipmunks, marmots (woodchuck), ground squirrels (at least a dozen species) | deep hibernation |
2.3 Hibernators as eutherms
Hibernating endotherms are not the easiest animals to study. Thus, until the late 1960s many biologists believed that mammalian hibernation was a process in which thermoregulation was simply ‘switched off’, following the receipt of a set of ‘cues’. These cues included a declining T a, a shortening daylength, the extent of body fat and a lack of food etc. With this model, the hibernator essentially becomes an ectotherm whose T b follows the T a quite closely and who is at great risk if the T a in the hibernaculum (hibernatory winter retreat) falls below freezing. Indeed, prior to the 1960s, many workers assumed that a poor thermoregulatory ability was a prerequisite for hibernation.
Question 4
What evidence casts doubt on these views?
Answer
You may be aware that many animals overwinter in hibernacula that are not very deep or well defended against cold. If they were indeed so dependent on T a, there would be a very high mortality rate. In addition, the ability to hibernate occurs in species very closely related to non-hibernators; it is unlikely that thermoregulatory ability would vary so widely between closely related genera of rodents such as the non-hibernating Djungarian or Siberian hamsters (Phodopus sp.) and the hibernating Turkish hamster (Mesocricetus brandti) and black-bellied or European hamsters (Cricetus cricetus).
Note that there is some confusion over the common names of the species of Phodopus. Until about 1980 Phodopus sungorus was considered to have two subspecies – Phodopus sungorus sungorus and Phodopus sungorus campbelli. Phodopus sungorus sungorus was known as the Djungarian hamster. There was no commonly used name for Phodopus sungorus campbelli. Then studies showed that these two subspecies were in fact different species and they were renamed as Phodopus sungorus and Phodopus campbelli. For some reason, Phodopus sungorus was then referred to as the Siberian hamster and Phodopus campbelli as the Djungarian hamster. Scientists who study these animals may well use either the older or newer common name. The moral here – always use the correct scientific name for a species as well as what might be its common name. Common names are common only to the culture in which they are used. In this text we refer to Phodopus sungorus as the Siberian hamster.
It has been recognized for many years that hibernators can arouse at intervals throughout the hibernating season without an apparent rise in T a and that arousal could occur when animals were handled or disturbed in the cold. Both of these observations imply a remarkably high degree of control by the animal (Table 3).
| T a/° C | T b rectal/° C | Relative rate of heat production per day/arbitrary units |
|---|---|---|
| 0.9 | 4.1 | 100 |
| 3.0 | 4.5 | 54 |
| 2.2 | 4.6 | 54 |
| 2.6 | 4.7 | 36 |
Question 5
In what way does the data in Table 3 suggest that T b is controlled in the hibernating marmot?
Answer
The T b in each experiment remained relatively constant, varying only between 4.1° C and 4.7° C, but the heat production varies, being very much higher when T a was held at the lowest temperature.
Nevertheless, it was not until the effects of manipulating hypothalamic temperatures (see Section 6) of otherwise cold hibernating rodents were investigated, that researchers began to consider that hibernating mammals might be exercising control similar to non-hibernating (normothermic) ones – a view that is now generally held.
2.4 Summary
Adaptive hypothermia occurs widely in both mammals and birds, but the ability is scattered throughout different families: even within single families, some species show torpor and some do not, suggesting that the ability may have evolved independently many times. Whereas a number of small birds show a daily, shallow torpor, so far only the poor will has been described as showing extended bouts of torpor comparable to those seen in mammals. Species of birds and mammals that hibernate (Figures 5 to 9) seem to have a highly advanced euthermic ability and in most cases can control T b closely down to 3–4°C, contrary to earlier views which assumed that hibernation was a manifestation of poor thermoregulatory ability.
3 Characteristics of hibernation behaviour
3.1 Introduction
The animal kingdom reveals a bewildering variety of regulated hypothermic behaviours, which are characterized by sustained hibernation at one extreme and regular short bouts of shallow torpor at the other. The many patterns observed and the variety of animal groups that exhibit these behaviours have not made it any easier to work out why different animals adopt their own strategies. Elephant shrews (Elephantulus myurus), which live in the relatively moderate climate of southern Africa for example, reduce their T b to one of the lowest levels seen in mammals in which frequent torpor bouts are observed. Torpor occurs with complete recovery about five times a day over the winter months, with the T b falling to as low as 7.5° C at a T a of 2.5° C. It seems that elephant shrews, whose body temperature fluctuates closely with environmental temperature cycles, are budgeting their energy by using – as heterotherms do – passive heating to assist their return to normal T b levels in the spring. In Section 3 we will consider the physiology of ‘typical’ hibernators, but there are new extremes of behaviour still to be explained, and no doubt yet to be discovered.
3.1 Signals for entry
Despite the fact that hibernation is reflected in a number of profound and operationally distinct physiological changes, changes in T b continue to be the recognized signs of its onset, interruption and termination, because of the relative ease of monitoring T b. Onset is triggered both by endogenous and exogenous cues.
Question 6
What would you identify as exogenous cues?
Answer
The three most important environmental stimuli initiating torpor are food supply, daylength and T a, though the order of their importance differs between species and between seasonal hibernation and daily torpor.
Both food supply and the amount of body fat are relevant. In the short term, a diminution of available food towards the beginning of the hibernation period may itself trigger hibernation, and in a laboratory cold room at constant temperatures, torpor can be induced in several species by the removal of food. Examples here include some hummingbirds and the poor will, where entry into torpor rapidly follows the removal of food. In the longer term, food supply determines the animal's ability to build fat reserves, and in some species, including some hamsters and ground squirrels, the presence of large fat reserves may be necessary for the animal's entry into hibernation.
However, others may not readily enter torpor in the absence of a store of food. Siberian hamsters (Phodopus sungorus) may fail to enter torpor even when injected with doses of insulin that result in a large and long-lasting fall in blood glucose. In this species in the wild, as well as others such as chipmunks, there is evidence that daylength is of greater importance as a cue. In general (and perhaps always), decreasing daylength is part of the stimulus, but the mechanism by which it acts may involve several separate routes. The first, which is not yet well understood, is that decreasing daylength causes an increase in the secretion of the peptide hormone melatonin from the pineal gland in the brain. Melatonin appears to act via a number of routes to predispose the animal to torpor. The second route is via the hypothalamus and the gonads; in most hibernators, entry into hibernation does not take place if there are high levels of androgens in the blood, and in the Turkish hamster withdrawal of the testes into the body cavity is a prerequisite for hibernation in males. Likewise, an injection of androgen into a torpid male hamster provokes arousal. It may also be that melatonin from the pineal gland acts to reduce gonadal secretions, as well as acting directly on the brain. Once again, the importance of ambient temperature as a cue to entry into hibernation may vary between species, though no species enters a bout of torpor unless the T a is below its thermoneutral level.
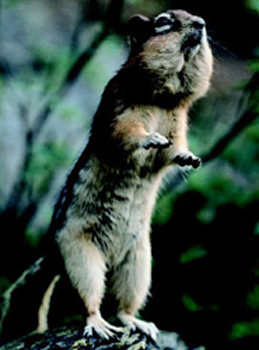
Animals such as hamsters and chipmunks are sometimes called facultative hibernators because they hibernate in response to environmental conditions. This contrasts with the so-called obligative hibernators, such as the ground squirrels and marmots, whose sequence of fattening, hibernating and arousing seems to be strongly driven by an endogenous annual cycle under physiological control. Figure 10 is drawn from data on the golden-mantled ground squirrel (Spermophilus lateralis; Figure 5) (Strumwasser, 1960), kept in the laboratory for 2 years under constant conditions of light (12 hours light and 12 hours dark) and at a constant temperature (22° C).
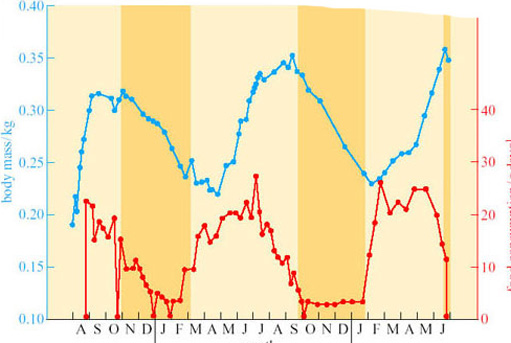
Question 7
What several conclusions on the triggers for hibernation can you draw from this figure?
Answer
As the sequence of food consumption, weight gain and hibernation continue as normal under constant environmental conditions, environmental triggers are not essential for hibernation in this animal. However, it does appear that the cycle may be shortening: in the first year the animal entered hibernation in late October, in the second in late September, and at the end of the experiment it was just entering hibernation at the end of June. Thus, this figure suggests that although the timing of the cycle may be primarily due to an endogenous circannual rhythm, in natural circumstances the timing may be re-set annually by environmental factors.
Thus, a sharp distinction between environmental and endogenous cues to entry cannot be drawn: indeed, the importance of the state of gonadal activity to hibernation in the hamster already reveals the interrelationship of these cues.
Many hibernators show a marked cycle in the production of thyroid hormones, with a decrease in their secretion at times when a non-hibernator would be increasing secretion to increase thermogenesis. Further hormonal and neural controls over the hibernation cycle are described in Section 6.
3.2 Physiological changes during entry
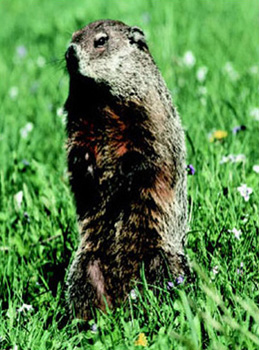
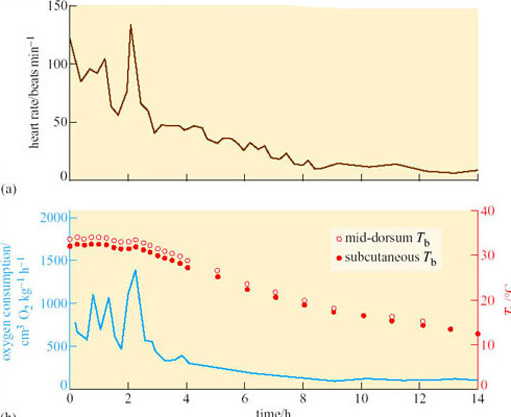
Under normal euthermic circumstances, animals kept in an ambient temperature of 0° C would be expected to show a marked increase in metabolic rate and adaptive thermogenesis. However, the response in hibernators is the opposite. Figure 11 shows data from a woodchuck (Marmota monax; Figure 8) about to enter torpor. Following a period of 2 hours or so when T b is held more or less constant, but oxygen consumption and heart rate are highly irregular, the woodchuck lowers its oxygen consumption (a measure of its metabolic rate). Within 8 hours of the start of entry into torpor, metabolism appears to be at a minimal base-line, withT b subsiding smoothly to about 12° C within 14 hours (Lyman and O'Brien, 1960).
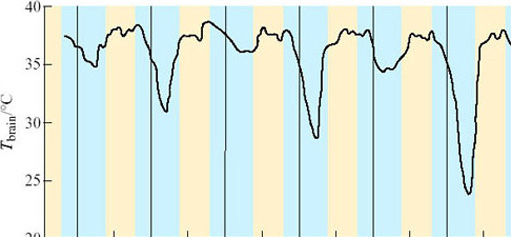
Entry into hibernation can take a great deal longer than the few hours it takes in the woodchuck. In the 1960s at Harvard University, Felix Strumwasser recorded the brain temperature (T brain) of the Californian ground squirrel (Citellus beecheyi) entering hibernation (Figure 12). T brain dropped during each dark period but rose again before the period of light. On the first, third and fifth ‘nights’, the drop was to less than 34° C, but on the remaining ‘nights’ the drops were successively greater. Strumwasser (1960) argued that these test drops indicated metabolic and neuronal preparation for deep hibernation. Such test drops are quite common in mammals entering hibernation, but are by no means universal.
The blood pressure of ground squirrels entering hibernation has been measured by inserting a catheter into the aorta. Once the catheter is in place and the animal has recovered from the operation, blood pressure can be measured with no stress to the animal. At first, the mean blood pressure remains within the range of the active animal, but as hibernation deepens the blood pressure decreases. A mild peripheral vasoconstriction takes place and it persists throughout the period of hibernation. This vascular response may be important in maintaining adequate blood pressure to the brain, given the huge reduction in heart rate.
However, during entry into hibernation, there are large fluctations in vasomotor tone, and periods of superficial vasodilation occur, which may have the effect of accelerating heat loss. Indeed, it is quite likely that vasomotor control largely determines the changes in T b seen in test drops. These fluctuations alternate with short periods of shivering, suggesting that the rate at which the T b is allowed to drop is being carefully controlled.
3.3 Maintenance
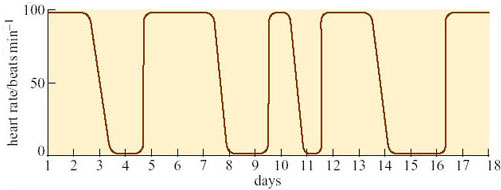
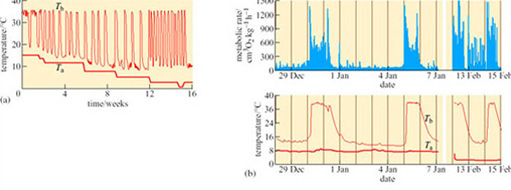
Entering hibernation is not a passive process in response to falling T a. Nor is deep hibernation a passive process or indeed a uniform state. Figure 13 shows the pattern of hibernation (as measured by the heart rate) of an arctic marmot (Marmota caligata) kept in the laboratory at a T a of 10° C for 18 days in February. Despite being inactive, every one or two days the heart rate rises abruptly, remains high for a number of days, and then falls again. These records are from an animal under laboratory conditions, but similar changes have been recorded from animals in the wild.
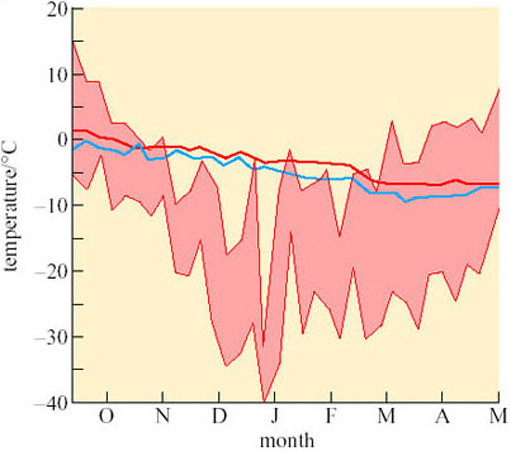
Most hibernators spend the winter in hibernacula or dens some feet below the ground surface. The importance of the behaviour involved in the selection and ‘engineering’ of these winter quarters is demonstrated in Figure 14, which shows the variation in external temperature in Alaska from September to May. Superimposed on these data are temperatures of the warmest and coolest burrows of arctic ground squirrels (Spermophilus undulatus). You can see the burrow temperatures vary by less than 10° C throughout these winter months, though for most of that time they are below zero (Mayer, 1960).
An exception to the rule is the dormouse (Muscardinus avellanarius), which hibernates above ground, usually amongst the leaf litter (which provides some protection) on woodland floors. The most obvious changes in deep hibernation (apart from the lowered T b) are concerned with metabolism.
Heart rates of over ten or under three beats per minute are rare. The major cause of these extremely low rates is the lengthening of the time between individual beats.
Cardiac output is also reduced, to about 1.5% of normal (a mere 1 cm3 blood min−1 in the ground squirrel).
Respiration is greatly reduced. It may take place at quite evenly spaced intervals, or long periods of apnoea (cessation of breathing) may occur followed by several deep inspirations. (The record for holding a breath in torpor is 150 minutes in a hedgehog, though the average for this species is 60 minutes.)
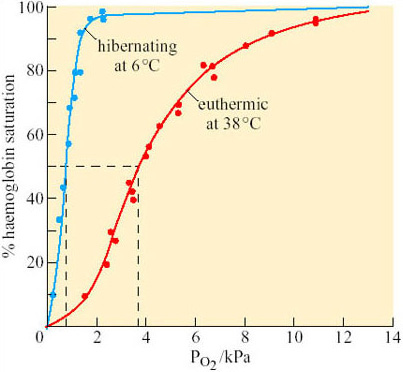
The lower T b of hibernating animals and the changes in the respiratory and cardiovascular performance lead to marked acidosis: the pH of arterial blood falls by 0.24–0.48 and P CO2 is increased by a factor of 2.5–4.0. The oxygen supply to the tissues is dependent upon cardiac output, haemoglobin concentration and on the shape of the oxygen dissociation curves. Figure 15 illustrates the latter for euthermic (T b 38° C) and hibernating (T b 6° C) ground squirrels.
Question 8
What do you conclude from Figure 15?
Answer
The curve for the hibernating squirrel has shifted markedly to the left. Half-saturation (P50) is therefore achieved at a much lower P O2, indicating a higher oxygen affinity.
Other evidence indicates that there is also an increase in haemoglobin in the blood as an animal enters hibernation. The hibernator's tissues therefore have a high tolerance of hypoxia. These changes explain how a hibernating animal such as a hedgehog can survive the long period of apnoea that is characteristic of intermittent breathing; it draws on the increased oxygen stored in the blood.
In addition to changes in respiration and in the cardiovascular system, there are marked changes in endocrine function. Endocrine gland atrophy is characteristically found prior to the onset of hibernation; particularly atrophy of the pituitary, gonads, thyroid and adrenal glands.
The physiological state of an animal in deep hibernation is, however, dynamic (the physiological controls are still working) and not that of a passive animal made hypothermic. For example, if there is a decline in the resistance of the peripheral blood vessels and a drop in blood pressure, there follows a compensatory increase in heart rate and cardiac output. The most graphic illustration of the fact that a hibernator retains physiological control mechanisms is its response to the falling ambient temperature. If T a drops below a particular level (which depends upon the species in question), there is always a compensatory increase in heart and respiratory rate, and a rise in metabolic rate, and therefore a tendency to raise or at least preserve T b. If the carbon dioxide concentration of the inhaled air is increased, then hibernating mammals react by increasing their breathing rate. In the hedgehog, the CO2 threshold is 0.7–1.7%, at which point the periods of apnoea become shorter. Continuous breathing replaces periodic breathing at 5–9% CO2.
The evidence suggests therefore, that the hibernator is sensitive to changes in its environment and that appropriate physiological responses can still be made. If the change or response is major, then the individual rapidly begins to arouse. It is this ability of hibernators to elevate T b from 5–10° C to the euthermic level, even at T a values below zero, that puts them into a class of their own.
3.4 Arousal
We can identify three types of arousal during the hibernation period, on temporal rather than physiological grounds. The first is alarm arousal, in response to a major exogenous stimulus such as a sudden large drop in environmental temperature. The second is a periodic arousal when, in the absence of external cues, the animal spontaneously begins to re-warm. The third is the final arousal in the spring when the animal does not re-enter hibernation but emerges to a sustained euthermia. Physiologically, all three are similar.
3.4.1 Alarm arousal
A potentially life-threatening event, such as a fall in T a to below zero, elicits a transient metabolic response in a hibernator. If the lowered temperature is maintained, the animal responds not just with transient increases in metabolism, but with a sustained rise in T b and complete arousal.
Mechanical stimuli as well as temperature changes can evoke arousal. In animals fitted with electrodes just under the skin to monitor muscle action potentials, an externally applied stimulus results in a long-lasting burst of action potentials. The response in the fat dormouse (Glis glis) is very striking. This species hibernates with its bushy tail curled over its back. If the erect hairs are gently displaced, a burst of muscle action potentials occurs with a concurrent rise in respiratory and heart rates. Vibration, pressure, locally applied heat or cold, and the infusion of a variety of substances all produce the muscle response. In fact, the responsiveness of receptors in hibernators appears to increase with decreasing temperature, in marked contrast to the situation found when non-hibernators are made hypothermic.
The adaptive value of such a response is obvious. An animal torpid in a burrow seems quite defenceless. By retaining a high degree of surveillance, the animal can still perceive disturbances in air-flow or collapse of the burrow and make the appropriate response.
3.4.2 Periodic arousal
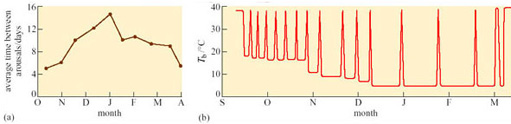
All mammalian hibernators arouse periodically. The frequency of the arousal and the length of the euthermic periods between bouts of hibernation vary widely with species, among individuals, and with the time of year (e.g. in deep hibernators, the larger species seem to have longer periods of wakefulness than the smaller ones). The arctic marmot (Marmosa caligata), whose heart rate recording is shown in Figure 13, aroused from hibernation every 2–3 days and remained euthermic for 3–4 days at a time. Figure 16a shows the average number of days between successive arousals of golden-mantled ground squirrels at various times in one hibernation season and Figure 16b shows the frequency of arousals in a Richardson's ground squirrel (Spermophilus richardsonii).
Evidence points to the likelihood that the internal mechanisms which set circadian rhythms do not operate during deep hibernation. But in studies on hibernation in European ground squirrels kept under conditions as close to the natural habitat as possible, continuous recording of temperature using implanted thermal dataloggers showed that entry and arousal from torpor was synchronized to the time of day in some animals. All animals entered torpor in the afternoon and some even aroused at the same time. Circadian temperature fluctuations occurred at higher temperatures during entry and arousal phases.
What could be the function of periodic arousals? Some hibernators, such as hamsters, store food for the winter in their nests or burrows, and eat during the periods of arousal. Bats arouse to drink on mild nights. For those species that only metabolize fat from their stores during hibernation, the reason for arousal is not so obvious, particularly as the energy expended in a single arousal lasting a few hours can equal that used in 10 days of hibernation. In the arousing golden hamster (Mesocricetus auratus), changes in oxygen consumption and temperature in various parts of the body are rapid and extensive (Figure 17).
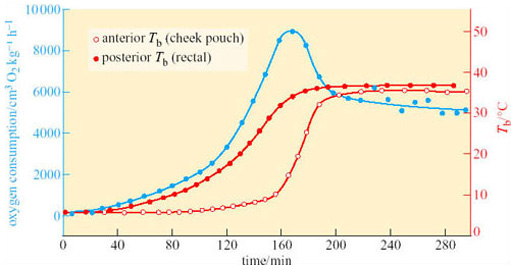
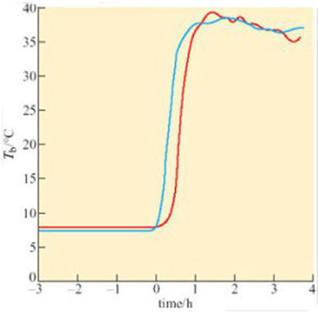
At the start of arousal with an ambient temperature of 5° C, oxygen consumption is 60–80 cm3 kg−1 h−1. Within 3 hours this rate rises 100-fold, to a level comparable to that of violent exercise. At the start of arousal, cheek pouch temperature is virtually the same as that of the rectum but you can see that, as arousal progresses, the cheek pouch temperature rises more rapidly and there is a difference of more than 20° C by 160 minutes. A short time later, oxygen consumption reaches its peak and declines rapidly, whereas cheek pouch and rectal temperatures attain the euthermic level. In some species, for example many ground squirrels, the process of arousal may even be much faster than it is in the hamster (Figure 18).
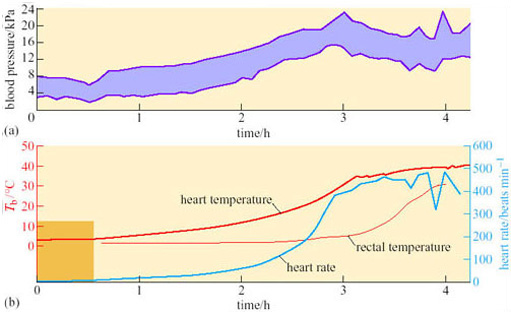
A difference between anterior and posterior T b during arousal is seen in virtually all hibernators, including bats. Since the end of the 19th century, it has been known that there are profound circulatory adjustments during hibernation. By using a radio-opaque dye and X-ray equipment, it is possible to show that blood flow to the posterior region of the golden hamster is restricted during hibernation, but increases in the forelimbs, heart, diaphragm, thorax and deposits of Brown Adipose Tissue (BAT) during the initial stages of arousal. Figure 19 shows various measures, blood pressure, heart rate, and rectal and heart temperatures, during arousal of a 13-lined ground squirrel (Spermophilus tridecemlineatus) (Lyman and O'Brien, 1960).
Peripheral vasoconstriction, and thus the resistance to blood flow, appears to lessen at the start of arousal, indicating vasodilation, but then rises rapidly while the heart rate is also increasing: as a consequence the rapidly beating heart is working against a high blood pressure. In these circumstances, although the heart may be an inefficient pump it is a good source of heat as the animal warms up. As rectal temperature increases rapidly, the blood pressure starts to decline, associated with a decrease in peripheral resistance, probably due to a sudden vasodilation in the posterior regions of the body is thought to be responsible. Evidently, vasomotor changes are important in arousal as well as in entry to torpor.
Hibernators arouse without recourse to external heat, so what is the source of the heat required? The violent shivering that accompanies some stages of arousal suggests that contraction of skeletal muscle is important but even animals in which skeletal muscle activity has been inhibited by curare (which blocks transmission at neuromuscular junctions) can re-warm.
3.5 Arousal (continued)
Question 9
What alternatives to shivering might act as a source of heat?
Answer
BMR is maintained mainly by a number of tissues with high metabolic activity. One of these, BAT, is unique in its ability to adjust its output of heat from being very low to being the body's principal source (see Box 1).
Box 1: Background to brown adipose tissue (BAT) – the role of uncoupling protein
Experiments using rabbits show that a marked lowering of T a initially lowers the temperature in many parts of its body, including areas that contain BAT. However, the temperature of the area with BAT rapidly returns to normal (37° C) because of thermogenesis within the BAT. In contrast, muscle temperature continues to fall because it has no capacity for temperature-related thermogenesis. The temperature of organs surrounded by, or near to BAT, show a smaller decrease in temperature. These results explain how core temperature, and hence the functioning of essential organs, is protected.
Mammals contain white adipose tissue (WAT) and, usually, BAT. The proportion of the total mass that is BAT varies from species to species, some having none but some having up to about 5% of body mass. The extent to which BAT produces heat in response to cold stress depends on the amount of BAT. Broadly speaking, mammals with small neonates, small mammals that are cold-acclimatized, and mammals arousing from hibernation, all contain a significant amount of BAT and are substantially dependent on it for thermogenesis. BAT is very much more thermogenic than any other tissue, by about a factor of ten (per unit mass), and is located in discrete depots with a good vascular supply. These depots contain brown adipocytes, which have a characteristic size and structure and are well endowed with numerous, large mitochondria with many cristae and a high concentration of cytochromes. It is the degree of vascularization and the concentration of cytochromes that give BAT its brown colour. Brown adipocytes also contain more glycogen than white adipocytes. White adipocytes are mainly unilocular (one large vacuole containing fat), whereas brown adipocytes that are thermogenically active are multilocular (a large number of small vacuoles containing fat). Brown adipocytes uniquely contain uncoupling protein (UCP). BAT is well innervated by neurons of the sympathetic branch of the autonomic nervous system. Neurons innervating brown adipocytes contain the neurotransmitter, noradrenalin; those innervating blood vessels contain another neurotransmitter, neuropeptide Y.
WAT is primarily a store of fat that is mobilized to provide lipid fuel for tissues remote from itself. In contrast, the function of BAT during cold stress is that of thermogenesis. When a BAT depot is cold-stressed, there is rapid cell division that increases the mass of BAT. The diameter of blood capillaries increases, and there are also changes in the histological make-up. Cold stress also leads to an increase in BAT sympathetic nervous activity and in the tissue concentration of UCP.
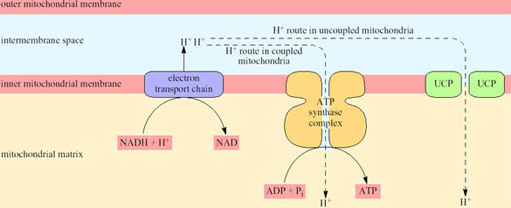
Non-BAT mitochondria (whether in WAT or any other tissue) are capable of transforming about 40% of the chemical energy of the respired substrates to the chemical energy of ATP; the other 60% appears as heat. However, because the rate of respiration is coupled to ATP production, the rate of respiration, and thus oxygen consumption and heat production, is comparatively low. ATP is produced by a mechanism that depends on the inner mitochondrial membrane being impermeable to hydrogen ions except via channels that are part of the ATP synthase complex. In BAT mitochondria however, fuel oxidation is uncoupled from ATP production, thus ensuring that all the energy released from oxidation is released as heat. As a consequence of uncoupling, which is brought about by the uncoupling protein UCP, the rate of heat production is greatly increased (Figure 20).
UCP is situated in the inner mitochondrial membrane and acts as a proton translocator providing a route by which hydrogen ions (built up in the intermembrane space as a consequence of electron transport) are able to re-enter the matrix without passing through the ATP synthase complex.
Blood flow to BAT reaches a maximum level in the arousal process, and recent work has shown that, while the uncoupling protein (UCP) in the mitochondria is in a ‘masked’ or inactive form during hibernation, the amount of active UCP is rapidly increased during arousal (see Section 4).
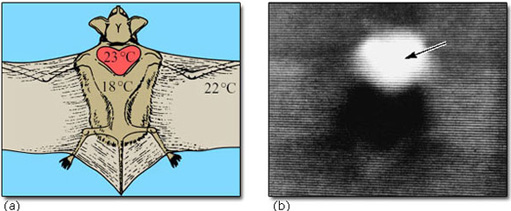
The interscapular region contains the largest mass of BAT near to the body surface. In hibernating mammals, this region is significantly warmer than other parts of the body (except possibly the heart) in the early stages of arousal. In big brown bats, the area of BAT is always warmer than the heart, and arousal is very fast (8° C to 37° C in less than 30 minutes). Figure 21 shows the thermographic tracing of body heat (infrared radiation) in an arousing bat. The area of BAT is the warmest part which suggests that it is the thermogenic source (Hayward and Lyman, 1967).
We should not infer that BAT is the major or only source of heat in all arousing hibernators. In those rodents which lack BAT, and probably also in the hedgehog, most of the heat in a normal arousal is generated by the shivering of skeletal muscle. Although birds do not seem to possess BAT, they are capable of non-shivering thermogenesis (NST), which is cold-induced heat production that is not due to muscle shivering. This kind of thermogenesis takes place in the muscles of cold-adapted ducklings and emperor penguin chicks, and there is evidence that it depends on free fatty acids liberated from WAT. Molecular evidence reviewed in Section 4 is pointing to the possibility that WAT, as well as BAT, can serve as a source of heat. However, it is not yet known what the relative importance of shivering and non-shivering thermogenesis is during arousal from daily (or more prolonged) torpor. Most birds can increase their BMR by a factor of four or five under extreme cold stress.
3.5.1 Final arousal
Emergence can be viewed as the final step in the series of periodic arousals. Instead of re-entering hibernation, the animal maintains the euthermic condition. The cue for maintaining this final arousal is probably not temperature, as some species emerge when T a is well below zero. It is also difficult to see how arousal could be affected by daylength, since the hibernating animal is usually underground in a cavity or a burrow. Perhaps fat or food stores reach a minimum level or the timing of the final arousal is pre-programmed into the animal's activity cycle.
3.6 Length of torpor bouts in hibernation
It is obvious that there is a very high energetic cost to arousal, and an even higher one to the periods of euthermic wakefulness prior to re-entering torpor. If an animal could simply enter torpor once, and arouse 2, 4 or 6 months later, depending on the environment, it would represent a huge energy saving. Thus, it has been assumed that either prolonged torpor is physiologically impossible, or there is some strong selective value to the species in regular arousal. In the case of some small species of mice, which cannot store very much energy as fat and therefore build up a cache of seeds in their hibernacula, periodic arousal to feed is explicable, as is arousal to forage in those species that do not make food stores. For most species, however, there is no such obvious rationale. Larger animals tend to have lower metabolic rates than smaller animals, but tend to have longer euthermic intervals.
3.7 Summary
The physiological details of deep or seasonal hibernation vary widely between species. However, the general pattern is similar, involving controlled entry to torpor, with or without ‘test drops’, and periodic arousals. The intervals between these arousals depend on size, T b and other factors. The frequency of the arousals falls off during the deepest part of the hibernation. Entry to hibernation may be triggered by temperature, daylength and shortage of food, especially in facultative hibernators (e.g. hamsters, chipmunks), or by endogenous circannual rhythms, as in some obligative hibernators (e.g. marmots, ground squirrels). In spite of the very low T b, physiological control is maintained, as is a low level of metabolic activity.
The three types of arousal – alarm, periodic and final – are physiologically similar. Alarm arousal is initiated by external stimulation. Periodic arousal is initiated by endogenous signals. Strategies for increasing T b during arousal include both muscle activity and NST. BAT is certainly important as a source of heat for arousal in many species of mammals, though apparently not in birds. Final arousal occurs in spring, though it is not known what prevents the animal from re-entering hibernation. Arousal appears to be physiologically imperative at some stage during torpor.
4 Physiological adaptations – molecules and cells
4.1 Scientific approaches
Even after many years of research, the phenomenon of hibernation continues to be a mystery to scientists. Despite coming nearer to an understanding of how and why it happens, some fundamental questions remain unanswered. Is there a genetic basis underlying the evolutionary predisposition of animals to hibernate, given its occurrence in many groups of vertebrates and invertebrates? Is the problem of metabolic adaptation in cells separate from thermal regulation which occurs throughout the organism? In Section 4 we will attempt to answer these questions, starting here by looking at scientific approaches.
Faced with an exploration of the unknown, rather than simply testing an existing hypothesis, research can adopt two different approaches in attempting to associate molecular events with physiological functions.
The analytical approach seeks to identify all the significant changes that accompany a specific physiological adaptation and then seeks to explain these changes. For example, differences in the patterns of expression of a number of genes that manifest themselves during hibernation can be identified against a background of no change. The processing of very large numbers of genes in this way became possible in the late 1990s with the advent of DNA chip technology. This powerful approach can provide information about the state of expression of thousands of genes in each tissue (Box 2).
Such an analytical approach has led to the identification of a few genes in a range of species whose expression is either increased or decreased during hibernation (Table 4).The table shows that some of the genes are associated with the metabolic, respiratory or control functions that you might predict would be linked to the maintenance of, or recovery from, hibernation. The links revealed in this kind of analysis sometimes appear indirect or tenuous. The benefit of this ‘needle-in-the-haystack’ approach, however, is that it reveals changes in expression patterns in a handful of proteins amongst a very large number which do not undergo such changes – even those that might be predicted to do so. Genetic analysis has revealed significant changes in the expression of genes whose function is not known or not directly related to hibernation (for example, the HT20 gene family in Table 4).
| Gene | Tissue | Change in expression | Possible function |
|---|---|---|---|
| apoferritin | liver | increase | iron storage protein – increases availability of iron for cytochromes and haemoglobin |
| c-fos | brain | redistribution+ | rapid-response gene – coordinates reaction to physiological change |
| genes for fatty acid binding proteins | BAT | increase | preparation for rapid thermogenesis during arousal |
| genes for glyceraldehyde phosphate dehydrogenase | liver, muscle | decrease | reduces glycolysis |
| HT20 family | muscle, WAT | decrease | function unknown – all related structurally to protease inhibitor α1 anti-trypsin |
| genes for pyruvate dehydrogenase | heart, skeletal muscle | increase | depresses metabolism by preventing pyruvate kinase conversion into acetyl CoA |
Footnotes
+ c-fos expression undergoes a decrease in the hypothalamus during hibernation and a redistribution within specific neuronal nuclei on arousal.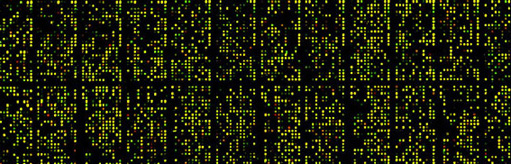
Box 2: DNA ‘microarrays’ for the study of gene expression
To elucidate the entire mRNA content of a cell, or to study all the genes that are being actively transcribed at any one time, every protein-coding gene in the genome would have to be analysed. The enormity of this task can be appreciated only by considering the number of genes that are activated in a single biological process. For example, during the transition from aerobic to anaerobic respiration in cells of the yeast S. cerevisiae, changes in the expression of 1740 genes have been recorded. This large change in gene expression in S. cerevisiae has been analysed using the technique known as DNA microarray (Figure 22).
The design of DNA ‘chips’ allows many hybridization experiments to be performed in parallel. A DNA chip is a very thin layer of silicon, 2 cm2 or less in area, carrying a large number of DNA probes, a microarray, each with a different sequence and each at a defined position on the chip. The probes can be short oligonucleotide sequences, and can be spotted onto the silicon using high-speed robotics to form a microarray, which is then incubated with the labelled target to allow hybridization to take place. To determine which oligonucleotides have hybridized to the target, the surface of the chip is scanned and the positions at which the signal emitted by the label is detectable are recorded.
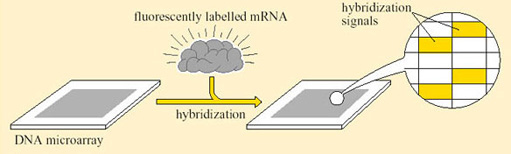
Studies on cancerous tissue using this technique discovered genes whose expression patterns differed significantly when normal colon epithelial cells were compared with colon cancer cells. In brief the method was as follows (Figure 23). Messenger RNA preparations were made from cancerous and normal cells. Each preparation was then labelled with a radioisotope attached to a fluorescent marker and allowed to hybridize to a microarray containing probes for several thousand human genes. The hybridization signal associated with each gene was then used to assess the particular mRNA in each preparation. In pancreatic cancer cells, about half of these genes also showed abnormal expression levels. The implication of this study is that some genes are abnormally expressed in more than one type of cancer while others are expressed more specifically. DNA microchip technology has been one way to enable such studies of gene expression.
Question 10
How can we attach relevance to an observed change in gene expression, and hence predicted changes in the biosynthesis of the protein which the gene encodes?
Answer
First, the nucleotide sequence of each gene is compared with those in the genomic database for the species. High levels of sequence homology (similarity) enable us to predict functional analogies with these genes on the basis of predicted protein structure, spatial (tissue location) and temporal (daily or seasonal) expression patterns. If such a search fails to establish any homology with any known gene, it is necessary to establish a function without precedent for the new protein. The most valuable evidence frequently comes from observations on loss of physiological function when one or both copies of the gene are deleted from the genome. Hypotheses on the function of the protein may then be tested by determining the proteins and subcellular structures with which it interacts in order to fulfil its function.
The analytical approach has indicated that different tissue-specific genes are activated or repressed in the brain and peripheral organs of hibernating animals. The genes encode pre-identified proteins which are linked to the role of each tissue in hibernation (i.e. reactive control in the brain, metabolic adaptation in liver muscle and adipose tissue) plus some proteins whose function is unclear.
The targeted approach seeks to investigate a possible role for molecules already suspected of participating in physiological regulation. An example is the enzyme arylalkylamine-N-acetyltransferase (AA-NAT). This enzyme catalyses the rate-limiting step in the production of a hormone, melatonin, from the pineal gland. Melatonin has the capacity to re-set circadian rhythms in a variety of physiological processes. Entry into hibernation requires neural and endocrine control systems that govern the normal day/night (circadian) cycles of metabolism and T b, to be overridden.
Question 11
What would you expect analysis of gene expression to show?
Answer
Expression of AA-NAT, leading to elevated biosynthesis of melatonin, should increase just prior to onset and during hibernation. Circadian rhythms would then be interrupted whilst the animal is torpid.
This prediction was supported by studies using 13-lined ground squirrels. Messenger RNA for AA-NAT protein biosynthesis increased in the brains of hibernating animals as expected – an accepted indication that the enzyme's activity had increased (Figure 24) (Yu et al., 2002).
In a second example, researchers proposed a working hypothesis that the uptake of fatty acids by hibernating tissues, which is normally under tight control, should be deregulated in preparation for the task of storing large reserves of lipid. They expected to see changes in the activity of a key enzyme, acetyl CoA carboxylase. This enzyme catalyses the formation of malonyl CoA, a potent and major inhibitor of mitochondrial fatty acid uptake. In studies on Richardson's ground squirrel, the hypothesis was proved right. Acetyl CoA carboxylase in heart muscle was much reduced prior to and during hibernation, so allowing more fatty acid uptake by mitochondria in cardiac muscle.
Box 3: Regulated/regulating enzymes that influence RQ value and energy fuel selection in adipose tissue and muscle
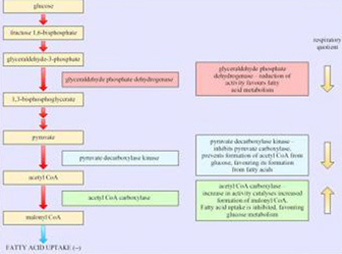
Gene expression research has provided evidence for the enzymes that play an important role in determining the choice of respiratory fuel in adipose tissue and hence the respiratory quotient (RQ; see Box 3). As we will see in the next section, changes in energy sources are a characteristic of hibernators.
4.2 Arresting protein synthesis
The regulation of T b in hibernators has traditionally been viewed as the fundamental physiological process in hibernation. But recently, questions have been raised about whether thermal changes initiate or simply accompany metabolic depression. Is the metabolic inactivity of animal tissues during bouts of torpor or in hibernation, the cause or the result of hypothermia? A common-sense view is that temperature directly influences metabolism by regulating enzyme activity. Evidence of separate, temperature-independent regulation of metabolic processes in hibernators would lead us to reconsider the classical view of hibernation.
In greater horseshoe bats (Rhinolophus ferrumequinum), in which large changes both in T b and in body mass occur during hibernation, the duration of torpor is inversely related both to T a and to the animal's level of body hydration in hibernating ground squirrels. Protein synthesis in brain tissue is actively arrested for several weeks at a time and, at the onset of hibernation, mRNA is translated into protein at a much slower rate in brain tissue extracts even when measured at 37° C (Frerichs, 1998).
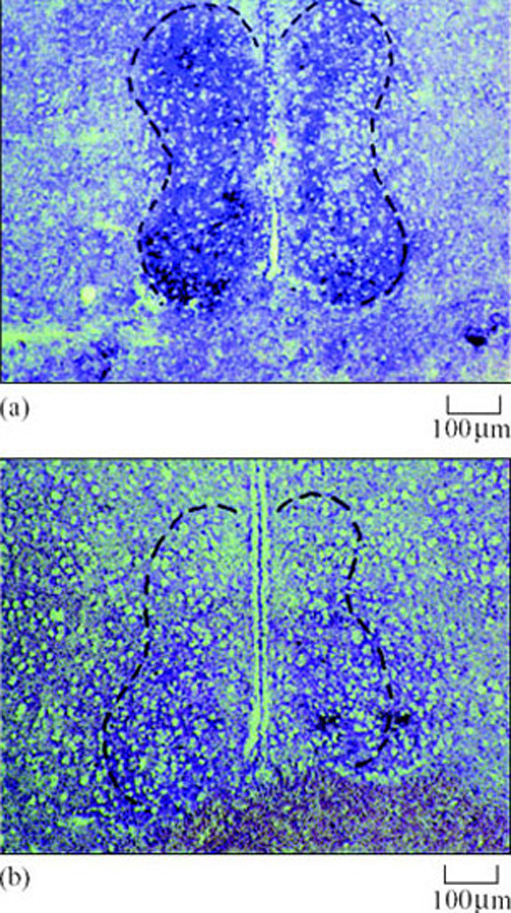
This change in metabolism may lead to the onset of cellular quiescence during hibernation. Protein synthesis in vivo, as measured by the incorporation of radioactive leucine into the brain tissue of ground squirrels, is almost undetectable during entry into hibernation, even though T b is still high. Figure 25a is an autoradiogram which shows tissue sections that have been exposed for several days to X-ray film. The colours represent different levels of incorporation that are detected as radioactive emissions. The green areas show relatively high levels of incorporation in an area of the brain called the hippocampus in the active but not in the hibernating animal. The in vitro studies in Figure 25b confirm that there is relatively little leucine incorporation into the brain tissue of the hibernating animal. The differences in control mechanisms over protein synthesis in hibernating and euthermic brains are subtle. There is no difference in the structure or quantity of mRNA or the functioning of the ribosomes on which it is translated to protein. However the ‘transit time’, or duration taken for polyribosomes to process each mRNA molecule, is three times longer in hibernating animals. The initiation factor, eIF2, which is involved in the aggregation of ribosomes and the initiation of translation, may be inhibited in hibernating cells. Although this finding does not point to suppression of specific areas of metabolism, we can predict that energy generation, tissue homeostasis and growth are all likely to be suppressed by a general fall in protein synthesis.
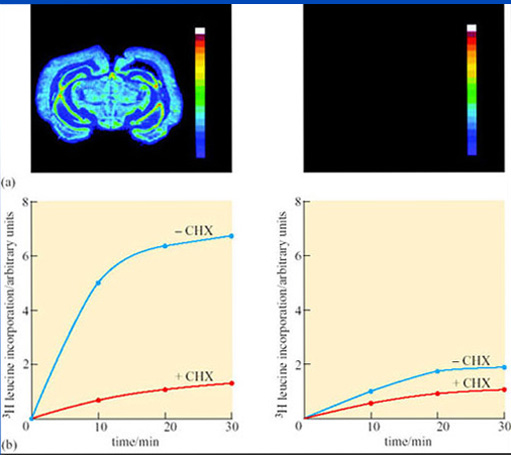
Figure 25a, b Discussion
Figure 25a contains colour-coded autoradiograms, showing rates of cerebral protein synthesis as detected by the incorporation of a radioactive derivative of leucine in an active (left) and a hibernating (right) ground squirrel in coronal (vertical and left-to-right) sections of the brain at the level of the hypothalamus. The bar on the right of each figure shows increasing levels of leucine incorporation from purple (zero) to red (high). During hibernation, leucine incorporation was not detected. FIgure 25b shows that cytoplasm from hibernating cells translates mRNA to protein at a lower rate than euthermic cells, even at 37° C. Following introduction of radio-labelled leucine at time zero, the reaction was allowed to proceed for 30 minutes. Incorporation of leucine into the cell extract was several times higher in cells from active (left) compared with those from hibernating (right) brains. Incorporation was blocked by cycloheximide (+CHX), a specific inhibitor of protein synthesis.
However, the change in protein synthesis in laboratory experiments is just as evident in cells from hibernating animals at 37° C; it does not appear to be a consequence of thermoregulation. This finding does not mean that the change from protein synthesis is wholly independent of thermoregulation. In golden-mantled ground squirrels, reorganization of polysomes and an increase in mRNA elongation increases abruptly at 18° C during arousal, as the need for protein synthesis becomes critical.
4.3 Cellular changes
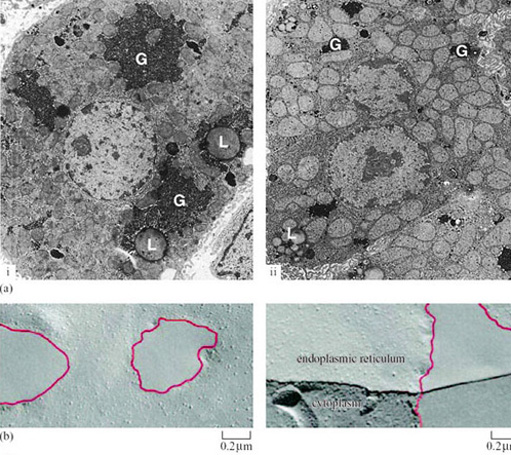
Hibernation can result in the deposition of fat in adipose tissue. In tissues of finite size which are important sources of energy and sites for fuel metabolism, changes in cell structure (redistribution of organelles involved in energy metabolism and protein synthesis) are the most likely adaptation to a state of torpor. Liver hepatocytes of the hibernating dormouse (Muscardinus avellanarius), are visibly different from those of arousing and euthermic dormice when viewed in thin section with a microscope (Figure 26a(i) and (ii)) (Maletesta et al., 2002).
Question 12
Can you see evidence of these differences in Figure 26a?
Answer
There is a substantial reduction in the cross-sectional area of both the whole cells and the cytoplasm in the hibernating dormice. The number of granular glycogen deposits is reduced which suggests that carbohydrate metabolism is reduced. The Golgi apparatus shrinks dramatically, which indicates that reductions in protein and lipid synthesis as well as carbohydrate metabolism have occurred.
Glycogen does not reappear in the cell for several hours after arousal. However, the whole cells and the cytoplasm increase significantly in size and start to resemble those of euthermic animals. The reverse changes are true for lipid storage in the cell, with the proportional cross-sectional area occupied by lipid droplets being significantly increased in early hibernation, reduced in deep hibernation and almost disappearing during arousal. Changes in the structure of organelle membranes in neurons from the brain of hibernating hypothermic ground squirrels are also visible when viewed with an electron microscope. Membrane lipids and proteins coalesce to leave patches free of protein (Figure 26b) (Azzam et al., 2000). These detailed observations provide clear indications that fundamental restructuring of lipid bilayers can occur as an adaptation to torpor. The reasons for the changes are not fully understood, but presumably they give some protection from cold-damage and permit rapid recovery of cells from temperatures close to zero. The survival of cells is also the subject of molecular adaptations as we will see below.
4.4 Cell survival mechanisms
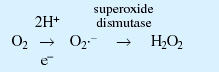
Physical damage is not the only danger that faces cells recovering from low temperatures in the absence of oxygen (due to a 90% drop in blood flow to the brain) and energy supplies. A universal sign of recovery from such conditions is the production of reactive oxygen species (ROS) (Box 4). The electron transfer chain that participates in the formation of water from oxygen in mitochondrial respiration can also be used in the production of the free radical superoxide, sometimes called ‘singlet oxygen’ because the molecule contains an extra unpaired electron. These short-lived molecules can initiate spontaneous chain reactions through electron transfer leading to the generation of highly reactive hydroxyl free radicals. They then react with free fatty acids forming the compounds malonaldehyde and 4-hydroxynonenal, which cause damage to proteins and nucleic acids, eventually leading to cell death. There are two adaptive mechanisms which hibernating vertebrates have adopted to counter the potentially toxic consequences of a surge in oxygen supply on arousal.
Box 4: Generation of reactive oxygen species
Normal respiratory pathway:
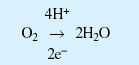
Generation of superoxide:
Generation of hydroxide free radicals:
Generation of lipid peroxides from hydroxide free radicals:
Generation of reactive species that damage proteins and nucleic acids:
First, the concentration of a number of ROS-neutralizing compounds such as vitamin C (ascorbic acid) and glutathione, and the enzyme superoxide dismutase, increases on arousal from hibernation. Neutralizing compounds are ‘scavengers’ of lone electrons present in superoxide and hydroxyl free radicals, whilst an increase in the activity of superoxide dismutase results in the conversion of all the superoxide to hydrogen peroxide and hence reduced formation of the hydroxyl free radical. In the ground squirrel, circulating levels of ascorbic acid increase by up to five times. Continuous measurements of blood ascorbate in arctic ground squirrels during arousal show that the levels of anti-oxidant start to decrease at the peak level of oxygen consumption, indicating that ascorbate is being distributed to respiring tissues to counter oxidative damage.
Secondly, proteins that prevent the sequence of events leading from ROS damage to cell death are activated. In the 3-lined ground squirrel (Lariscus insignis), cells lining the intestine are particularly vulnerable to ROS damage as they adapt to the absence of dietary nutrients. Lipid peroxides are one of the end-products of superoxide activity and their levels increase during entry into, and during, the early phase of a torpor bout. Their formation is accompanied by a substantial increase in biosynthesis of a protein known as NFκB. The protein is a gene regulator that is only stimulated in affected cells by redox reactions which accompany the generation of superoxide. No stimulation is seen in WAT where no lipid peroxidation is measured. NFκB activates genes that lead to cell death by preventing metabolic pathways initiated in the mitochondria. A hibernation induction trigger (HIT) circulates in the plasma of hibernating mammals ( and is believed to protect cells from death by activating similar protective genes. This area of hibernation research, as you might expect, is of considerable interest to medical researchers seeking the means to protect victims of cerebral ischemia and stroke, characterized by loss of blood flow very similar to that experienced by hibernators, from long-term tissue damage.
4.5 Summary
Molecular approaches to the study of hibernation have combined largely non-hypothetical analytical and targeted methods. The analytical approach shows changes in the expression patterns of novel genes, often with unforeseen or unknown functions in hibernation, whilst indicating that the scale of the full range of adaptive genetic changes is small. The targeted approach has confirmed an important role for gene products normally involved in maintaining biological rhythms and energy-generating metabolic reactions.
The basis for the slowing of metabolic processes is the arrest of protein synthesis in hibernating cells through changes that inhibit the initiation of messenger RNA translation and polysome assembly. Although the mechanism operates in hibernating cells at any temperature once initiated, it is triggered during entry to torpor at a critical T b. Changes that occur in the structure of hepatocytes, their fuel deposits and mitochondria during the transition from carbohydrate to lipid metabolism, are indicative of enduring adaptations at microscopic level.
Hibernators have a system of protection against cellular injury or death resulting from the actions of reactive oxygen species (ROS) produced during the respiratory burst that accompanies arousal. Protective mechanisms include an increase in the level of ROS-neutralizing compounds in the blood and regulators that inhibit biochemical pathways leading to the death of individual cells.
5 Physiological adaptations – respiration and energy provision
5.1 Introduction
The change in BMR observed in all hibernators has traditionally been viewed as a passive response that is a consequence of hypothermia. However, many studies have provided evidence for temperature-independent regulation of BMR. In the alpine marmot (Marmota marmota), a BMR that is less than 5% of summer levels is maintained despite the frequent fluctuations in body temperature between 8 and 18° C. The mechanism of body temperature regulation in marmots, during long periods of hibernation, has become clearer following investigations of T b and BMR throughout this phase. Entry into hibernation is facilitated by a precipitate drop in BMR that precedes slower temperature changes, then throughout the winter, bursts of thermogenesis occur quite independently of T a (Figure 27) (Ortmann and Heldmaier, 2000).
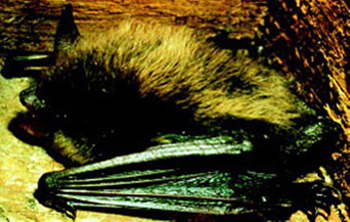
It is widely acknowledged that mammals switch to the use of lipid from WAT during hibernation. A period of ‘fattening-up’ precedes the onset of hibernation, under the control of hormones which stimulate lipid storage. In mice induced to enter a near-torpid state, levels of leptin are low, reducing lipolysis and promoting lipid storage. However, BMR is lowered in the little brown bat (Myotis lucifugus; Figure 9), despite an increase in plasma leptin during the pre-hibernation period which suggests that weight gain is controlled by other hormones together with a resistance to leptin-induced satiety in this species.
5.2 Energy sources in torpor and hibernation
For animals that show daily torpor, such as Siberian hamsters (Phodopus sungorus) and Djungarian hamsters (Phodopus campbelli) (Figure 28), blood glucose remains the respiratory fuel for several hours following its onset. Thereafter there is a gradual reduction in respiratory quotient (RQ) indicating a change to lipid metabolism as the metabolic rate is reduced.
There are some exceptions to the rule that lipids are the energy source of hibernation. Arctic ground squirrels (Spermophilus parryii) overwinter in hibernacula at temperatures that are substantially below freezing, whilst maintaining a T b at or just below 0° C. In laboratory studies, an increase in RQ from 0.71 towards 0.85–0.90, together with a fall in the amount of stored glycogen in liver and muscle, has been measured on entry to hibernation. Together, these changes point to a switch to glucose as the principal energy source.
Question 13
Why might carbohydrates be required as fuels in some hibernators?
Answer
First, following arousal episodes, glucose-utilizing tissues such as brain and blood cells would have a specific energy requirement that cannot be met by stored lipids. Secondly, there is a need to replenish lipids within BAT for the substantial needs of NST at the next arousal episode.
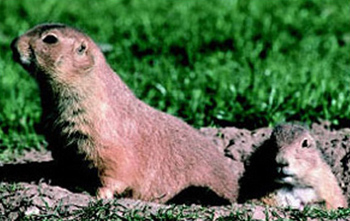
The latter need is not met from stored glycogen, but from gluconeogenesis, the biosynthesis of glucose from amino acids. The provision of amino acids requires the breakdown of muscle protein that contributes to the weight loss seen in many hibernators. The pattern of hibernation is frequently related to the combination of lipids with protein as the prime metabolic fuels. Black-tailed prairie dogs (Cynomys ludovicianus; Figure 7), whose diet is rich in polyunsaturated fatty acids (PUFA) and which use protein as a source of energy in the winter only during periods of reproductive activity, enter shallow torpor only infrequently and do not hibernate continuously between autumn and spring. However, the duration of torpor and size of the reduction of T b during hibernation can be increased by increasing the dietary intake of PUFA during the period before entry.
Arctic ground squirrels are capable of cooling their T b to −3° C, while simultaneously keeping the parts of the body involved in regulation and maintaining energy metabolism – the brain and intercapsular BAT – above zero. This ability shows that metabolic rate is regulated independently of body temperature, a conclusion which is further borne out by the data in Figure 29 (Buck and Barnes, 2000).
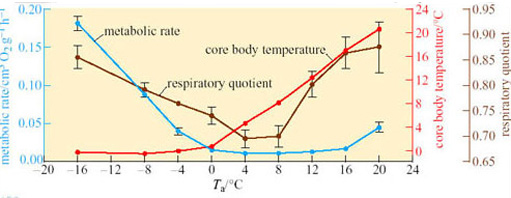
Between T a values of −16° C and 0, T b remains relatively constant but metabolic rate rises over 15-fold as the difference between T a and T b increases. At T a 0 to 20° C, T b increases with T a; however, metabolic rate does not change significantly from a T b of 0° C up to a critical temperature of 12° C, indicating the existence of a temperature-independent inhibition of metabolic rate.
Question 14
How do you interpret the change in respiratory quotient over the range of T a used in the investigation shown in Figure 29?
Answer
For most mammals, hibernation requires a shift away from the oxidation of carbohydrates and towards the oxidation of fatty acids released from stored triacylglycerols as the primary source of energy during torpor (see Box 1).
In 13-lined ground squirrels, the activity of PDK4 is elevated between three and eight-fold by increased translation of specific mRNA in three tissues important in energy metabolism – heart, skeletal muscle and WAT – during entry to torpor. It is important to bear in mind that translation of this gene, as well as that of a small number of other gene products (see Section 4), is selectively increased against a background of greatly reduced translational activity. This observation also points to the possibility of tissue-specific differences in the levels of biosynthesis of metabolically critical proteins.
5.3 Mitochondrial adaptations
During the winter months, whilst hibernating vertebrates maintain a very low metabolic rate, major reorganization of mitochondrial metabolism occurs. The phenomenon has been studied in some detail in frogs which, although not hibernators in the true sense, can endure very low water temperatures under the conditions of profound hypoxia that exist when they lie dormant for long periods below the surface. In contrast to normoxic conditions, the muscle mitochondria of dormant frogs depress their metabolic rate by up to 75%. Since muscles comprise a large part of the body mass, depression of their mitochondria decreases the overall oxidative metabolism of the frog profoundly. Although uptake of oxygen into mitochondria is decreased both in normoxic hypothermia and in the anoxic conditions of dormant frogs, only in the latter are long-term adaptations observed. Such adaptations include an increased affinity of mitochondria for dissolved oxygen, a reduction in the activity of mitochondrial enzymes, a reduction in the activity of the electron transfer chain and a reduction in the proton leak across the inner mitochondrial membrane.
In normoxic mammalian muscle mitochondria, it has been estimated that over 30% of the standard metabolic rate comprises the movement of protons into the mitochondrial matrix which is uncoupled from ATP synthesis (see Section 3.4). The electrochemical gradient (and hence the potential energy available from oxidative phosphorylation) across the inner mitochondrial membrane is maintained by the ‘proton-motive force’ (PMF), measurable as the potential difference across the membrane. At a time when energy substrate is very scarce, the proton leak is counterproductive for energy conservation.
To reduce energy wastage, the inner membrane ATP-synthase in frog muscle begins to catalyse the reverse reaction, releasing energy by ATP hydrolysis, to maintain the proton gradient across the membrane. The small amount of energy required to reduce the cycling of protons to a level equalling their rate of supply from the electron transfer chain is more than compensated for by the increased efficiency of the anoxic mitochondrion. This principle is illustrated in Figure 30. Under normoxic conditions, the passive flow of protons from the intermembrane space of the mitochodrion into the matrix is increased as the potential difference across the membrane rises. This gradient is nearly absent in the anoxic mitochondrion (Boutilier and St-Pierre, 2002).
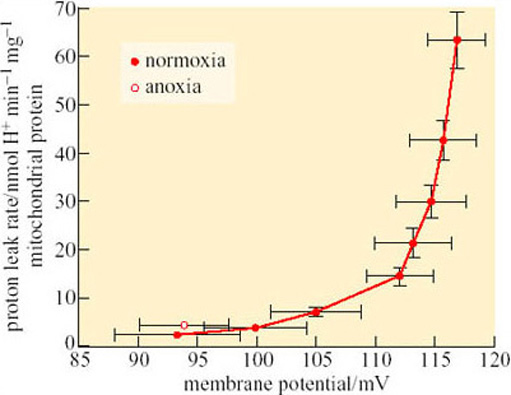
It is not surprising that this phenomenon is also seen in mammals that hibernate on land, such as the arctic ground squirrel. The supply of lipid to the mitochondria of the heart and BAT is substantially increased during hibernation, as shown by the increased production of fatty-acid binding proteins that deliver fatty acids to the enzyme complex catalysing β-oxidation.
5.4 Inspiratory drive
The supply of oxygen to tissues such as the heart, liver and WAT is, under euthermic conditions, invariably linked to and dependent upon local blood flow and pulmonary function. However, as we have already seen, under conditions in which blood flow is reduced to a trickle, the control of energy supply switches to local adaptations in the capillaries and tissue cells, including the oxygen affinity of erythrocyte haemoglobin, the supply and metabolism of respiratory fuels and the rate of protein synthesis. In contrast to the highly regulated phenomena of hypothermia and bradymetabolism, regulation of lung function is passive and follows directly from the primary regulation of T b.
Artificially induced hypothermia to mimic hibernation (Figure 31) is elegantly illustrated in the golden-mantled ground squirrel (Spermophilus lateralis) (Zimmer and Milson, 2002). On entry to a torpor bout, the normal regular pattern of breathing becomes episodic with periods of around 25 breaths being followed by up to 30 minutes of apnoea (Figure 31a). Although breathing frequency becomes lower and periods of apnoea lengthen, the basic pattern persists into steady state-hibernation from a T b of 20.2° C down to 5.3° C. Thereafter, as T a decreases and T b falls below 6° C during hibernation, the episodic pattern converts to one of slow, evenly spaced single breaths. Cooling is induced in euthermic squirrels using a combination of two anaesthetics which increase thermal conductance and suppress NST. The animals are cooled whilst anaesthetic levels are reduced and then withdrawn as T a reaches 10.2° C.
Severe hypothermia reproduced the patterns of breathing seen on entry to hibernation with a fall in oxygen consumption and carbon dioxide excretion to around 0.2% of their euthermic levels (Figure 31b). These changes were reflected in a similar reduction in heart rate, suggesting that hypothermia triggers changes in both the cardiovascular and inspiratory control centres of the brain. In hibernation, however, respiratory responses to reduced circulating levels of oxygen (hypoxia) and increased carbon dioxide (hypercapnia) are still evident, whilst in induced hypothermia, only the latter is present. These data indicate that the ability to sense tissue oxygen levels in hibernation is regulated independently ofT b.
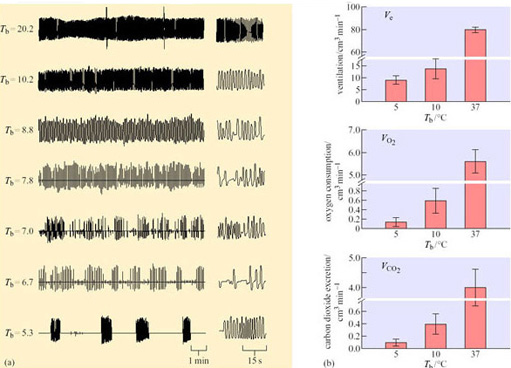
5.5 Energy budgeting – the benefits of hibernation and torpor
Studies performed on ground squirrels in the wild and in the laboratory have allowed estimates to be made of energy expenditure in hibernating and euthermic animals over similar periods (Wang, 1987). The average time spent by Richardson's ground squirrel in a periodic arousal in the wild is about 10 hours and the frequency of arousal decreases during November-March, when animals are spending more than 90% of their time in torpor. Monthly total oxygen consumption in January is about 35% of that in August, and rises again in February and March. Between July and March, entry into hibernation accounts for 27% of total energy expenditure, torpor for 33% and arousal for 40%. However, if the time between periods of torpor is taken into account, the figures are 12% for entry, 17% for torpor and 19% for actual arousal with 51% for the euthermic periods between arousals.
Entry into hibernation seems to cost little. Entry and the hibernation period together account for less than one-third of the total energy expenditure averaged over the whole 9-month period. Arousal in itself is not that expensive (less than 20%). It is the time between bouts of hibernation, when the animal is euthermic, that consumes more than 50% of the energy expended, though the amount varies between months. In December and January for example, entry and torpor account for more than 35%, and time in euthermia for about 40% of the energy expended.
We have estimates of how hibernators apportion expenditure throughout the hibernating season. But how do the figures compare with figures from similar individuals that are euthermic over the same period? Wang's estimates are given in Table 5. From August through to February, the savings due to hibernation are over 80%. Even in July and March, months in which arousal frequency is high and time in torpor is short, the savings are significant. On average over 9 months, hibernation endows a small mammal, such as this ground squirrel, with an 88% saving of energy. Over an entire year, the hibernating habit saves an animal 60% of the energy used by an individual of similar size that continuously maintains the euthermic condition.
| Month | Total energy expenditure with torpor/cm3 O2 month−1 | Total energy expenditure if animal remained euthermic/cm3 O2 per month | % energy saved by exhibiting torpor |
|---|---|---|---|
| July | 382 | 162 | 38.0* |
| August | 592 | 323 | 81.6 |
| September | 452 | 313 | 85.4 |
| October | 372 | 372 | 89.9 |
| November | 312 | 432 | 92.7 |
| December | 262 | 542 | 95.1 |
| January | 221 | 555 | 96.0 |
| February | 332 | 501 | 93.3 |
| March | 762 | 394 | 51.2* |
| mean for 9 months | 87.8 |
Note: * During parts of July and March the animal is not in hibernation, hence these values are low. When calculating the % energy saved by exhibiting torpor, it was assumed that the animals were hibernating for the equivalent of only half of these 2 months, i.e. a total of 8 months in the year.
A study of a close relation, the golden-mantled ground squirrel, showed that, during the hibernating season, energy expenditure in this particular species was also only 20% of the expected value if the animal remained euthermic. Furthermore, the energy consumption throughout the 7 months of the hibernating season was only 15% of the total annual consumption.
Both these species fit our earlier definition of obligative, deep hibernators; the picture may be a little different in facultative hibernators responding more directly to environmental cues. Using one such animal, the golden hamster (Mesocricetus auratus), the energy budgets of a whole population in the laboratory were estimated. The hibernating behaviour of individuals varied widely. The average for the group was that only 18% of the ‘hibernating season’ was spent in torpor, though this value might not be representative of a wild population. However, when in torpor their energy consumption was only 9% of normal euthermic consumption at that temperature. Overall, the group saved 23% of the energy they would have used without torpor, still quite a significant figure.
Question 15
What are the disadvantages to an animal in entering torpor, or full seasonal hibernation?
Answer
The animal becomes very vulnerable to predators. A deep hibernator may take quite a long time to respond even to an alarm arousal. Also, unless the ‘cold alarm arousal’ is efficient, the T b may go below the point from which it can recover.
The energy cost of hibernation must also take into account the special requirements of females in gestating and caring for the young. Their T b fluctuations, torpor bout duration and BMR often differ from those of males of the same species. In pregnant female black bears (Ursus americanus) in the North American Rocky Mountains, the cost of winter reproduction, including gestation and lactation, was found to be 1432 kJ day−1 to produce two young. Fat provides 92% of the total energy for lactation and gestation during early winter. Consequently, these animals have 89% larger fat depots than have non-reproductive females entering hibernation. The rate of fat loss was 37% greater, and protein loss was about 2.4 times higher for reproductive females than for non-reproductive females. Protein utilization is a last resort in any hibernating animal due to the danger of nitrogen toxicity and the disadvantages of muscle weakness on arousal. However, a source of transplacental amino acids is essential even when the mother is not feeding. Black bears minimize this cost by having a shorter period of post-implantation gestation together with metabolic pathways that enable them to hydrolyse urea and recycle their nitrogen more effectively than other mammals (The openLearn course on Polar biology (S324_3) covers this in more detail).
5.6 The importance of size and habitat
The use of hibernation to gain energetic advantage must be weighed against a number of considerations, particularly animal size and behaviour, biogeographic distribution and habitat. Small animals, which can carry less fat and have a higher surface area to volume ratio and BMR, are more likely to lose energy as heat and in maintaining life functions if they do not use hypothermic strategies in winter. Few hibernating mammals have a total body mass greater than 5 kg. Indeed, in large animals there may be a cost advantage in not hibernating as less energy is likely to be needed to see them through the winter in a prolonged state of fasting close to a thermoneutral T a, than in hibernation with re-warming. For example, an adult bear's re-warming energy cost is 105 greater than that of a mouse and the energy required for re-warming is equivalent to the energy needed to remain euthermic for nearly 3 days (compared to 3 hours in the mouse).
The importance of size is balanced by the importance of the habitat, and by the ability of animals to evolve their thermoregulatory strategy to match ecological energy demands, enables them to diversify just as much as their foraging and locomotion techniques. Pigeons and doves (Columbidae) for example, belong to a large (300 species) family of birds that shows remarkable ecological diversity. Hypothermic strategies are used by species whose adults range in mass from 35 to 800 g. An implanted temperature-sensitive transmitter was used to measure T b, and a flow-through respirometer for V O2 and V CO2. Cloven-feathered doves (Drepanoptila holosericea) are fruit-eating birds from the island of New Caledonia, and the effects of food on the energy metabolism of the only captive pair in the world were compared with the effects on grain-eating African Namaqua doves (Oena capensis) which are adapted to arid desert habitats. Namaqua doves show shallow torpor in response to food deprivation, with T b falling to 30–37° C: there was a fluctuation of T b with T a, but a metabolic defence at T a below 25° C. This regulation is reflected by the increase of metabolic rate at low T a (Figure 43a). This exercise saves them around 10% of their daily energy requirements. In contrast, cloven-feathered doves (Figure 32b) show a more pronounced onset of deep torpor (with T b falling to between 24 and 30° C), induced by darkness at T a lower than 15° C, and leading to a substantial reduction in metabolic rate of up to 62%. However, this torpor only lasts up to 3 hours as the process of cooling is also several hours in duration. Total daily energy consumption is reduced by a comparable amount (10–15%), including the cost of re-warming. The very different form of thermoregulation in the cloven-feathered dove therefore, has very little energy budget advantage and may instead be an adaptation to its island habitat together with its fruit diet, that may make it difficult to find food at certain times of the year.
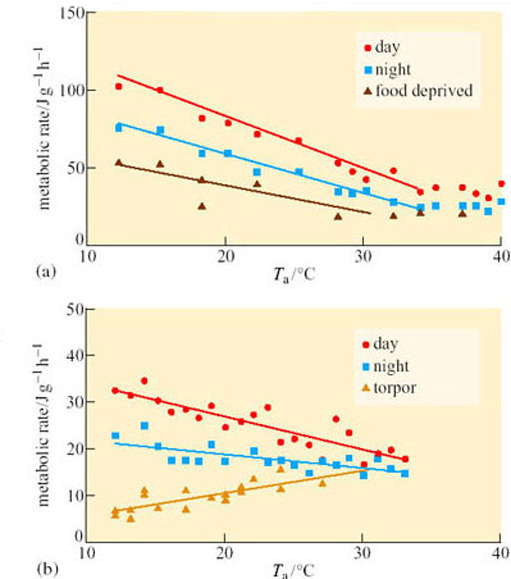
Further evidence that energy budgeting varies with habitat comes from work on mouse-eared bats (Myotis myotis) (Koteja, 2001). Using a non-invasive method called Total Body Electric Conductivity (TOBEC), lean body mass and fat content were measured in hibernating animals either in buildings or caves in Poland (Figure 33). Although food availability was similar in each habitat, fat content was reduced from 19 to 6% of total body mass between December and April in both males and females. Calculations showed that the bats need about 4.9 g of fat (191 kJ) to sustain a 165-day hibernation. However, the rate of fat usage varied considerably between different sites and at different phases of hibernation. Although the average amount of fat remaining in April would be sufficient to support at least six more weeks of hibernation, the level of reserves was close to zero in some individuals.
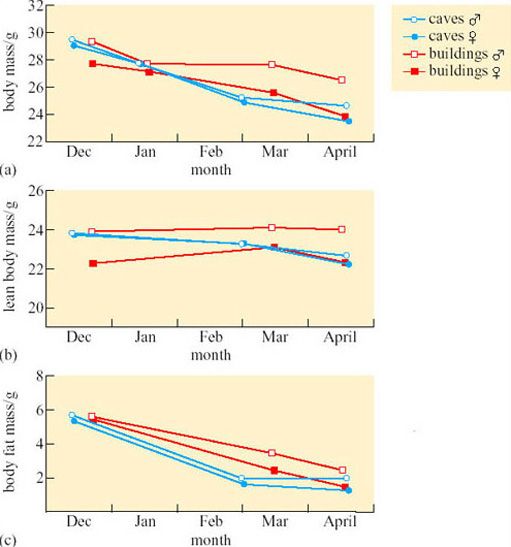
A model has recently been drawn up to predict the relative energetic advantages of hibernation in little brown bats (Myotis lucifugus; Figure 9) living in different latitudes. T a at each latitude influences total winter energy requirements. Hibernation is only likely to confer bioenergetic advantages within a fairly narrow range of winter durations for animals living at favourable hibernaculum temperatures. As it turns out, M. lucifugus lives no further north than predicted by the model and so hibernation energetics could be the most important factor governing its geographic range, of this species at least. It follows that the consequence of global warming might be a northward expansion of the species within only two or three generations.
5.7 Summary
BMR is regulated independently of T b at least in hibernating mammals. Entry into hibernation is characterized by a gradual fall in RQ, which indicates a switch from carbohydrate to lipid metabolism for energy provision (through the phosphorylation of pyruvate dehydrogenase, the inhibitor of mitochondrial fatty acid uptake). There is evidence that some other vertebrates, such as hibernating frogs, may continue to use carbohydrate catabolism or activate gluconeogenic pathways when arousal episodes completely deplete stored triacylglycerols.
The most important adaptive modifications of the mitochondrion are reduced oxidative metabolism, the reversal of the proton leak across the inner membrane as an energy-saving mechanism during hibernation, and an increase in production of uncoupling proteins (UCP) in preparation for metabolic thermogenesis during arousal episodes.
Lung ventilation is linked to oxygen supply in euthermic animals, but in hibernation where tissue blood flow is almost absent it becomes less important. The characteristic inspiratory patterns of hibernation, as well as the fall in heart rate, have been shown to follow passively from the depression ofT b.
The energy budget of mammals for euthermia, torpor and arousal can be estimated both in the laboratory and natural habitats. For small mammals that are obligate hibernators, energy saving is in excess of 80% for the winter months and about 60% averaged over the year. Lactation and gestation can stretch the energy budget of female mammals considerably, and they may display further adaptations to minimize the cost. Hibernation should not, however, be seen as the universal solution for energy saving in winter and considerations of size, behaviour pattern and habitat all have an effect upon the useful duration of torpor bouts or whether torpor is an appropriate strategy at all. Hibernation physiology may be a major factor in determining the biogeographical and ecological diversity of mammals and perhaps other vertebrates.
6 Control systems
6.1 Introduction
Measurements of thermoregulation, respiration and metabolic depression in the edible dormouse (Myoxus glis) during the early stages of torpor, hibernation and aestivation, indicate remarkable similarities in the profile of physiological changes for all three adaptive phenomena, suggesting that they are controlled by essentially the same mechanism. The capacity for adaptive hypothermia in animals is clearly determined genetically and is manifested in cells from many different tissues. Nevertheless, we have known for a long time that control centres in the brain exist which coordinate behavioural (feeding, drinking, reproductive) as well as physiological (circulatory, respiratory) functions, and establish cyclical rhythms for these functions which relate them to daily, monthly and seasonal changes in an animal's habitat.
Question 16
What three functions must the brain fulfil to achieve this coordination?
Answer
It must act as a central receptor, integrating signals such as ambient light levels, daylength and temperature with internal indicators of physiological state.
It must contain an internal ‘clock’ that can be set to operate with reference to environmental changes.
It must contain command centres, which adjust body temperature, metabolism, respiration, circulation and behaviour to adapt to prevailing conditions in the habitat.
6.2 The hypothalamus as central regulator
Research in the past 30–40 years has established that the hypothalamus, which lies below the thalamus and above the optic nerve chiasma and the pituitary gland in the brain, fulfils all of the functions listed above, at least in part. The main function of the hypothalamus is homeostasis. Factors such as blood pressure, body temperature, fluid and electrolyte balance, and body weight are held to constant values called the set-points. Although set-points can vary over time, from day to day they are remarkably fixed.
The hypothalamus is an internal regulator of biorhythms. The supraoptic nucleus (SON) is found just above the optic tract in both brain hemispheres (Figure 35). It is the site of the ‘clock’ in mammals that sets an internal daily (circadian) and annual rhythm by which body functions such as metabolism, core body temperature, reproductive physiology and locomotive behaviour are governed. The endogenous rhythms of SON nerve cells are entrained to environmental cues such as daylength with reference to sensory signals from peripheral sense organs, particularly the eyes and light-sensitive receptors within the brain itself. The onset of torpor and hibernation seem to occur in golden hamsters (Mesocricetus auratus) during the active phase of the circadian cycle, but hamsters of the same species but with genotypes causing longer or shorter natural circadian rhythms did not experience different bout-lengths of torpor. Thus the hypothalamic oscillator relinquishes control over the timing of hibernation bouts once they have started. It seems likely that during hibernation, the ventromedial hypothalamus, close to the midline of the brain, becomes more important in thermoregulation.
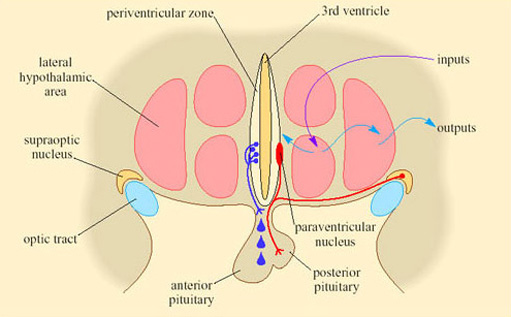
Figure 35a shows an experiment with a marmot (Marmota flaviventris) in its euthermic phase, in which whole-body metabolic rate is measured using a calorimeter, whilst the temperature of the hypothalamus, T hy, is being both adjusted and monitored in the conscious animal using a water-filled catheter and a thermocouple. When T hy is lowered below 36.5° C, metabolic rate increases with an intensity proportional to the difference between T hy and the threshold temperature. Figure 35b is the response in another individual, which is in hibernation at a T a of 5° C.
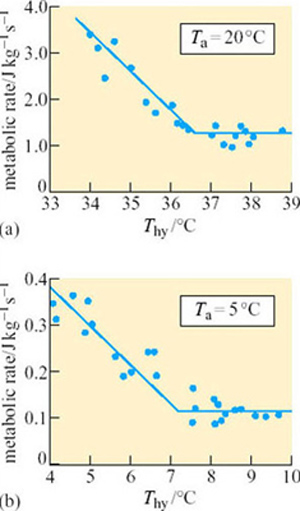
Question 17
What do you deduce from Figure 35b?
Answer
The shape of the curve is identical to that in Figure 35a, suggesting that metabolic rate changes at a threshold temperature during hibernation as well. However, there are two striking differences. First, the threshold temperature in the hibernating marmot is about 7° C, compared with 36.5° C in the euthermic marmot. Secondly, the metabolic rate is much lower (10% of that in the euthermic marmot) though the response to lowered T hy (a fourfold increase) is about the same. These experiments show that the hypothalamus is a thermosensitive centre which is linked to effector systems that raise the metabolic rate (and produce heat). The temperature set-point has been lowered from the normal level of 37° C in the hibernating animal but the proportional metabolic response to lowering the temperature below the threshold is the same in euthermic and hibernating animals.
In the dormouse (Muscardinus avellanarius), which hibernates on its back with hind legs exposed, it is possible to cool the feet in the same way using double-layered, jacketed half-boots in which a temperature-controlled liquid can be pumped between the two layers of the boot. With this device, the temperature of the hind feet could be altered without affecting deep-body or brain temperature. It was found that, irrespective of T hy, cooling the hind feet stimulated an increase in the metabolic heat response. This observation implies that the mechanism governing the set-point may not always reside in the pre-optic area of the anterior hypothalamus (POAH). Recent studies in rats, in which BAT thermogenesis was measured in response to direct electrical stimulation of the central nervous system (CNS), suggest that there are groups of nerve cells forming thermoregulatory centres at many sites in the brain and spinal cord.
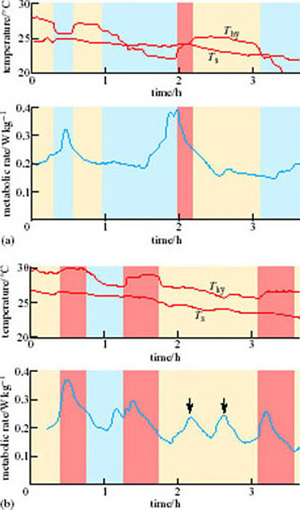
How is the progressive reduction of temperature accomplished during entry into hibernation? It might be that the set-point remains in operation, but that its value is steadily shifted downwards. The following experiments, performed by Florant and Heller (1977), explore these possibilities. By manipulating T hy of marmots (Marmota flaviventris) entering a bout of torpor, he was able to determine absolute values for the T hy threshold (T set), and see how these indices changed with time. Figure 36 shows such an experiment in two individuals. T hy is varied, using a catheter arrangement and Ts (the skin temperature) is measured. The metabolic response is indicated on the lower traces. The marmot in Figure 36a is entering hibernation fairly smoothly, whereas, as judged by the frequent bursts of high metabolic rate (see arrows), the marmot in Figure 36b is progressing into hibernation rather irregularly. The cream and blue bands on each figure indicate the periods during which T hy was being manipulated (lowered (cream) and raised (blue), respectively). Take the left-hand trace (a) first. Depressing T hy in the early stages stimulates an increase in metabolic response, but 30 minutes later, the same decrease in T hy has no effect on metabolic rate. This experiment suggests that the threshold temperature has fallen from 22–27° C to 23–24° C in 30 minutes. At 3 hours into hibernation, lowering the Thy even below 23° C has little effect initially on metabolic rate. In the right-hand trace (b), Ts also declines with time but is consistently above the manipulated T hy, as indicated by the bursts of metabolic activity. Therefore, at any one time, the threshold may be above or below the actual T hy. If the threshold is above it, the entrance is irregular, interrupted by bursts of metabolic heat production which slow the fall in T b. Florant and Heller concluded that the rate of entry into hibernation is limited by the rate at which threshold T hy falls. It seems, therefore, that entrance into hibernation and the lowering of T b are controlled events. Using experimental data such as those gained from Figure 36, it is possible to plot the declining threshold temperature. Figure 37 (Heller et al., 1977) shows such a plot for a golden-mantled ground squirrel entering hibernation. The filled circles represent actual hypothalamic temperatures at specific times during entry. Manipulation of T hy reveals that the threshold for metabolic heat production is somewhere in the range indicated by the vertical line below each dot. This process of continuously varying the controlled level of a feedback system has been called rheostasis, to distinguish it from homeostasis, which has implications of a fixed set-point.
The model exemplified by the ground squirrel entering hibernation may not, however, represent a universal phenomenon. In the eastern chipmunk (Tamias striatus), a facultative hibernator, a gradual, controlled decline in Ts on entering hibernation is often absent. Manipulating the hypothalamic temperature may have no effect in chipmunks hibernating with a T b of about 4° C, until about 2.1° C is reached (which is T alarm for this animal), when there is full arousal (Figure 38) (Wang and Hudson, 1971). Thus, the animal has the ability to increase thermogenesis when cold as a result of T hy falling too low, but does not normally control and defend Th above the T alarm level – at least not as a result of changes in hypothalamic temperature.
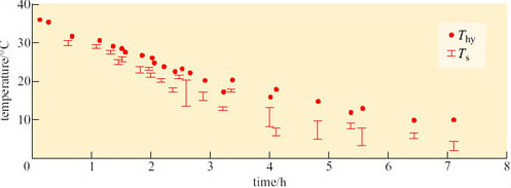
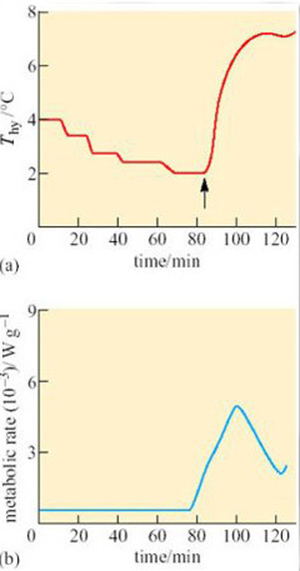
6.3 Metabolic regulation and the midbrain
As you found in the last section, the physiological evidence points to the likelihood that different components of regulation may be regulated separately. The hypothalamus, which appears to be central to the depression and recovery of body temperature during entry to torpor and arousal, is not the only player in the control of metabolic processes underlying non-behavioural thermogenesis. In many respects, the initiation of thermogenesis is the prime event in the reactivation of a cold body: the control mechanism which stands at the point of energy balance between dormancy and coma or even death. Centres of the brain involved in this process are likely to be efficiently protected from cooling to a critical temperature, beyond which electrical conduction and synaptic trans-mission are impossible. We do not yet know how such protection is possible in animals in hibernation, but it is clear that there is no single region of the brain with a monopoly on control of NST. The ventromedial hypothalamic nucleus is the major centre of the forebrain which stimulates the oxidation of fat in BAT as indicated by thermography studies on interscapular temperature (see Figure 21). But there is evidence that the operation of central activation mechanisms is balanced by regions that inhibit thermogenesis. Figure 39 (Hashimoto et al, 2002) shows that in a small region of the midbrain connected to the hypothalamus, electrical stimulation suppresses, whereas an injection of an anaesthetic increases T b.
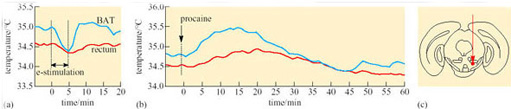
It was once believed that arousal from torpor was initiated by an increase in T b, a process which was ‘paid for’ by a period of intense feeding to generate metabolic energy. The presence of an elaborate interplay between activation and inhibition of NST underlines the fact that considerable accuracy in thermogenic controls can exist for an animal within its existing limited energy budget during torpor. Such controls could not only make possible the kind of very rapid adjustments seen in Figure 27, but also contribute to the mechanisms that maintain a safe minimum BMR within the key regions of the brain.
6.4 Rapid-response genes and rhythmic neuronal activity
Reactive changes in the brain are usually marked by changes in neuronal electrical activity. If these changes are to be of long duration, adjustments in neuronal electrical behaviour may be made through changes in gene expression. Rapid-response genes (sometimes called ‘immediate-early’ genes) are activated within minutes of the onset of such sustained electrical activity. These genes are master controls, acting as a gateway to a series of linked events: alteration of electrical firing patterns, repetitive activity and even the structure of neurons and their synapses, all of which modify the output of specific functional groups of nerve cells. Two such genes, called c-fos and junB, whose expression pattern in the SON follows the circadian rhythm in euthermic jerboas (Jaculus orientalis), cease cyclical fluctuations and remain at constant, elevated levels in the hypothalamus during bouts of hibernation. The region containing the largest number of c-fos-positive neurons in the hibernating jerboa is called the arcuate nucleus (Figure 40a). As hibernation progresses, and then on arousal, the distribution of c-fos-positive cells shifts to the ventromedial hypothalamus (Figures 4.39b and c). The significance of this observation is that separate regions of the brain are involved in maintenance of the hibernating state and initiation of locomotor activity on arousal (Ouezzani et al., 1999).
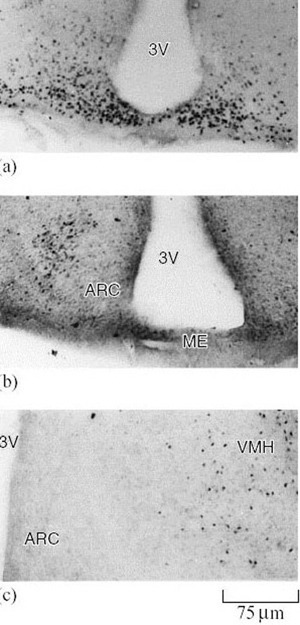
Question 18
Where else might you expect to see c-fos-positive cells in the brain on emergence from hibernation?
Answer
In regions involved in initiating motor activity to the muscles.
Since the expression of both c-fos and junB genes changes in advance of alterations in neuronal behaviour, they are likely to act as signals for the re-emergence of euthermic electrical activity patterns on arousal. It is significant that the high levels of expression are located in the arcuate nucleus, separate from the SON, which could therefore be an independent regulator of locomotor activity. During hibernation, the lowest temperature for electrical activity of hypothalamic neurons is depressed from around 16° C to 12.3° C and there is an increase in the number of cold-sensitive neurons. In the European hamster (Cricetus cricetus), neurons in isolated slices of the hypothalamus can fire quite normally down to temperatures as low as 5° C as a result of changes in the molecular configuration of ion channels in the cell membrane. Such an adaptation is particularly important because neural control systems must be intact at brain temperatures that prevail on entry to, and during arousal from, hibernation. The structure of neuronal dendrites (see Figure 41a) is also modified to reduce incoming synaptic contacts. All three changes result from subtle alterations in the expression of genes specific to neurons.
6.5 The neurotransmitters histamine and serotonin: a role for chemical signalling between neurons of the hypothalamus
As in all other regions of the brain, the integration of physiological change in the hypothalamus, conducted by the dialogue between many thousands of nerve cells, is the result of transmissions across chemical synapses. The functions of the hypothalamus are therefore dependent upon neurotransmission by a number of different chemical mediators and are critically dependent on the balance between their respective activities. Monoamine neurotransmitters (histamine and serotonin) operate in subgroups of hypothalamic nerve cells (as well as neurons in other parts of the brain) and appear to be particularly important to the regulation of hibernation.
The possibility that histamine is a natural inducer of hibernation is supported by the observation that the neurotransmitter becomes detectable in complex networks of neuronal axons during hibernation, whereas it is absent or present at undetectable levels in euthermic animals (Figure 41b). The evidence for an increase in synaptic transmission by this specific neurotransmitter is seen in the light of the anatomical evidence from Figure 41a. The reduction of synaptic branching in torpor suggests that normal synapse activity is lost during torpor. The hippocampus is an area of the brain that controls arousal levels and in which histamine neurons are more prominent during hibernation. Injection of histamine into the hippocampus of ground squirrels (Spermophilus lateralis) increased the duration of hibernation bouts by over 50% (Figure 41c). Histamine is also believed to affect the response of the SCN to environmental stimuli, modifying circadian rhythm phase. Changes in phase responses to light can be increased by injecting histamine into the SCN and reduced by depleting the brain of histamine. These findings may help to explain the ability of histamine to prolong hibernation and show that histamine in different areas of the brain affects different aspects of the hibernation process.
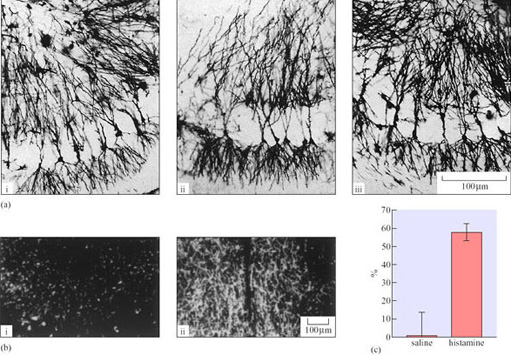
Figure 41 (a) Reversible restructuring of dendrites that is found in the hippocampus of a ground squirrel when (i) active, (ii) torpid and (iii) on arousal. The reduction of branching, and in the number of ‘spines’ which receive incoming synapses, indicate that processing of activity at many chemical synapses is drastically reduced during torpor (Popov et al., 1992). (b) Distribution of histamine-containing nerve fibres in the hippocampus of a euthermic (i) and hibernating (ii) ground squirrel, as visualized for fluorescence microscopy with an antibody recognizing histamine (Panula, 2002). (c) Effect of the infusion of saline and histamine through a cannula into the dorsal hippocampus of each animal in a group of ground squirrels on the hibernation bout length. The bout length is expressed as a percentage of the expected remaining time in the bout at the time of the start of the infusion. Data are expressed as means ±SE (Sallmen et al., 2003).
The activity of tryptophan hydroxylase (TPH), a key enzyme in the biosynthesis of another monoamine transmitter, serotonin, undergoes marked changes in the brain during entry into hibernation, and arousal in Spermophilus erythrogenys. An increase in TPH activity was found in several regions of the brain during the pre-hibernation period in euthermic ground squirrels. A further increase in TPH activity to 150% was observed during the entry into hibernation. Significant elevation was found not only in potential TPH activity measured at the incubation temperature of 37° C but also at incubation temperature of 7° C, approximating the body temperature in hibernation. Serotonin may also contribute to the chemical induction and maintenance of hibernation.
6.6 Hormones and hibernation
6.6.1 Melatonin
Syrian hamsters, which display pronounced circadian temperature fluctuations before hibernation, lose these circadian cycles on entry to hibernation, and start to regain them shortly before arousal. Cycles are distorted during the early recovery period, suggesting that the SON oscillator has either been switched off or de-synchronized in hibernation. Another monoamine, melatonin, is involved in making these adjustments. A hormone rather than a neurotransmitter, melatonin is secreted by the pineal gland on the dorsal side of the brain. Removal of this gland can cause disturbances in both the ‘clock’ and the ‘calendar’ settings of mammals. Melatonin travels both to the pre-optic area of the hypothalamus, where it can reset the set-point for Tb, and to the SON where it can adjust circadian and seasonal rhythms. Continuous infusion of melatonin inhibitor into the circulation from subcutaneous implants can lead to a decrease in the duration of bouts of torpor in hibernating ground squirrels (Figure 42) (Pitrosky et al., 2003). A second important function of melatonin is to inhibit sexual activity and the production of gonadal steroid hormones through the mediation of the pituitary gland, which is itself under the control of neurons within the hypothalamus. Both events appear to be under the principal control of the SON, since its destruction by electrolytic lesions leads to an impairment of circadian rhythms and the ability to hibernate. More recently it was shown that an inhibitor of melatonin, on the other hand, can decrease the duration of hibernation by reducing both the number of hypothermic bouts and the amount of lipid present in BAT.
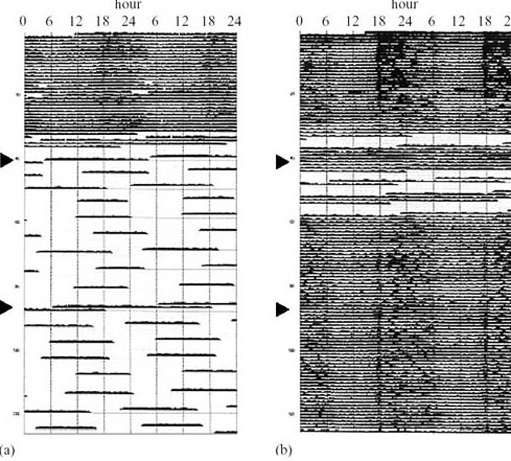
6.6.2 Hibernation-induction trigger
Researchers have devoted much effort to the search for a possible blood-borne chemical messenger that might communicate a signal within the brain and to other body tissues, causing entry to hibernation. Serum from hibernating animals such as the woodchuck (Marmota monax; Figure 8), when injected into active animals, can induce torpor. Partly purified serum extracts are also able to induce hibernation-like behavioural changes in a variety of mammalian species. Chemical analysis of the serum extracts reveals two components, one of high molecular mass (M r = 88 000) which has a structure closely resembling a natural protease inhibitor, and the other of low molecular mass (M r Spermophilus columbianus). Dynorphin A is another opioid present in the ground squirrel brain. It acts at so-called delta receptor sites similar to those for enkephalin and rises during hibernation to a level 15 times higher than in non-hibernating euthermia, reaching an intermediate level in euthermia between bouts of hibernation. The origin of the different hibernation-inducing trigger components is not certain, but these observations point to the possibility that the blood circulation does contribute to the transmission of the signal to enter hibernation from one tissue to another. Opioids also have remarkable properties in inducing survival of cells in the brain and other organs under anoxic conditions. This discovery has led to an interest in the chemical induction of hibernation amongst medical researchers seeking ways in which to prolong tissue survival after trauma, or during and after transplantion.
6.7 Sleep, the brain and hibernation
There has been a popular misconception that hibernating animals are asleep when dormant, and that arousal during or at the end of hibernation involves waking analogous to that following deep sleep. Sleep in homeothermic animals can be divided into several phases, each with distinct patterns of electrical activity in the brain, as measured by an electroencephalogram (EEG). The passage into sleep is a transition from wakefulness into the stage called slow-wave sleep (SWS). SWS, and its characteristic electrical pattern of brain waves in the frequency range 0.7–4.0 Hz, is interrupted by periods of sleep characterized by, among other things, rapid eye movements, loss of muscle tone in the head and neck, and loss of a shivering response. These periods are known as rapid eye movement (REM) sleep. Dreaming occurs mainly at this time, and blood flow to the brain is markedly increased. The electrical patterns shown in REM sleep are very close to those of wakefulness.
Sleep deprivation and hibernation in Djungarian hamsters both lead to the suppression of slow-wave sleep activity (SWA); probably caused in the latter case by the drop in core body temperature, and a burst of SWA occurs on arousal from hibernation, further supporting the idea that the animal shows the signs of lack of sleep rather than the opposite. Stronger evidence for this theory comes from research showing that hibernation in Richardson's ground squirrel (Spermophilus richardsonii) leads to an accumulation of nearly three times the basal level of oleamide, a derivative of the fatty acid oleic acid, which builds up in the brain during sleep deprivation.
SWA normally follows changes in sleep activity and core body temperature during the REM sleep of euthermic animals, but still exhibits a daily cycle during non-REM sleep. In animals that display bouts of torpor, daily temperature fluctuations continue but sleep and SWA cycles shorten to 25% of their normal length. This change may be required to maintain torpor bouts lasting several days that are typically observed in hibernating mammals. Circadian rhythms are maintained by the SON of the hypothalamus, and thus we would expect that the modification of sleep patterns in hibernators is under neural control from the same brain centre as that which determines cycles in other body functions.
6.8 Summary
Hibernation shares physiological mechanisms with aestivation. These adaptations are fundamental properties of animal cells, but they come under central control and coordination mediated by the vascular, endocrine and central nervous systems.
Neuronal nuclei of the hypothalamus at the base of the forebrain combine the ability to integrate internal and external signals, set biological rhythms and control metabolism and body core temperature, and are indispensable to the process of hibernation. Hibernating animals are characterized by their ability to adjust their core temperature set-point. Experiments on ground squirrels suggest a progressive and smooth decline in the T b set-point (rheostasis), but this is not seen in all species that have been investigated. An alternative strategy is to practice thermogenesis at the point of reaching a T alarm resulting in an explosive increase in metabolism leading to arousal. Displays of apparently spontaneous metabolic thermogenesis, independent of T b, in marmots, is additional evidence that does not support the rheostasis theory for all mammals.
The ability of parts of the hypothalamus to engage in seasonal regulation of physiological functions is indicated by changes in genetic, molecular and structural changes in neurons. Rapid-response genes move from a cyclical to a sustained pattern of expression in parts of the hypothalamus implicated in circadian rhythm generation and locomotor activity. Changes in the numbers of cold-sensitive cells, the organization of neuronal dendrites and the properties of voltage-sensitive ion channels cause long-term changes in the ability of the hypothalamus to process sensory information into appropriate behavioural resonses at low T b. The hypothalamic neurotransmitters histamine and serotonin and the pineal gland hormone melatonin appear to have an important role in synaptic integration during the onset and maintenance of hibernation. A mixture of blood-borne factors have been shown to induce hibernation behaviour in a variety of birds and mammals in plasma transfusion experiments. As well as a large protein component, HIT contains at least one member of the opioid peptide family of neuromodulators.
Hibernation leads to the suppression of slow-wave sleep activity similar to that seen in sleep deprivation. In ground squirrels, the region of the hypothalamus, the SON, which controls the day-night sleep/waking cycle also regulates cyclical changes in T b. The modification of circadian cycles is therefore linked to the overriding need to govern the duration of ‘torpor bouts.
Course Questions
Question 1
Describe three measures of physiological regulation central to hibernation. Using these measures as definitive criteria state why the Svalbard reindeer is not a hibernator.
Answer
The three measures are (a) induction of thermal dormancy, (b) the suppression of behavioural activity and (c) the depression of metabolic activity. Although the Svalbard reindeer becomes behaviourally inactive and ceases feeding in the winter months, its BMR and T b are not depressed as in true hibernators.
Question 2
What reasons might you advance to support the argument that the ability to hibernate might have arisen several times in the evolution of warm-blooded vertebrates?
Answer
Adaptive hypothermia appears to have evolved in birds and in several mammalian orders that are only distantly related. Within single families, the occurrence of torpor is not universal, suggesting adoption of the strategy at species level based on energy cost-benefit considerations. Furthermore, internal and environmentaltriggers for entry to torpor vary considerably between species.
Question 3
From what you have read in Section 3 indicate whether the following statements are true or false. Briefly explain your answer.
(a) The laying down of fat deposits is a criterion for identifying an animal as a hibernator.
(b) The decline in heart rate on entry to hibernation is due to an increase in the number of skipped beats and a lengthening of the period between beats.
(c) The heart and brain are the warmest tissues during arousal.
(d) Although blood pressure is lowered during entry to hibernation, there is evidence for vasoconstriction.
(e) A drop in temperature below a critical level can lead to an increase in heart and respiratory rates but no change in BMR.
Answer
(a) False. Many non-hibernating (e.g. migrating) animals lay down fat on a seasonal basis. Some hibernators store food as well as fat.
(b) True.
(c) False. Although in some species the heart may be the warmest tissue during arousal, thermographic imaging shows that for most mammals, deposits of BAT, which are sources of thermogenesis, are the warmest.
(d) True.
(e) False. Unless BMR increases, the animal will not warm and thus there would be no effective response to the fall in temperature.
Question 4
List the factors that determine (a) entry to hibernation, and (b) length of periods between arousals.
Answer
(a) The main signals that initiate entry into hibernation are environmental, i.e. food supply, day-length and ambient temperature.
(b) Periodic arousal from torpor is sometimes linked to the time of day, although mechanisms for initiating periodic arousal may be diverse. Early arousal may also be initiated by alarm mechanisms, such as mechanical stimuli or a fall in T a to below 0° C. Final arousal is normally independent of T a and may be triggered by endogenous seasonal changes or reduction in fat stores below a critical level.
Question 5
Draw a flow chart indicating the design and outcomes of an experiment which might identify a new enzyme that controls metabolism in hibernating liver cells.
Answer
Your flow chart should show that most or all of the following steps were followed:
Perform subtractive gene expression analysis in an experimental mammalian model using tissue from hibernating and euthermic liver.
Identify genes that are expressed at a higher level in hibernating liver.
Obtain a partial or complete DNA base sequence of one or more of these genes.
Predict an amino-acid sequence for all or part of the encoded protein.
Delete the gene to determine the impact of its absence on liver cell metabolism.
If you have identified a new gene with no existing sequence homologies, you may want to design experiments to determine the function of the protein.
Question 6
Summarize the main changes occurring prior to and during hibernation at the cellular level.
Answer
Protein synthesis is dramatically reduced; cell cross-sectional area is reduced; changes occur in the structure of the Golgi apparatus; there are changes in the numbers of glycogen granules and lipid droplets; membrane-associated proteins undergo redistribution; metabolic processes designed to neutralize reactive oxygen species are activated; there are metabolic changes relating to use of alternative respiratory fuel sources; there is reduced electron transport and protein-leak in mitochondria.
Question 7
From Sections 3 and 5, describe in one sentence each the changes that occur in the heart rate, breathing patterns, blood PCO2 and BMR in hibernating mammals.
Answer
Heart rate is reduced to less than 10 min−1. Breathing is episodic, punctuated by periods of apnoea. Blood P CO2 is increased up to four-fold. BMR drops rapidly at the onset of hibernation. BMR may increase periodically during hibernation despite a sustained low T b. Heart and respiratory rates may increase if T a falls below a critical level.
Question 8
What factors determine the choice of carbohydrate, lipid and protein as respiratory fuel sources in mammals during torpor and hibernation.
Answer
Lipid is the preferred energy source for long-term hibernation. Glucose is the preferred source of energy in the short-term for animals in which torpor episodes last a day or less. Glucose is also used in species that hibernate at ambient temperatures below freezing. Protein is used to supply amino acids for gluconeogenesis when carbohydrate fuel sources are exhausted.
Question 9
What factors determine whether a species gains an advantage in using torpor as an energy-saving measure? Give explanations for the energy-saving figures for July and November in Table 5.
Answer
The factors include the comparative energy cost of maintaining euthermia over a comparable period and the energy savings made possible for costly physiological processes such as gestation. The savings must take into account: animal size; the energy cost of re-warming during arousal; and the nature of the habitat. In Richardson’s ground squirrel, an obligative hibernator (Table 5), energy is saved through periods of torpor both in July and November, but is greatest in November when the difference between T a and T b is larger and the number of arousal episodes is reduced.
Question 10
List two pieces of evidence each for and against the rheostasis theory of thermoregulation on entry to hibernation.
Answer
There are a number of studies that support the rheostasis theory. Two key ones are the experiments on marmots and ground squirrels in Section 6. Experiments on marmots show that there is a steady shift down in the set point when the hypothalamus is cooled. The work on golden-mantled ground squirrels (Figure 36) shows progressive and continuous resetting of the thermostat.
Studies that do not support the rheostasis theory would be that a gradual, controlled decline in T s is not universal, either in different species or within individuals of the same species entering torpor. The theory does not explain the metabolic response to temperature changes applied to the hypothalamus of Eastern chipmunks (Figure 37).
Question 11
What adaptive changes occur in hibernating neurons? What is the evidence that neurons are ‘prepared’ for hibernation as conditions change?
Answer
Rapid-response genes controlling electrical firing activity of neurons are activated, neuronal structure is altered, the critical temperature of firing is depressed, and there is an increase in the number of cold-sensitive neurons. Biosynthesis of histamine and serotonin is also increased. Rapid-response genes are characterized by their activation very soon after the onset of hibernation – they initiate many of the other changes which hibernating neurons undergo, and can thus be viewed as a preparative signal.
Question 12
From the evidence of brain sleep activity patterns, why is the popular concept that hibernating mammals ‘are asleep’ incorrect?
Answer
Slow-wave sleep activity (SWA) is depressed in the brain of hibernating mammals. This is characteristic not of sleep, but of sleep deprivation. SWA activity cycles do not follow normal sleep activity cycles in torpor but become shortened.
Conclusion
This free course provided an introduction to studying Science. It took you through a series of exercises designed to develop your approach to study and learning at a distance and helped to improve your confidence as an independent learner.
References
Further reading
Acknowledgements
The content acknowledged below is Proprietary (see terms and conditions) and is used under licence.
Grateful acknowledgement is made to the following sources for permission to reproduce material in this course:
Course image: Mike Boswell in Flickr made available under Creative Commons Attribution 2.0 Licence.
Figure 2 Michael and Diane Porter, American Goldfinch, Ideaform Inc.;
Figure 3 Tom and Cathy Saxton, Hummingbird, Saxton.org.;
Figure 4 John Franklin, birdinfo@mirrorpole.com;
Figure 5 Art Wolfe/Science Photo Library;
Figure 6 Roger W. Barbour/Morehead State University;
Figure 7 Peter Menzel/Science Photo Library;
Figure 8 Leonard Lee Rue/Science Photo Library;
Figure 9 Roger W. Barbour/Morehead State University;
Figures 10, 14 Strumwasser, F. (1960) Some physiological principles governing hibernation. Bulletin of the Museum of Comparative Zoology, 124, Harvard University;
Figures 11, 19 Lyman, C. P. and O’Brien, R. C. (1960) Circulatory changes in the thirteen-lined ground squirrel during the hibernating cycle. Bulletin of the Museum of Comparative Zoology, 124, Harvard University;
Figures 15, 17 Mussacchia, X. J. and Volkert, W. A. (1971) American Journal of Physiology, 221. American Physiological Society;
Figure 21a and b Hayward, J. and Lyman, C. P. (1967) Nonshivering heat production during arousal from hibernation and evidence for the contribution of brown fat, Fisher, K. et al. (eds), Mammalian Hibernation III. 1967 Oliver and Boyd;
Figure 22 Leming Shi, Ph.D., Principal Investigator at the U.S. FDA’s National Center for Toxicological Research (NCTR), Jefferson, Arkansas;
Figure 24 Erik Z. Yu and John M. Hallenbeck (2002) Elevated arylalkylamine-N acetyltranserase (AA-NAT)…, Molecular Brain Research, 102. Elsevier Science;
Figure 25a, b Frerichs, K. U. and Smith, C. B. et al. (1998) Suppression of protein synthesis in brain…, Proceedings of the National Academy of Sciences, 95. National Academy of Sciences;
Figure 26a Malatesta, M. et al. (2002) Quantitative ultrastructural changes of hepatocyte constituents…, Tissue and Cell, 34. Elsevier Science;
Figure 26b Azzam, N. A., Hallenbeck, J. M. and Kachar, B. (2000) Membrane changes during hibernation, Nature, 407. Nature Publishing Group;
Figure 27a and b Ortmann, S. and Heldmaier, G. (2000) Regulation of body temperature and energy requirements…, American Journal of Physiology, 278. Copyright © American Physiological Society;
Figure 28 Dawn Sadler, Open University;
Figure 29 Buck, C. L. and Barnes, B. M. (2000) Effects of ambient temperature on metabolic rate…, American Journal of Physiology – Regulatory Integrative Comparative Physiology, 279. Copyright © American Physiological Society;
Figure 30 Boutilier, R. G. and St-Pierre, J. (2002) Adaptive plasticity of skeletal muscle energetics in hibernating frogs: mitochondrial proton leak during metabolic depression, Journal of Experimental Biology, 205. Copyright © Company of Biologists Ltd;
Figure 31a and b Zimmer, M. B. and Milsom, W. K. (2002) Ventilatory pattern and chemosensitivity…, Respiratory Physiology and Neurobiology, 113. Elsevier Science;
Figure 32 Schleucher, E. (2001) Heterothermia in pigeons and doves reduces energetic costs, Journal of Thermal Biology, 26. Elsevier Science;
Figure 33 Koteja, P. et al. (2001) Energy balance of hibernating mouse-eared bat Myotis myotis… Acta Theriologica, 46. Polska Akademia Nauk, Zaklad Badania Ssakow;
Figure 34 Diana Weedman Molavi, PhD, Washington University School of Medicine;
Figure 37 Heller, H. C. (1977) Pflugers Archiv, 369, Springer Verlag GmbH & Co KFigureG;
Figure 39 Masaaki Hashimoto et al. (2002) Arousal from hibernation and BAT thermogenesis against cold…, Journal of Thermal Biology, 27. Elsevier Science;
Figure 40 Quezzani, S. E. et al. (1999) Neuronal activity in the mediobasal hypothalamus of hibernating jerboas, Neuroscience Letters, 260. Elsevier Science;
Figure 41a Popov, V. I. (1992) Repeated changes of dendritic morphology in the hippocampus of ground squirrels…, Neuroscience, 48. Elsevier Science;
Figure 41b Panula, P. et al. (2002) The histaminergic system in the brain…, Journal of Chemical Neuranatomy, 18. Elsevier Science;
Figure 41c Sallmen, T. et al. (2003) Intrahippocampal histamine delays arousal from hibernation, Brain Research, 966. Elsevier Science;
Figure 42 Pitrosky, B. et al. (2003) Research report – S22153, a melatonin antagonist dissociates…, Behavioural Brain Research, 138. Elsevier Science;
Don't miss out:
If reading this text has inspired you to learn more, you may be interested in joining the millions of people who discover our free learning resources and qualifications by visiting The Open University - www.open.edu/ openlearn/ free-courses