Obesity: balanced diets and treatment
Use 'Print preview' to check the number of pages and printer settings.
Print functionality varies between browsers.
Printable page generated Friday, 19 April 2024, 8:20 AM
Obesity: balanced diets and treatment
Introduction
An essential aspect of maintaining the body is the consumption of food. The range of foods that we eat is known as our diet and the components of food that are digested, absorbed and used in bodily functions are known as nutrients. Nutrients supply the body with both energy and with the components for growth and repair. In this free course, Obesity: balanced diets and treatment, you will examine the various roles of nutrients within the body and look at the effects of nutrient deficiencies or excesses, both of which can lead to adverse health effects.
This OpenLearn course provides a sample of level 2 study in Biology.
Learning outcomes
After studying this course, you should be able to:
list the six key nutrient groups and explain their role in a healthy diet
understand and calculate body mass index (BMI), and use such calculations to predict desirable weight ranges for individuals
explain the importance of a balanced diet in terms of energy intake
explain how genetic and environmental variables may interact to produce variability in human body weight and adiposity both within and across generations
apply an understanding of gene–environment interactions to possible explanations of variability in body weight and adiposity.
1 The components of a balanced diet
A balanced diet contains six key nutrient groups that are required in appropriate amounts for health. These groups are outlined below.
Proteins are involved in growth, repair and general maintenance of the body.
Carbohydrates are usually the main energy source for the body.
Lipids or fats are a rich source of energy, key components of cell membranes and signalling molecules, and as myelin they insulate neurons (nerve cells).
Vitamins are important in a range of biochemical reactions.
Minerals are important in maintaining ionic balances and many biochemical reactions.
Water is crucial to life. Metabolic reactions occur in an aqueous environment and water acts as a solvent for other molecules to dissolve in.
A deficiency of any one type of nutrient can lead to disease, starvation (or dehydration in the case of water) and subsequent death. Fibre is a component of food that is not nutritious but is important to include in our diet. Fibre or roughage is non-digestible carbohydrate and it has an important role in aiding the movement of food through the gut.
There is also an absolute requirement for some specific molecules in the diet. This is because, although the body can manufacture most of the molecules it needs, some essential molecules cannot be made by the body. These molecules are called essential nutrients, and must be supplied in the diet, for example lysine and methionine, which are essential amino acids.
Other components of the human diet are not nutrients at all, as they do not perform the functions of producing energy or promoting growth and repair, but are eaten for other purposes. For example, spices and other flavourings help make food more palatable; tea and coffee drinks provide a good source of water and may also contain other valuable substances such as antioxidants (see below).
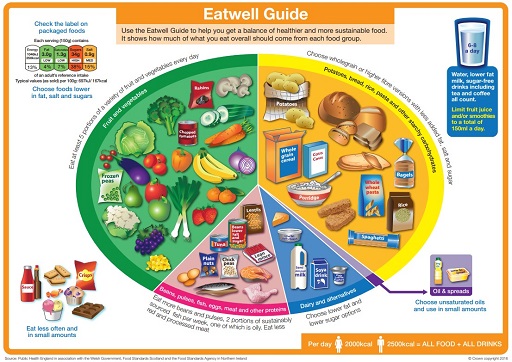
An adequate diet is essential for health and education plays a key role in providing people with the knowledge of what constitutes a healthy diet, but as is so often the way with science, the information keeps changing. The information about what we should be eating comes from various sources: in the UK a large amount of data was collected and published by COMA, the Committee on Medical Aspects of Food Policy (1991). This committee has now been disbanded, but its publications still represent a valid source of information about diet. When this course was published (2004), the Scientific Advisory Committee on Nutrition (SACN) advised the Department of Health and the Food Standards Agency (FSA), and the Food Standards Agency produced a guide to choosing a healthy diet, ‘The balance of good health’. Currently (2020) Public Health England produces the Eatwell Guide to visually communicate government recommendations for a healthy diet. This is shown in Figure 1. A lack of an adequate supply of any nutrient is known as malnutrition and leads to poor health.
Activity 1
Does Figure 1 enable you to identify any nutrient that might be inadequately represented in your diet?
Answer
Figure 1 is a representation known as a pie chart. It enables you to see the relative proportions of each of the food categories that are likely to make up your diet. It is a fairly crude instrument and does not allow you to identify any nutrient deficiency.
Figure 1 can be useful tool for teaching children about a healthy diet.
Activity 2
How much fruit and vegetables should you eat?
Answer
Fruit and vegetables should make up over a quarter of your daily intake.
The message in Figure 1 is simple and it emphasizes balance rather than focusing on specific nutrients.
However, SACN does recommend a range of intake levels for all nutrients and energy for males and females throughout life, known as the dietary reference values (DRVs). Because individuals vary in their exact energy requirements, depending on sex, age, occupation and many other factors, often the estimated average requirement (EAR) is given, with the understanding that some individuals need more than this value and others less. EAR values for energy are shown in Table 1.
| Age | EAR/kcal per day | |
|---|---|---|
| Males | Females | |
| 0–3 months | 545 | 515 |
| 4–6 months | 690 | 645 |
| 7–9 months | 825 | 765 |
| 10–12 months | 920 | 865 |
| 1–3 years | 1230 | 1165 |
| 4–6 years | 1715 | 1545 |
| 7–10 years | 1970 | 1740 |
| 11–14 years | 2220 | 1845 |
| 15–18 years | 2755 | 2110 |
| 19–50 years | 2550 | 1940 |
| 51–59 years | 2550 | 1900 |
| 60–64 years | 2380 | 1900 |
| 65–74 years | 2330 | 1900 |
| over 75 years | 2100 | 1810 |
| pregnancy | + 200* | |
| lactation | + 450–80 | |
*During the last three months of pregnancy.
Activity 3
From Table 1, identify the age at which males require the most dietary energy. Suggest why this may be so.
Answer
The highest energy intake, 2755 kcal per day, is required between the ages of 15 and 18. This is the age range in which boys grow and increase their muscle mass to achieve their adult size and shape. They are also maturing sexually at this stage.
Dietary reference values in fact comprise three numbers: the EAR, just discussed, the reference nutrient intake, RNI, and the lower reference nutrient intake, LRNI. These figures replace the old recommended daily amount (RDA), which was felt not to offer sufficient flexibility for individuals’ differing needs. The RNI is set at a level that satisfies the requirements of 97.5% of the population, and the LRNI is set at a level that satisfies the needs of only 2.5% of the population. Thus almost everyone has requirements falling between these two figures. You may have noticed that over the last few years the information on food packaging has shifted emphasis from a categorical ‘satisfies 20% of RDA’, for example, and more towards a list of ingredients, perhaps with an exhortation to ‘eat five portions of fruit each day’. This reflects the move away from a ‘one-size-fits-all’ RDA to a situation in which individuals’ needs can be accommodated.
Individual requirements for nutrients vary considerably depending on factors such as age and sex as you saw above. Other relevant factors are size, metabolic rate (see below) and occupation. The situation is further complicated as interactions between components of the diet may alter the efficiency of absorption or utilization of a particular nutrient. The body also has stores of certain nutrients (fat-soluble vitamins, for example) so that variations in daily intake of such nutrients can be accommodated. Thus it could be misleading to recommend a particular daily intake level.
In summary:
A balanced diet consists of six main nutrient groups; proteins, carbohydrates, lipids, vitamins, minerals and water.
Dietary reference values (DRVs) comprise a range and an estimated average of recommended daily intake levels for nutrients and energy for males and females at different stages of their life.
1.1 Balanced energy intake
There is a need for a certain daily energy intake to allow metabolism to occur in the body. Metabolism means all the chemical reactions occurring in the body and there are two types of process involved: catabolism breaks down larger molecules into smaller ones often with energy release and anabolism is the building up of larger molecules from smaller precursors, often requiring energy. The body requires energy to power anabolic, mechanical (for example, muscle contraction and cellular movement), and transport (for example, the movement of substances across cell membranes) work within the body.
There is an ‘energy currency’ is used by the body in the same way that society uses money, known as adenosine triphosphate or ATP. ATP is represented in Figure 2 and is synthesized when certain nutrients are catabolized by the body. You do not need to remember the structure of ATP, but do note the three phosphate groups (triphosphate) and the adenosine group of the molecule – these give it the name of adenosine triphosphate.
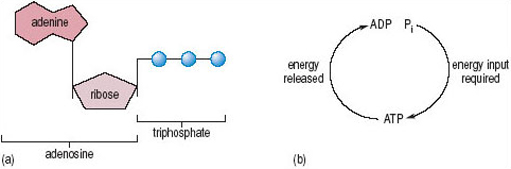
Energy is released from ATP when it loses a phosphate group and becomes adenosine diphosphate or ADP. The energy released from this ATP catabolism can be used to power the energy-requiring processes in the body. So, using the money analogy, ATP is synthesized (or earned like money) and then catabolized (spent) where necessary. There is a difference in the analogy here in that the body is very efficient in how it uses ATP and wastes as little as possible, whereas we are not always as wise in the way we spend money! Proteins, carbohydrates and fats can all be catabolized to produce ATP. The metabolism of these macromolecules involves quite complicated biochemical pathways to ensure that the maximum amount of ATP is synthesized from each starting molecule. Figure 3 shows these pathways in a greatly simplified manner, although we do appreciate that they will not look simple if you have not previously studied biology! Note that ATP cannot be stored in the cell, so a constant supply of raw materials is necessary to maintain supplies.
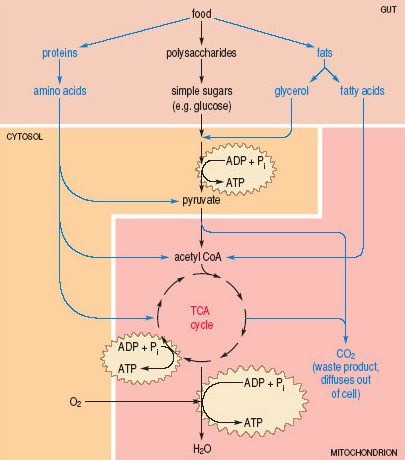
Figure 3, above, shows a summary of the fates of proteins, carbohydrates and fats in metabolic pathways that result in the production of ATP. Food in the gut is broken down into its constituent amino acids, sugars, fatty acids and glycerol, and these building blocks are absorbed into cells. The first time ATP is made is in the cytosol, from sugars or glycerol. An important intermediate, called pyruvate, is made (amino acids can be converted into pyruvate too). Pyruvate is transported into the mitochondrion, where it is converted into acetyl CoA, which is a very important molecule. Fatty acids and amino acids can also be converted into acetyl CoA, Acetyl CoA enters a pathway called the TCA cycle, where more ATP is made. Waste carbon dioxide (CO2) is also produced at this stage (as it is from the pyruvate into acetyl CoA conversion earlier). Other products of the TCA cycle are further processed to make more ATP, and this step requires oxygen (O2) (the O2 we breathe in) and produces water (H2O) as a waste product.
Energy is released when certain nutrients are metabolized in the body and this energy is used to power other chemical reactions and cellular processes while some energy is lost as heat. Energy is measured in kilocalories (kcal) or kilojoules (kJ): one kcal is approximately 4.2 kJ and is defined as the amount of energy required to raise the temperature of 1 litre of water by 1 °C. Electrically igniting known quantities of the foodstuff in oxygen and then measuring the heat output gives an indication of the energy content of foods. The heat energy that is released by burning the food in oxygen is equivalent to the energy released in the body when the complex molecules in the food are metabolized completely. One of the reasons why metabolic pathways are so long and complex is that this allows a gradual release of the energy from the food rather than a sudden massive energy release, as occurs with burning. The energy yields of different nutrients are shown in Table 2.
| Nutrient type | Available energy/ | |
|---|---|---|
| kcal g−1 | kJ g−1 | |
| carbohydrate | 4 | 15–17 |
| fat | 9 | 37 |
| protein | 4 | 16 |
Activity 4
How much more energy in kJ per gram (kJ g−1) does fat yield than protein?
Answer
Fat yields 37 kJ g−1 of energy and protein yields 16 kJ g−1 of energy. So fat yields 37÷16 or 2.3 times more energy per gram than protein.
In other words, fats contain a more concentrated form of energy. It is therefore easy to exceed the DRVs for energy when eating a high-fat diet, and the excess is stored as fat in the body. Diets containing high proportions of fats have also been linked with disease (e.g. cancer of the colon and cardiovascular disease). If other energy sources in the diet are insufficient, first stored fat and then proteins are catabolized to provide energy and this will ultimately lead to muscle wasting (as muscles are made of protein).
The basal metabolic rate (BMR) is the amount of energy required to carry out the basic processes of life – the processes that continue as you sit quietly or lie asleep, such as breathing and the beating of your heart. BMR values are remarkably constant when related to lean body mass although BMR does change with the age and sex of the individual.
Activity 5
What evidence have you seen for this variation in BMR with age and sex?
Answer
Table 1 shows how EAR varies with these two factors.
Further energy expenditure is necessary to carry out everyday activities beyond the energy required for the BMR; this is called the total energy expenditure (TEE). TEE is directly related to the total amount of muscular activity but also to brain activity (the brain normally uses 20% of the available glucose and oxygen), age, environmental temperature (metabolism increases in cold climates to maintain body temperature), disease (metabolic rate increases by about 8% for every 0.5 °C increase in fever), pregnancy and lactation and energy intake (metabolic rate is decreased in prolonged under-nutrition). An individual maintains a stable weight when their total energy intake (TEI) balances their TEE.
Activity 6
Can you think what a diet containing insufficient energy-producing nutrients for an individual's TEE over a period of months may lead to?
Answer
If TEI is less than TEE over a period of months then the individual will lose body mass (weight). The extent of the weight loss depends on the difference between energy intake and expenditure and if this diet were maintained it would lead to malnutrition and an increased susceptibility to ill-health.
Activity 7
What would over-consumption of energy-producing nutrients result in?
Answer
Over-consumption would lead to weight gain (largely because of an increase in stored body fats) and eventually to obesity.
Obesity is greatly elevated body weight, above the desirable level, to an extent which is associated with serious increased risk to health. Average energy requirements for males and females at different ages were shown in Table 1 and Table 3 shows energy expended during different activities for a 70 kg person.
| Form of activity | Energy expended/kcal h−1 |
|---|---|
| lying still, awake | 77 |
| sitting at rest | 100 |
| typing rapidly | 140 |
| dressing or undressing | 150 |
| walking on level at 4.8 km h−1 | 200 |
| jogging at 9 km h−1 | 570 |
Our diet and our lifestyle are the main influences on our weight; although there is an additional genetic influence. A simple calculation called the body mass index (BMI) indicates whether an adult is a healthy weight for their height. To calculate your BMI divide your weight (in kg) by your height (in metres) squared.
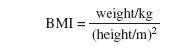
There is not one perfect weight for every height but a range that allows for people's build. However, the BMI formula is not suitable for pregnant women, children and some medical conditions. Even with these caveats the BMI is not infallible but it can be a useful guide (Table 4).
| Body mass index | Classification |
|---|---|
| less than 18.5 | underweight |
| 18.5–25 | desirable or healthy range |
| 25–30 | overweight |
| 30–35 | obese (Class I) |
| 35–40 | obese (Class II) |
| over 40 | morbidly or severely obese (Class III) |
Activity 8
What is the BMI of a woman of 1.7 m who weighs 65 kg?
Answer
This value means that she would be in the healthy range for her body mass index.
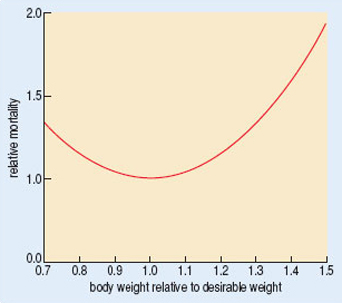
Both overweight and obesity classifications are associated with increased incidence of serious conditions such as high blood pressure (hypertension), cardiovascular disease and type 2 diabetes (Figure 4; see Case Report 1), as well as conditions that are not life-threatening, but which do affect well-being, such as varicose veins and arthritis. On the gloomy side, both underweight and overweight individuals have an increased risk of premature death, as shown in Figure 5.
1.2 Inadequate intake
In the developed world inadequate intake of food, at least in terms of energy, is not common. Nevertheless, in many parts of the world starvation is a huge issue, and it is estimated that tens of millions of people face starvation, and well over 5 million, mainly children, die each year from inadequate nutrient intake. Importantly, lack of particular nutrients impairs our ability to carry out many functions.
Activity 9
Can you suggest any processes that would be impaired by starvation?
Answer
Growth, tissue repair and resistance to infection are all adversely affected by inadequate food intake.
Thus, people who are starving, or even those who are apparently eating sufficient quantities of food but do not eat a balanced diet, may be susceptible to a variety of illnesses. It is no coincidence that huge increases in the incidence of diseases such as HIV–AIDS and tuberculosis are seen in countries where food is not plentiful, and many starving children are killed by relatively minor ailments that their better-fed counterparts can withstand.
Illness itself can be a cause of inadequate food intake. We all know that illness is often accompanied by a loss of appetite, and if this condition persists, malnutrition can ensue. Alack of appetite is called anorexia, and, ironically, it can also be caused by medical treatment, and by conditions such as depression, particularly in the elderly. In the UK, anorexia nervosa is sometimes seen. Anorexia nervosa is a condition manifested by an extreme aversion to food. It might be accompanied by bulimia nervosa, a condition in which the individual binges and then gets rid of the excess food by means of vomiting or laxatives. The disorder usually affects females in the period from their teens until their 30s; only some 5% of anorexic individuals are male.
Psychological hypotheses about the causation of anorexia nervosa fall into three broad categories:
Emotional. Theorists have proposed that some adolescent girls past puberty are trying to regain their childhood body form; anorexic women fail to start to menstruate or cease menstruation with onset of the disorder. Depression and anxiety are common amongst people with anorexia nervosa.
Familial. Families can put too much pressure on children to succeed or may be over protective. Sometimes, the only way an individual can feel ‘in charge’ of their life is to control their own diet, and this may be manifested by a refusal (overt or tacit) to eat adequate nutrients.
Cultural. Many people have a distorted view of how they should look. People who have anorexia nervosa may compare themselves with what they see as being society's ideal form. Slim young women are used as models in the media and young girls try to emulate them. It is eminently clear that people with anorexia nervosa have a distorted psychological image of their own body. Ironically, it is believed to be the case that many fashion models are suffering from inadequate food intake and that there is a price to be paid for their extremely thin appearance.
1.3 Obesity
At the time of writing (2004) 20% of the adult population of the UK is classified as obese. The number of obese children has doubled since 1982, 10% of six year olds and 17% of fifteen year olds are now classified as obese. As shown in Table 4, obesity is recognized when the BMI exceeds 30 and occurs quite simply when energy intake exceeds energy expended over a period of time. However, hormonal, genetic and metabolic abnormalities can also sometimes be involved. (We will return to a consideration of these factors later.) Some obese people eat considerably more than non-obese people, particularly in the period during which they are actually increasing in weight. However, the difference between intake and metabolic expenditure need only be very small (perhaps eating an extra piece of cake every day for 3 months) to produce a cumulative weight increase over a period of months.
The House of Commons Health Committee published a report in 2004 (House of Commons Health Committee, 2004) in which the increasing problem of obesity was heavily emphasized. The report stated that the incidence of obesity has grown by almost 400% in 25 years and suggested that if it continued to grow at such a rate it would soon overtake smoking as the biggest cause of premature loss of life. The economic cost of obesity was estimated at 3.3–3.7 billion pounds per year. This cost estimate includes predicted costs of the NHS for treatment of obese patients as well as time lost to industry due to sickness.
The report makes many recommendations to government of ways of tackling obesity. Targeting the food industry to reduce food portion sizes and moderate their advertising campaigns were some of the recommendations. The report also recommended that food products were labelled more clearly and a ‘traffic light’ method for labelling foods based on their energy density was suggested. In this system ‘green’ would label foods with low energy, ‘amber’ for medium energy density and ‘red’ for high energy density.
Activity 10
What do you suppose is meant by ‘high energy density’ ?
Answer
A food with high energy density will make available far more energy for its size (i.e. per portion) than a low-energy-density food.
Activity 11
What happens if the amount of energy that can be made available exceeds current requirements?
Answer
The surplus will be stored, potentially adding to body fat.
Education of what constitutes a healthy diet was also a key recommendation, at school level and beyond. There were a number of different recommendations of ways in which to increase individuals’ exercise to the recommended level of 30 minutes five times a week, including school and workplace initiatives.
Exercise is very helpful in aiding obese individuals to lose weight as it increases their TEE. Exercise also has the advantage of increasing BMR for hours beyond the termination of exercise. A long-term advantage of exercise can be an increase in the ratio of lean/fat body weight with subsequent advantages for keeping metabolic rate high. Whilst it is desirable for obese individuals to exercise this is easier said than done and the danger is that individuals can get into a vicious circle: as weight increases so exercise decreases. This means that later, even with the will to do it, an overweight person might not be able to perform enough exercise to increase metabolism sufficiently to lose weight.
There are of course various social, economic and environmental factors that will play a role in how much exercise a person is able to take.
Activity 12
From your general knowledge summarize some of these factors.
Answer
Your summary should be a long one! It might also reflect your age and current interests. Social factors could include family responsibilities, the availability of others to participate in team games or how close you are to clubs and leisure facilities. Economic factors such as cost of membership of clubs and of sporting equipment and sports wear will limit participation by some people. Even walking, which can be a solitary activity and need not involve the outlay of any cash can be limited if one lives in an unsafe environment.
The relationship between decreased physical activity and increasing obesity within the population of the UK can be attributed to a reduction in cycling and walking and increased car use (the number of cars has doubled in 30 years) and increased television viewing (which has also doubled since the 1960s).
Activity 13
Is the relationship between decreased physical activity, increased car ownership and obesity a causal relationship?
Answer
The report is suggesting that it is.
Activity 14
Do you have any reservations about this statement?
Answer
Yes, you should. In the absence of specific data from studies that have eliminated other possible causal factors it is not possible to make inferences about causation just using a common sense approach.
The rise in the number of obese children has been associated with increased television watching, playing of computer games and safety fears of parents for their children which keeps them indoors rather than playing outside. The rise of the ‘school run’ in which children are transported to school rather than walking also does not help with increasing their physical activity levels.
Activity 15
It is known that many obese children have obese parents. What explanations might be given for this effect?
Answer
Either a genetic factor or an environmental factor, or both, could be involved.
Activity 16
How would you distinguish between these two explanations?
Answer
It would be possible to follow up genetically identical (monozygotic) twins who were separated after birth and brought up in different families.
These kinds of studies have been done and we will consider them later in this course.
Case Report 1 provides a more in-depth look into some of the causes and treatment of obesity.
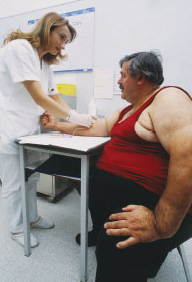
Case Report 1: Obesity
Ron is 59 years old and looking forward to retiring from his sedentary desk job. He was aware that he had gained weight over a number of years and that his weight had increased more rapidly after he sprained his ankle refereeing rugby (causing his retirement from the game) a couple of years ago. He had meant to join the local gym or take up golf but had not quite got around to doing it. He was looking forward to all the time he would have to get fit again once he had retired, as the most exercise he did every day was walk to and from the bus stop to catch the bus to work, which was about 200 yards from his front door.
Ron noticed that he was starting to get breathless when he had to go upstairs and that he had developed varicose veins. He noticed that he frequently suffered from heartburn after eating and started to complain to his wife Margaret that he often just did not feel well. Margaret, a slim woman in her mid-fifties, urged him to go and have a check-up. He booked himself into the well person clinic, run by the practice nurse.
Jane, the practice nurse, started the check-up by chatting to Ron about his general health. She asked whether there was any family history of heart disease or strokes and discovered that he was not currently taking any medicines. Ron replied that his father had died of a heart attack when he was 67 years old and his mother had died following a stroke at 60 years old.
The nurse asked Ron about his current eating and exercise habits and Ron explained about the sprained ankle and the knock-on effects from that. He admitted that he liked a fried breakfast, enjoyed a canteen-cooked lunch of two courses and a cooked dinner with pudding. The nurse asked if he snacked during the day and Ron said ‘No, but I do have a chocolate biscuit with my mid-morning tea and I like to have a pint or two of beer later in the evening often with a bag of crisps’.
Jane weighed Ron (95 kg), measured his height (1.75 m) and then calculated his body mass index (BMI) as:

The BMI reading indicated that Ron was obese (Class I). Jane also measured Ron's waist and hips, explaining that the ratio between waist and hips should not exceed 0.95 for men over 40 years old. She explained that abdominal or central obesity is indicated by a ratio greater than 0.95 in men and 0.85 in women and that this increases the risks of heart disease and type 2 diabetes, which is an impairment of insulin activity. She was quick to point out that the possibility that Ron had these diseases would require further investigation before diagnosis could be made. Ron had a central obesity ratio of 0.96.
Jane measured Ron's blood pressure and discovered it was a bit high. Jane pointed out that this reading was a one-off reading and the usual standard for measuring blood pressure is to take one reading per week for 3 weeks. Finally Jane asked Ron to give an urine sample which she tested for glucose (glucosuria is the term used to describe glucose presence in the urine) and ketones (ketones or ketone bodies are a by-product of metabolism when there is excess glucose and ketonuria is the term used to describe the presence of ketones in the urine). Ron's urine sample was negative for glucose and ketones. Glucosuria and ketonuria are indicative of type 2 diabetes.
Jane then asked if Ron had ever considered losing weight and Ron said he would like to but did not know where to start. Jane suggested that Ron kept a diary of his daily food intake and his exercise over the next week and brought it to the next appointment. She told Ron that obesity is caused by taking in more energy than is expended over a period of time and reassured Ron that if he lost weight he would immediately start reducing the risks of the other conditions associated with obesity. She stressed that obesity is a condition that Ron himself could have some control over by eating a balanced diet and increasing his exercise. Ron left the surgery determined to enrol in a local WeightWatchers group and join the gym.
1.4 Obesity treatment
Obesity treatment is only successful if weight is reduced and maintained to within a desired range. There are three approaches to obesity treatment: changing behaviour and diet is the most common approach although drugs and surgery can be used in some severe cases of obesity.
Behaviour and diet: it is important to be realistic about an obese patient's target weight as many patients have over-ambitious targets that they are unlikely to achieve. A severely obese patient probably cannot reach an ideal BMI quickly (losing too much weight too quickly puts metabolic stress on the body), but even a weight loss of 10% body weight can significantly reduce the risk of obesity-related disorders. The best combination for weight loss is increasing exercise and decreasing food intake and for lasting effects of obesity treatment a change in eating and exercise habits is necessary and most effective.
Exercise must be based around activities the patient enjoys and can fit into their lifestyle and any increase in exercise is better than no exercise at all. Exercise is beneficial in a weight-loss plan because it uses calories and also increases resting metabolic rate afterwards. Most people also experience a feeling of well-being following exercise and this can be a motivating factor to the patient.
Weight loss is not a simple procedure for most people and requires a dogged determination on behalf of the dieter to stick to the desired regime. People losing weight need support and encouragement to adapt to their recommended dietary and behavioural changes. The motivation for women to lose weight is often their own physical appearance, whereas men are more motivated by health concerns. Partners and friends of the person losing weight can help by providing positive support and motivation and emphasizing the benefits of weight loss such as increased stamina, mobility and self-confidence as well as decreased risk of coronary heart disease, strokes, diabetes, etc.
A practice nurse may suggest that a personalized diet plan is made considering the weight, age and activity level and could include the following:
include fruit and vegetables with meals;
avoid high-density-energy between-mealtime snacks and replace crisps and chocolate with fruit;
spread low fat margarine thinly on wholemeal bread;
eat low-fat products instead of full-fat products;
do not fry food; instead bake it in the oven or boil it;
use skimmed milk instead of full-fat milk;
remove fat from meat and skin from chicken;
reduce salt intake (this affects water retention;
do not add sugar to drinks and avoid soft sugary drinks;
do not eat pastry, cakes or biscuits as part of a daily routine;
reduce alcohol intake to national guideline levels (alcohol is high in kcal);
start walking for an hour or 10 000 steps every day.
Drugs: the only drugs licensed for obesity treatment in the UK are sibutramine (Meridia™) which is an appetite suppressant and orlistat which causes fat malabsorption. Drugs are only licensed for those with a BMI greater than 30 and then only after at least 3 months supervised exercise and behaviour modification has failed to achieve weight loss.
Surgery: surgery can be used to treat Class III obesity, although this is not commonly undertaken in the UK. Either the absorptive capacity of the small intestine is reduced by surgically by-passing part of the small intestine or the size of the stomach is reduced (gastric reduction) so limiting the amount of food that can be taken in. There are considerable risks associated with surgery as it puts a strain on the heart and this risk is increased in obese patients. Some patients have their jaws wired which limits the rate and consistency (i.e. texture) of food intake.
In summary:
- There is a need for a certain level of daily energy intake to allow the body to maintain its BMR, and to carry out work.
- Adenosine triphosphate (ATP) is the chemical currency of energy used by the body and is produced from the metabolism of food.
- The body mass index or BMI indicates whether an adult is a healthy weight for their height.
- Inadequate nutrition is a huge problem globally. Anorexia nervosa is one example of inadequate nutrition seen in the UK.
- Obesity is an increasing problem in the western world and is associated with a number of other medical disorders, such as cardiovascular disease.
2 Genes, environment and the causes of obesity
In this section we will look at the ways in which environmental and genetic factors interact to produce the diversity that is characteristic of humans and other species. We will use variation in human body weight and changes in the incidence of obesity, first discussed in Case Report 1.
2.1 Ron revisited
In Case Report 1 you met Ron. Ron is 59 years old, has a BMI of 31 and a central obesity ratio of 0.96, indicating that he is moderately obese, with the fat concentrated in his abdomen, rather than his hips. Clearly a number of factors, some environmental, others relating to Ron's age and all interacting with Ron's genetic constitution, may help to provide an explanation. Let's look at some of these factors in a little more detail. It is clear that Ron enjoys a comfortable lifestyle with little exercise and a generous diet. Three cooked meals a day, snacks and the occasional glass of beer might easily generate an energy input of more than 12 000 kJ day−1.
Activity 17
What is Ron's estimated average requirement (EAR), expressed in kJ day−1?
Answer
This can be calculated from Table 1. Ron's EAR is 2550 kcal × 4.2 = 10710 kJ. (4.2 is the correction factor required to transform calories to joules.
You might wonder why Ron doesn't feel permanently sated, leading to a reduction in his food intake and body weight. Studies with volunteers living in a laboratory environment in which food intake and energy output could be continuously monitored over several weeks provide a partial answer to this paradox.
2.2 Experimental studies of energy balance
The energy that a human takes in, primarily in food or nutritive fluids, has to be balanced by the energy lost in various ways. Some energy is used to maintain basic metabolic processes, some in physical activity while the remainder is lost as heat, or in the faeces or urine. If energy input and output do not balance, then the residue must either result in a loss or a gain in body weight.
One way of estimating these energy fluxes is to use the technique of whole room indirect calorimetry. Volunteers live on their own in a small suite of rooms which are sealed from the outside environment. The room can also contain exercise equipment. Food and water are provided through an airlock, and the exact amounts of carbon dioxide produced and oxygen used are measured. It is then possible to calculate an overall energy budget for each individual.
In one experiment of this type, participants were divided into three groups, each group receiving a diet of different fat content (Poppitt and Prentice, 1996). The other constituents of the diet, which were mainly protein and carbohydrate, were varied in such a way as to keep the overall energy density of the diets constant.
Activity 18
What is the energy density of a diet?
Answer
The number of calories (or joules) in a standard quantity (often 100 g) of that food.
The participants in this experiment were not aware that their diets were being manipulated in this way. In practical terms this kind of manipulation is achieved by, for example, substituting fat for carbohydrate within a yogurt while, at the same time, ensuring that the sensory characteristics (e.g. taste, smell and feel) do not change.
The results of this experiment are shown in Figure 6(a).
Activity 19
How did the voluntary energy intake of the participants vary as a function of the fat content of the diets when energy density is constant?
Answer
The overall result was straightforward: the energy intake of the volunteers hardly varies as a function of the amount of fat in the diet.
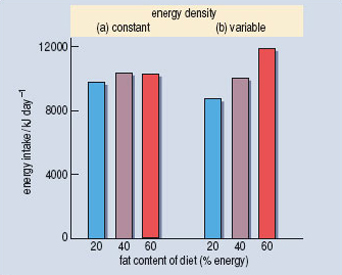
The apparent difference between the 20% and 40% groups was not significant. In addition there was no significant change in body weight over the experimental period of a few days.
In a second experiment the participants were again divided into three groups. Now each group received a diet in which the fat content had been covertly manipulated so as to vary the total energy density. One group received a diet which was relatively low fat and low energy, in a second group it was relatively normal whereas the third group received an energy-dense, high-fat diet. Other factors, such as the palatability of the foods provided, were again held constant. Surprisingly, the participants in the different experimental groups ate about the same number of grams of food each day regardless of its energy content.
Activity 20
Look at Figure 6(b). What was the consequence of this behaviour for the energy intake of the participants?
Answer
The consequence was that participants in the high energy density and fat content group had a higher energy intake than those in the groups provided with foods of lower energy density and fat content.
One result of these different energy intakes was that participants in the high-fat group increased in weight during the study period whereas those on the low-fat group lost weight. Taken together, the results of these experiments suggest that humans don't respond very accurately to changes in the energy density of their diet especially when their diet is very high in fat!
Detailed calculations based on these experiments suggest that excess consumption of about 3 × 10⁴kJ of fat had generated about 100 g of adipose tissue by the end of the experimental period. Let’s relate this to what one major fast food retailer said at the time (2004) about their products; a hamburger and french fries was shown on their website as containing 2.92 × 10⁴ kJ with a high proportion of that energy being in the form of fat. (Big Mac™ and regular fries were shown in 2004 as 699 kC (kcal) with an energy density of 494 kC per 100 g. 1 joule is approx 0.239 kC, giving a total energy content of 2924 kJ and an energy density of 2066 kJ per 100g (McDonalds, 2005).) There is a good deal of evidence to suggest that dietary fat, protein and carbohydrate may differ in the degree to which they can induce satiety – that rather pleasant feeling of satisfaction and fullness that we experience at the end of a meal. Carbohydrate and protein, when matched in terms of energy content, are very much more effective in enhancing satiety than is fat. You can now easily imagine how regular consumption of energy dense, high-fat foods might translate into increased body weight.
Another dietary factor that may be related to the increased incidence of obesity is the use of fructose derived from corn (high-fructose corn syrup) as a sweetener in soft drinks. Fructose is a simple sugar, like glucose, but differs from it in several important ways. Fructose can be absorbed by cells in the absence of insulin, and is also a poor signal for insulin release. Once in a cell it can be very easily metabolized into glycerol, one of the building blocks for fat (see Section 2.8.1 on Adipose tissue, which should be read after completing study of Section 2.6). Bray (2004) has pointed out the very close parallel between increases in the use of high-fructose corn syrup in the food industry and the incidence of obesity in North America. Of course, soft drinks sweetened in this way are frequently consumed together with the kinds of energy-dense, high-fat foods that we discussed in the last few paragraphs, so it will not be easy to disentangle the effects of these two factors. Looking at the data as a natural scientific experiment we might say that the effects of energy-dense, high-fat foods, and of soft drinks sweetened with corn syrup, on the incidence of obesity are confounded together.
Complementary (non question-based Activity)
Collect the wrappers of some typical snack foods. Look at the dietary information. How effective are they likely to be at inducing satiety? What contribution might they make to total daily energy intake? People often feel that a savoury snack (e.g. crisps) might be healthier than a sweet snack (e.g. chocolate). Does the dietary information that you have just collected support this idea?
2.3 Obesity – an evolutionary perspective
If you were now to take a broader biological approach to the data discussed in the previous section you might still be puzzled. Excess body weight leads to a variety of diseases, including diabetes, osteoarthritis and so on – surely this must reduce overall biological fitness.
Activity 21
What is biological fitness?
Answer
The formal definition is ‘lifetime reproductive success’. It can be estimated by measuring the number of offspring (or perhaps even grandchildren!) left by an individual relative to other members of that population.
So why are we, as a species, apparently so unresponsive to the potential reduction in fitness that may result from obesity? Why has natural selection not equipped us with satiety mechanisms that are tuned to the types of nutrients found in our diet? A speculative answer to this question is provided by Prentice and Jebb (2003). They suggest that the critical point to consider is the environment in which our evolutionary ancestors lived. Genetic and fossil evidence suggests that our species, Homo sapiens, evolved in Africa, around 200 000–120 000 years ago, from an ancient Homo species, which had a hunter–gatherer lifestyle. Since then, for most of the time, humans have also been hunter–gatherers, until about 12 000 years ago, when subsistence farming became established. Both the hunter–gatherer and the subsistence farming diets have a much lower energy density than those available in many societies in the developed world. Even today some groups of subsistence farmers exist on diets with an average energy density of about 500 kJ per 100 g, which is only a quarter of the value for a typical fast food meal. Although the diets of other primates species, e.g. chimpanzees, are highly variable, their energy density and fat content are also very much lower than that characteristic of present industrialized societies. Thus our apparent failure to adapt may be because our distant ancestors were not exposed to diets of high energy density and we therefore don't have the appropriate physiological and behavioural responses to such foods.
The idea that humans are best adapted to an environment that is quite different from that in which we now live was first discussed by the child psychologist John Bowlby in 1969 when he referred to our ‘Environment of Evolutionary Adaptedness’ (EAA). This concept has become very influential in both human behavioural ecology and evolutionary psychology. However, the concept also has its critics because it is very difficult to get unambiguous evidence about exactly what kind of environment our EAA might have been. Prentice and Jebb (2003) suggest that modern day subsistence farmers in Gambia may provide a good model for the kind of diet available during much of our evolutionary past. However, it is likely that early humans lived in a wide variety of environments and that different populations consumed very different types of diet. Even in recent times, hunter-gatherer and subsistence farming populations show tremendous variety in their food sources.
Activity 22
From your general knowledge, suggest some examples of this type of variety.
Answer
The traditional diet of Inuit Indians living in Northern Canada consists almost entirely of protein and fat derived from the seals and salmon that are abundant there. The traditional diet of Masai warriors is also very high in animal fat and yet is not associated with high levels of either obesity or heart disease.
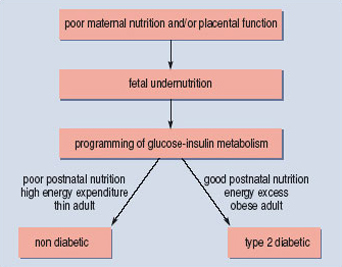
Several alternative, though not mutually exclusive, mechanisms to account for some cases of obesity involve the possibility that some of our ancestors might have had adaptive responses to nutritional shortages. One of the most interesting of these explanations is known as the 'thrifty phenotype’ hypothesis (Ozanne and Hales, 2002); it suggests that poor fetal nutrition leads to adaptive changes in physiology that prepare an adult for a life of poor nutrition (Figure 7). However, if poor fetal nutrition is followed by good nutrition in later life then the consequences may include obesity and type 2 diabetes. Evidence to support this idea comes from studies of individuals who were born at the end of a severe famine that occurred in the Netherlands towards the end of World War II – the Dutch Hunger Winter. Pregnant women who were affected by the famine tended to have children of lower birth weight than women who were unaffected by the famine. However, the affected children, as adults, were more likely to be obese and suffer from type 2 diabetes. By contrast, studies of the children of pregnant women in sub-Saharan Africa who also suffered from famine both in utero and as adults showed no increase in diabetes. Instead, not surprisingly, they continued to be thin and well adapted to a life of relatively low calorie intake.
Recent studies of monozygotic (identical) twins in Denmark suggest that these effects are a direct result of fetal nutrition and do not depend on genetic differences between individuals. Where identical twins do differ in birth weight, it is the twin with the lighter birth weight who is at greater risk of obesity and diabetes as an adult.
Activity 23
Why should it be the lighter twin that is most at risk of obesity and diabetes?
Answer
Monozygotic twins have identical genotypes so it must be differences in their environment that have led to differences in birth weight. Although they have the same mother and lie in the same womb, one must have been less well nourished. The thrifty phenotype hypothesis would predict that physiological changes had occurred in the lighter twin who would now be better adapted for a life of poor nutrition. As with the children born after the Dutch Hunger Winter, these Danish twins are likely to be well nourished, a situation for which they are not best adapted.
This ability to vary or ‘programme’ adult physiology as a consequence of early life experiences may be a general feature in mammals since exactly the same responses to fetal malnutrition can be obtained in laboratory rats.
2.4 Obesity and brain reward systems
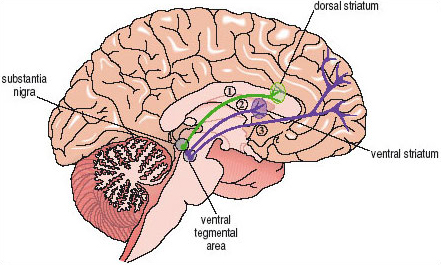
Very palatable foods, especially those high in fat and carbohydrate may be potent stimuli for neural pathways in the brain. Direct evidence for this idea has been found in recent studies of non-human animals. For example, it is known that many types of both natural (i.e. food, sex) and drug (e.g. cocaine or amphetamine, opiates, nicotine) rewards are able to stimulate activity within a brain pathway that innervates the ventral striatum at the base of the forebrain (Figure 8). The nerve cells that make up this pathway, which is called the mesolimbic dopamine projection, use dopamine as their neurotransmitter. Thus, when a rat eats a highly palatable and very sweet breakfast cereal there is an almost immediate increase in the release of dopamine within the ventral striatum. Other foods high in fat and carbohydrate are known to activate the same brain system.
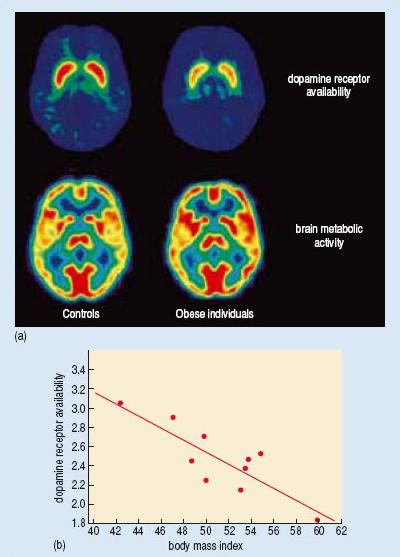
There is preliminary evidence that the same pathway may be involved in human responses to food-related cues. Recently Nora Volkow and her colleagues (Wang et al., 2001) used brain imaging techniques to visualize dopamine receptor availability in the brains of both normal weight and morbidly obese individuals (Figure 9a). They found significantly lowered dopamine receptor availability in the ventral striatum of the obese individuals.
Activity 24a
If dopamine receptor availability is lowered, what might be the effect on the functioning of the mesolimbic dopamine projection?
Answer
When the mesolimbic dopamine projection is stimulated to release dopamine, the cells in the ventral striatum will receive a smaller signal than usual because they have fewer receptors available to ‘pick up’ the neurotransmitters.
Activity 24b
The lower of the two sets of images in Figure 9a shows brain metabolic activity in obese and in control individuals. Why was it important to measure brain metabolic activity in this study?
Answer
The reduced dopamine receptor availability might have been a reflection of a much more general change in brain function. The absence of any difference in brain metabolic activity suggests that the change in dopamine receptor availability is a quite specific effect.
Activity 25
Use Figure 9b to describe the relationship between dopamine receptor availability and the degree of obesity.
Answer
The extent to which dopamine receptor availability was reduced was directly proportional to the degree of obesity; the more obese the individuals, the fewer the numbers of receptors available.
Volkow and her colleagues reasoned that the lowered dopamine receptor availability might generate pathological increases in eating as a compensatory response. Interestingly, similar decreases in dopamine receptor availability have been observed in the brains of people addicted to cocaine. However, in both cases, it is not possible to say whether the lowered dopamine receptor availability was the original cause of a pathological increase in eating, or an adaptive response that occurred only at a later stage.
There is also good evidence for the involvement of cortical areas of the brain in our response to the particular sensory characteristics of fat. Rolls and his colleagues (Rolls, 2004), working at Oxford, have used an imaging technique (fMRI) to demonstrate activation of parts of the frontal lobe, including the orbitofrontal and insular cortex, by fat-like stimuli. These two areas receive sensory inputs from the mouth and tongue and also have important connections to the ventral striatum (Figure 8).
2.5 Obesity and ageing
So, it seems that a part of the explanation for Ron's obesity, and the health problems that have led him to seek medical advice, may relate to the environment in which he is living, and more specifically the diet that he has chosen. It may also be a diet that is especially effective in activating the reward circuits in Ron's brain. However, Ron is also in his later middle age. A longitudinal study of people of this age in the USA suggests that average body weight increases by 1–2 kg per decade in later middle age (He and Baker, 2004).
Activity 26
Is this observed weight increase necessarily a consequence of age? What other explanation can you suggest?
Answer
This observation of increased average body weight might not represent an effect of age – instead it might have resulted from a change in the typical diets of this group of Americans over the 10 year period of the study -perhaps the participants were eating more energy-dense, high-fat food at the end of the study period than at the beginning because of cultural changes within the society within which they lived. As previously mentioned, there may have been changes to the way that the food they were eating has been processed, such as the increased use of corn syrup as a sweetener. This could lead to an altered total energy intake occurring without the participants making any obvious changes to their diets.
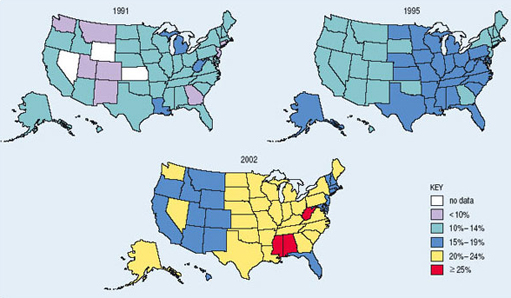
It certainly is the case that obesity has increased very markedly in both USA (Figure 10) and Europe during the last 20 years, and this applies to young as well as older people.
However, it is also possible that the increase in Ron's weight is due to age-related changes in his behaviour or physiology. Remember that changes in body weight can only occur when energy intake and output differ. There are several reasons why energy expenditure might decrease as we age.
Activity 27
What suggestions can you make?
Answer
There may be a tendency to exercise less frequently and intensely.
In addition, some of the hormonal changes associated with ageing may tend to reduce basal metabolic rate. For example, the levels of gonadal steroids, including androgens such as testosterone, decrease substantially. Amongst its many effects, testosterone tends to increase metabolic rate and promote production of muscle rather than adipose tissue. So, even in individuals eating the same diet over the period of a decade, there might be a tendency for body weight to increase if food consumption does not drop.
2.6 A gene ‘for’ obesity?
So far we have mostly emphasized the way in which different environmental factors may affect body weight and provide a partial explanation of both individual cases of obesity and the increase in average body weight that has been so clearly documented in both North America and Western Europe during the last two decades. There is also marked individual variability in body weight. For example, any weight between about 58 and 78 kg would be regarded as ‘desirable’ for a person of height 1.77 m.
Activity 28
Why might this range of body weight be regarded as desirable for someone with a height of 1.77 m?
Answer
In Table 4 you will find the range of BMIs regarded as desirable. The lower end of the desirable range is shown as 18.5, which, when substituted into the formula for the BMI of a person of 1.77 m in height, gives a body weight of 57.96 kg. The upper end of the desirable range is 25, giving a weight of 78.32 kg for persons of this height.
Clearly the actual range of body weights found in human populations is very much greater than the desirable range, and the environmental factors discussed earlier may explain a substantial part of this variation between individuals. But it is also possible that some of this variation depends on specific genetic differences between individuals.
There is considerable evidence to suggest that body weight is heritable to some extent. In a classic study, Albert Stunkard and his colleagues (Stunkard et al., 1986) investigated the relationship between adult body weight of 540 adopted Danish adults and the weights of their biological and adoptive parents. The results were clear cut. There was a strong relationship, which extended from individuals who were very thin through to those who were obese, between the weight of adoptees and the weight of both their biological father and mother. There was no relationship between an adoptee's weight and the weight of either adoptive parent. The idea that variability in body weight may be partly under genetic influence also fits with older studies suggesting that different racial groups may have differing propensities to obesity and type 2 diabetes. In 1962, Neel reviewed data suggesting that certain human populations, including some South Pacific Islanders and North American Indians, may have a genotype that promotes increased fat storage. This genotype represents a survival advantage in times of famine, but can predispose these populations to obesity and type 2 diabetes in typical Westernized societies (see Bindon and Baker, 1997). This is usually known as the 'thrifty genotype’ hypothesis. It is important to note that this hypothesis is not suggested as a universal, or even a common, reason for obesity, but one that applies just to these specific groups.
Activity 29
How would you characterise the major difference between the thrifty genotype and the thrifty phenotype hypotheses of obesity?
Answer
The thrifty phenotype hypothesis emphasizes the way in which an environmental trigger (poor fetal nutrition) can alter the course of development so as to make obesity more likely when the environment is appropriate. By contrast, the thrifty genotype hypothesis suggests that genetic differences between (racial) groups of individuals makes obesity a more likely consequence in some of those groups when they are exposed to an energy-dense modern diet.
Recent advances in our understanding of both molecular genetics and the hormonal and neurotransmitter controls of feeding have led to specific explanations of some causes of obesity.
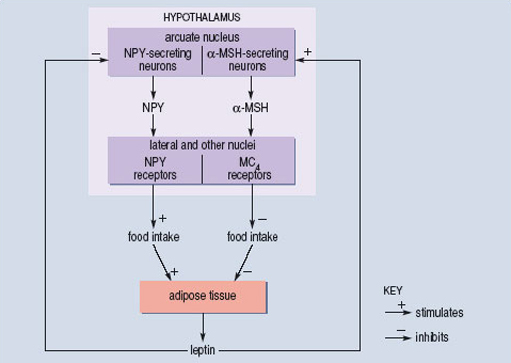
Leptin is a hormone produced by adipose tissue that acts on specific nerve cells in the brain stem and hypothalamus to inhibit feeding behaviour. It was first identified because a very obese strain of mice was discovered to have a mutation in the gene that codes for leptin. Subsequently, a very small number of human families have been identified in which some individuals also have a mutation in the gene that codes for leptin. These mutations are often of the ‘frame-shift’ type and lead to a complete loss of function in the resulting protein. Humans with such mutations overeat and become very obese. If, as children, attempts are made to restrict their food intake, they may become aggressive and difficult to manage. Treatment with leptin leads to normalization of both appetite and body weight. However, the administration of leptin turns out to be very much less effective in the great majority of morbidly obese individuals. They typically already have very high leptin levels but have lost the normal physiological and behavioural responses to the hormone. Thus leptin has not, so far, proved to be the ‘magic bullet’ that will treat the human obesity epidemic.
In the hypothalamus, leptin acts on two groups of nerve cells, both of which influence feeding behaviour but with opposite actions. One set of cells uses neuropeptide Y (NPY) as their neurotransmitter and activation of these cells tends to increase appetite (Figure 11). The second set of cells uses ![]() -melanocyte-stimulating hormone (
-melanocyte-stimulating hormone (![]() -MSH) as a neurotransmitter. The
-MSH) as a neurotransmitter. The ![]() -MSH acts on a subtype of melanocortin receptor known as the MC4 receptor located on other hypothalamic neurons. Activation of the
-MSH acts on a subtype of melanocortin receptor known as the MC4 receptor located on other hypothalamic neurons. Activation of the ![]() -MSH-containing cells is associated with a reduction in feeding behaviour. As you would predict, mice which have been genetically manipulated so that the MC4 receptor is non-functional overeat and are obese. The functional receptor works by producing a second messenger in the postsynaptic cell when
-MSH-containing cells is associated with a reduction in feeding behaviour. As you would predict, mice which have been genetically manipulated so that the MC4 receptor is non-functional overeat and are obese. The functional receptor works by producing a second messenger in the postsynaptic cell when ![]() -MSH is released presynaptically. The production of second messenger is said to be coupled to
-MSH is released presynaptically. The production of second messenger is said to be coupled to ![]() -MSH binding.
-MSH binding.
O'Rahilly and colleagues, working at Cambridge University (Farooqi et al., 2003), have shown that mutations in the human MC4 receptor may account for about 5% of cases of morbid obesity. A number of different point mutations have been isolated, and are associated with different degrees of obesity. The extent to which each mutation interferes with the coupling between ![]() -MSH binding to the receptor and the production of second messenger has also been determined. There is a good correlation between the two measures. Mutations that are associated with the greatest degree of obesity are those in which coupling is least efficient. So, for these cases, we have a reasonably complete understanding of the way in which single mutations in a gene may lead to changes in a complex behavioural trait such as feeding and then go on to influence the long-term regulation of body weight. But even here the statistical correlation is far from perfect, which means that the genetic variation explains only a part of the individual variation in body weight.
-MSH binding to the receptor and the production of second messenger has also been determined. There is a good correlation between the two measures. Mutations that are associated with the greatest degree of obesity are those in which coupling is least efficient. So, for these cases, we have a reasonably complete understanding of the way in which single mutations in a gene may lead to changes in a complex behavioural trait such as feeding and then go on to influence the long-term regulation of body weight. But even here the statistical correlation is far from perfect, which means that the genetic variation explains only a part of the individual variation in body weight.
However, in most cases inheritance of obesity is not consistent with a single gene change. If you look back over the different examples that we have discussed, you can see that this is exactly what would be expected. Even though obesity can only reflect greater energy input than output, the imbalance may arise in many different ways. Environmental factors may play an important role, as may early programming of physiology following fetal undernutrition. Genetic factors may also play a critical role in some cases. But to specify the relative importance of these different factors for any particular individual is always likely to be very difficult. However, our increasing understanding of the molecular genetics of obesity can be very positive in specific cases. For example, for those few individuals who are leptin deficient, administration of synthetic leptin provides good treatment. Our increased understanding also makes it clear that to label young individuals with this type of deficiency as gluttons who lack self control, and to characterize their parents as inadequate for failing to control their child's diet and weight is completely inappropriate.
2.7 Treatments for obesity
At this point you may be wondering what the range of studies that we have examined might suggest in terms of treatment for obesity. As you have seen, weight gain essentially arises from an imbalance of energy supply and energy expenditure. Therefore it is not surprising that dieting (restriction of energy input) and exercise (increased energy output) are recommended both to reduce body weight and also for their additional health benefits. However, even a quick survey of the research literature makes it clear that dieting is not very effective in the medium or long term as a method of reducing body weight. People find it hard to be compliant with a particular diet, and are also poor at simply recalling what they have eaten. Thus, food diaries are a notoriously inaccurate way of estimating an individual's total food intake. In addition, reduction of food intake, especially with a low-fat diet, may be associated with a depression of metabolic rate that restricts the actual amount of weight that is lost.
2.7.1 Adipose tissue
In this course, there have been several references to adipose tissue. You probably have a sense of a rather inert (and, perhaps, hard to shift!) tissue acting as a long-term energy store, but this is only a small part of the story.
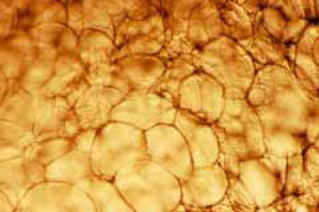
Adipose tissue consists of individual fat cells (adipocytes (Figure 12)) together with connective tissue, a rich blood supply that is shared with adjacent tissues, and innervation from the sympathetic nervous system. The adipocytes are large, clear cells containing stored lipids. The volume of individual adipocytes varies markedly, perhaps as much as tenfold, as adult humans become more or less obese. Mature adipocytes do not divide but differentiate from very much smaller cells known as pre-adipocytes. The number of adipocytes in an adult is influenced by nutrition in fetal and pre-adult life.
Adipocytes are often concentrated into fat depots which are characteristic of both species (e.g. a camel's humps) and gender (e.g. a human female's breasts). However, subcutaneous, intramuscular and intra-abdominal fat depots are found in most mammals. The paunch, characteristic of many primates, including our own species, is formed from a thickening of the outer wall of the abdomen. These various fat depots show differential tendencies to increase in size as an individual becomes more obese. For example, more especially in human males, the paunch and subcutaneous fat in the thigh may be greatly increased, whereas as the intramuscular fat in the calf hardly changes in quantity (Figure 13).
Adipose tissue is usually seen as having a number of functions. You already know that the production of leptin by adipose tissue is a critical component of the homeostatic control of energy balance. In the longer term, adipose tissue may represent a significant energy store to be used in times of low energy availability. In humans, and other mammals, it is also known that release of fatty acids from adipose tissue is an important source of energy during intense or protracted exercise. Interestingly it turns out that there are substantial differences in the ability of different adipose tissue depots to release fatty acids at such times. Much of the release comes from subcutaneous fat rather than, for example, fat in the abdominal paunch. Raised levels of adrenalin in the blood stream together with release of noradrenalin from the sympathetic nerve endings within adipose tissue triggers this process.
It is also increasingly clear that adipose tissue plays a critical role in the homeostasis of fatty acid levels in other body tissues such as the muscles and the liver. This insight has come, in part, from the study of individuals who have abnormally low levels of adipose tissue, a condition known as congenital lipodystrophy. An example is the rare Berardinelli-Seip syndrome which results from a mutation in one of several genes coding for the enzymes critical to the synthesis of triacylglycerols from fatty acids.
Activity 30
Why would an inability to synthesize triacylglycerols impair the ability to store fat in adipose tissue?
Answer
Triacylglycerols are the form in which fat is stored within adipose tissue. Triacylglycerols are synthesized from glycerol and the fatty acids that result from digestion of fats in the diet. A loss of the synthetic pathway for triacylglycerols prevents adipose tissue from storing fat, and the consequence during development is that very little adipose tissue is produced.
One result of congenital lipodystrophy is that high levels of fatty acids accumulate in both muscle and liver. Ironically, people with lipodystrophy share many physiological characteristics with those who are obese. In particular they develop insulin resistance and type 2 diabetes by early puberty. This occurs because the high levels of fatty acids in muscle and other internal organs disturb signalling initiated by the binding of insulin to the insulin receptor. Of course, another characteristic of those with lipodystrophy, but one that distinguishes them from obese individuals, is that they have very low circulating levels of the hormone leptin.
Activity 31
What are the likely consequences of low leptin levels in these individuals and how might they be treated?
Answer
The low levels of leptin will lead to enhanced appetite as a consequence of increased NPY and decreased -MSH levels in the hypothalamus. The increased food intake will simply exacerbate the increased levels of fatty acids within muscle and liver. One potential treatment would be to administer leptin. Early indications (2004) are that this strategy may be successful.
A further function of one specialized form of adipose tissue is heat generation from metabolism of fat. Most adipose tissue has a white appearance, but one specialized form is light brown in appearance. The brown colouration arises from a high concentration of mitochondria within these adipocytes. The normal function of mitochondria is to produce ATP, which is used to provide the chemical energy necessary for the synthesis of complex molecules, such as protein, and many other processes vital to the maintenance and growth of cells. However, in the mitochondria within brown adipose tissue the usual production of chemical energy in the form of ATP can be uncoupled from the oxidative breakdown of fatty acids, sugars and amino acids shown in Figure 3. Since a basic law of thermodynamics states that energy cannot be lost, but only transformed from one form to another, the chemical energy that would have been stored in the ATP must appear somewhere else. In fact it is released from the cell in the form of heat. This uncoupling can be switched on by the release of noradrenalin from the sympathetic nerves that innervate brown adipose tissue. Heat generated by brown adipose tissue metabolism is of particular importance in infants who have a greater surface area to volume ratio than have adults, and also in the process of cold adaptation. At one time it was thought that the stimulation of heat generation by brown adipose tissue metabolism might produce a novel treatment of obesity in which, analogous to regulation of fluid balance by the kidney, energy balance could be achieved by increasing energy loss rather than by restricting energy intake. However, it remains unclear whether adult humans retain enough brown adipose tissue to make a real difference to total energy balance. In addition, it has not proved an easy matter to design drugs that act selectively at the noradrenergic receptors in adipose tissue without having unacceptable side effects elsewhere in the body.
In the same way, as a study described by Blundell et al. (2003) makes clear, exhortation to exercise may also not be very fruitful. In a four-week experiment, both normal and overweight women were prescribed the levels of exercise recommended by the World Health Organization (20 minutes aerobic activity 3–5 times a week). However, there was little effect on either energy expenditure or body weight in the participants, although the prescribed level of activity would have been predicted to lead to a loss of more than 1 kg providing energy intake did not change. The authors reported that their participants found even these moderate levels of activity hard to achieve and speculated that individuals who are already vulnerable to obesity in later life are unlikely to follow a prescribed exercise programme without considerable additional support. Nevertheless, epidemiological data (e.g. Sternfeld et al., 2004) do suggest that even mild exercise over a prolonged period is associated with a worthwhile reduction in the normal age-related increase in body weight observed in middle-aged women.
Current drug treatments for obesity are limited, in part because of problems with side effects. One recent (2004) development, currently in late phase clinical trials, is a drug, known as rimonabant, which is an antagonist at the brain receptors for cannabinoid neurotransmitters. These are the same receptors that mediate the effects of tetrahydrocannabinol (THC), the most active component of marijuana (‘grass’ or ‘hash’) and they are found, amongst other places, in the ventral striatum (Figure 8). Interestingly, one side-effect of marijuana use, first reported more than 2000 years ago, is stimulation of appetite (‘the munchies’).
Activity 32
What effect would you expect a cannabinoid antagonist to have on food intake?
Answer
It should have the opposite effect to marijuana or THC and reduce food intake.
It may be that short term prescription of drugs similar to this, in combination with interventions that are aimed at longer term changes in an individual's diet and activity patterns, will provide more successful therapeutic options for the overweight and obese.
2.8 Summary of Section 2
Obesity is determined by a number of factors including environmental variables, such as the macronutrient content, energy density and fat content of available diets. Using whole room indirect calorimetry it has been found that humans are not good at recognizing the difference between low and high energy diets. Furthermore fat is less good at inducing satiety than are either carbohydrate or protein.
An evolutionary perspective offers an explanation for our inability to choose diets of appropriate energy density, and it is based on an assumption that we are adapted to survive in a very different environment to the one that currently prevails in developed countries.
Palatable foods appear to stimulate the mesolimbic dopamine system (a system also stimulated by sex and drugs such as cocaine). Feeding may be associated with increased release of dopamine in this system. Obese individuals have lower dopamine receptor availability in this system but it is not known whether this is cause or effect.
Increased weight with age might be a consequence of a reduced pattern of activity or a decrease in basal metabolic rate but, when measured in a longitudinal study, it might be attributable to cultural changes in eating habits.
Evidence that body weight has a heritable component comes from studies of adopted individuals and their biological and adoptive parents.
The thrifty genotype hypothesis has been proposed to explain the tendency for some specific groups to veer toward obesity when exposed to the energy- dense diets of the developed world.
A few cases of obesity are attributable to gene defects. These include an inability to produce leptin and faults in the production of human MC4 receptors.
It is notoriously difficult to persuade overweight individuals to stick to a regime that involves taking exercise and reducing calorific intake. Feeding is a pleasurable experience, and hopefully a better understanding of its cellular basis will facilitate the development of drugs that will reduce the food reward and hence appetite.
Conclusion
This free course provided an introduction to studying Science. It took you through a series of exercises designed to develop your approach to study and learning at a distance and helped to improve your confidence as an independent learner.
This OpenLearn course provides a sample of level 2 study in Biology.
References
Acknowledgements
This course was first published in 2005. Some minor updates were made in January 2020.
Except for third party materials and otherwise stated (see terms and conditions). This content is made available under a Creative Commons Attribution-NonCommercial-ShareAlike 4.0 Licence
Grateful acknowledgement is made to the following sources for permission to reproduce material in this course:
Course image: Christian Schnettelker in Flickr made available under Creative Commons Attribution 2.0 Licence.
Figure 1 Open Government Licence. Public Health England in association with the Welsh Government, Food Standards Scotland and the Food Standards Agency in Northern Ireland. Reproduced under the terms of the OGL, www.nationalarchives.gov.uk/doc/open-government-licence © Crown Copyright
Figure 2 Alberts, B., Bray, D., Lewis, J., Raff, M. Roberts, K. and Watson, J.D. (1994) Molecular Biology of the Cell, Garland Publishing Inc.;
Figure 4 Mauro Jermariello/Science Photo Library;
Figure 5 Bender, D.A. (1993) An Introduction to Nutrition and Metabolism, Taylor and Francis;
Figure 6 Prentice, A.M. and Jebb, S.A. (2003) Fast foods, energy density and obesity, Obesity Reviews, 4, Copyright © The International Association for the Study of Obesity;
Figure 7 Ozanne, S.E. and Hales, C.N. (2002) Early programming of glucose-insulin metabolism, Elsevier Science Ltd.;
Figure 9 Wang, G-J et al. (2001) Brain dopamine and obesity, The lancet, 357, Elsevier Science Ltd.;
Figurae 10 National Center for Chronic Disease Prevention and Health Promotion, Atlanta, USA;
Figure 12 Courtesy of Caroline Pond, The Open University.
British Nutrition Foundation, concept for the balance of Good Health Model, copyright Food Standards Agency
Don't miss out:
If reading this text has inspired you to learn more, you may be interested in joining the millions of people who discover our free learning resources and qualifications by visiting The Open University - www.open.edu/ openlearn/ free-courses
This free course is adapted from a former Open University course called 'Human biology (SK277)'.