Information technology: a new era?
Use 'Print preview' to check the number of pages and printer settings.
Print functionality varies between browsers.
Printable page generated Tuesday, 23 April 2024, 8:19 AM
Information technology: a new era?
Introduction
This course takes one aspect of the debate concerning the new economy – innovation in the form of the introduction of information and communication technologies – and places it in the historical context of industrial revolutions. Is the new economy really new or ‘just another’ industrial revolution?
This OpenLearn course provides a sample of Level 1 study in Sociology.
Learning outcomes
After studying this course, you should be able to:
understand the relationship between technological change and industrial revolutions
appreciate the pervasive effect that new technologies can have on the economy and, in particular, on productivity
understand how industry dynamics can be analysed using the ‘industrial life cycle’ model
use data and historical examples to support economic arguments.
1 Technological advancement
Everything that can be invented has been invented.
(The Commissioner of the United States Office of Patents, 1899, recommending that his office be abolished, quoted in The Economist, 2000, p. 5)
There is nothing now to be foreseen which can prevent the United States from enjoying an era of business prosperity which is entirely without equal in the pages of trade history.
(Sutliff, 1901)
The rise of information and communication technologies (ICT) – that is, computers, software, telecommunications and the internet – and the large impact that these new technologies are having on the way that society functions, have prompted many to claim that we have entered a new era, often referred to as the ‘Third Industrial Revolution’, the ‘information age’ or the ‘new economy’. Previous industrial revolutions were also linked to the rise of new technologies: the First Industrial Revolution, concentrated in Britain from around 1760 to 1850, introduced Cort's puddling and rolling process for making iron, Crompton's mule for spinning cotton and the Watt steam engine; the Second Industrial Revolution, from around 1890 to 1930, witnessed the development of electricity, the internal-combustion engine, the railway and the chemical industry. In each of these cases, the new technologies allowed new industries to develop and economic growth to increase.
The concept of the ‘new economy’ is thus a claim that the emergence of new information technology (IT) was responsible for the economic prosperity (e.g. rising incomes, rising employment) experienced by most Western countries in the 1990s. This was the decade in which personal computers (PCs) were diffused throughout the economy, and the decade which saw the commercial rise of the World Wide Web. The PC reached a 50 per cent household penetration rate in the USA only in 1999, while before 1990 the internet was used mainly by the US Defense Department, not for commercial purposes.
However, as the two introductory quotations indicate, proclamations that we have entered a ‘new’ era are not new. In fact, the advent of electricity, the internal-combustion engine and the radio telegraph witnessed similar proclamations about the future. They too emerged during periods of prosperity; for example, electricity and the automobile diffused through the economy during the prosperous and ‘Roaring’ 1920s. So how can we tell whether we are really entering a qualitatively new era or whether recent changes have simply been a quantitative extension of the past?
This course uses tools and frameworks from economics to study this question. It focuses on the historical and theoretical relationship between changes in technology, productivity and economic growth. The key driving force discussed will be technological change: that is, organisational and technical changes in the way that societies organise production and distribution. The question is: what exactly is so new about the ‘new economy’? Some economists focus was on the effect of new technologies and work practices on the way that people live and work, here the focus is on the organisation and evolution of firms and industries.
In each industrial revolution (including the current one), important non-technological factors have influenced industry dynamics and growth. Socio-political factors have been particularly prominent. For example, the rise of industrial trade unions in the Second Industrial Revolution greatly affected firm-level, industry-level and country-level growth. In this course, however, the analysis is limited to the role of technology.
We shall conduct our investigation by focusing on two related questions, neither of which has a clear-cut answer. The goal of the course is to help you to think about these questions using concepts and tools from economics.
First, after a brief overview of the concept of the industrial revolution, I shall ask whether the rise of IT has significantly affected economic growth, as new technologies did in previous eras. Focusing on the effect of technology on economy-wide growth implies that the perspective is a macroeconomic one. Macroeconomics looks at the functioning of the economy as a whole.
Second, I shall take a more microeconomic perspective. Microeconomics looks at the functioning of individual elements of the economy, whether they be consumers, firms, industries or markets. I shall ask whether the rise of new information technologies has fundamentally changed the way that individual firms and industries operate. To do this, I shall compare the patterns that characterised the early phase of a traditional industry with those that characterised the early phase of a relatively new industry. The traditional industry (one that is today considered to be relatively ‘mature’, not high growth) is the US automobile industry from 1900 to 1930, while the relatively new industry is the personal computer industry from 1975 to 2000. The similarities will lead us to ask whether we are really in a ‘new economy’ or simply in an economy driven, as in some past eras, by the development of new industries.
2 Technological change and economic growth
2.1 Industrial revolutions and technological change
In this section I shall look at the way that technological innovations in previous eras, such as the invention of electricity in the early 1900s, radically affected the way society organised production and at how these changes spurred general economic growth. In many instances, the changes were so large that they defined an entire period, just as the rise of information technologies has led some to call the current era the ‘information age’.
The way that technological change can fundamentally alter society is best viewed through the lens of previous industrial revolutions. The term Industrial Revolution usually refers specifically to the series of technological changes that occurred in England between 1760 and 1850 (such as steam power). More generally, the term refers to eras when rapid and significant technological changes fundamentally alter the way that production is carried out in society, affecting not only how people work but also how they live their lives. Consider the impact that electricity in the Second Industrial Revolution had not only on factories but also on the lives of families in their homes. Thus an industrial revolution occurs when new technological inventions and innovations fundamentally transform the production processes of goods and services to such an extent that all society is affected.
For our purposes the words ‘invention’ and ‘innovation’ can be used interchangeably. More specifically, however, the term ‘invention’ refers to the discovery of new products or processes, while ‘innovation’ refers to the commercialisation (bringing to the market) of new products or processes. Furthermore, we can distinguish between product innovations and process innovations. Product innovations result in the production of a new product, such as the change from a three-wheel car to a four-wheel car, or the change from LP records to CDs. Process innovations increase the efficiency of the methods of production of existing products, for example the invention of the assembly-line technique.
The inventions and innovations that form industrial revolutions are those that open new doors and create new ways of doing things, not simply those that fill gaps in existing ways of doing things (Mokyr, 1997). The core of the First Industrial Revolution in the eighteenth century was a succession of technological changes that brought about material advances in three basic areas: (1) the substitution of mechanical devices (such as machines) for human labour; (2) the substitution of inanimate sources of power (such as steam) for animate sources of power (such as horse power); and (3) the substitution of mineral raw materials for vegetable or animal substances, and in general the use of new and more abundant raw materials (Landes, 1972).
These changes in technology and equipment occurred simultaneously with changes in organisational arrangements. For example, at the end of the nineteenth century the rise of electricity and the internal-combustion engine allowed the factory system to emerge, which radically changed the organisation of work. The factory system, used first for the production of cotton but then extended to other industries, created a new, unified system of production which replaced the craft labour carried out in individual workshops. The main innovation of this new system was that it allowed workers to be brought together for the first time under common supervision with strict discipline, and it also introduced the use of a central, usually inanimate, source of power. The factory system enabled production to become more efficient as it allowed the company to spread its costs over a much larger output, a dynamic called ‘economies of scale’.
Economists interested in the pervasive effects of technological change in different industrial revolutions have devised the concept of a general purpose technology (GPT). A GPT is a technology that is general enough to be used in various industries and has a strong impact on their functioning. There are four main characteristics of a GPT (Lipsey et al., 1998). As you read the list, consider how a new technology such as electricity or information technology fulfils each criterion.
It must have a wide scope for improvement and elaboration. This means that the technology does not appear as a complete and final solution, but as a technology that can be improved through the different opportunities for technological change that surround it.
It must be applicable across a broad range of uses. This means that its use is not restricted, for example, to only one industry but open to many different types of industries and consumers.
It must have a potential use in a wide variety of products and processes. This means that the new technology should not result in the creation of only one set of products (such as a computer), but a wide set of products (such as complex new air-traffic control systems or new inventory controls).
It must have strong complementarities with existing or potential new technologies. This means that the technology does not only replace existing methods but also works with them, ensuring an even broader impact on the systems of production and distribution.
Examples of GPTs include different power delivery systems (water-wheel, steam, electricity, internal-combustion engine), transport innovations (railways and motor vehicles), lasers and the internet. The invention of the internal-combustion engine not only made possible personal automobiles, motor transport and air transport, but also created ‘derivative’ inventions such as the suburb, the motorway and the supermarket. Electricity allowed the work day to be extended (allowing for different shifts in a 24-hour period), gave a huge impetus to the entertainment industry, and greatly enhanced manufacturing process technologies. (We shall also see how it created the conditions for ‘mass production’ via the moving assembly line.)
GPTs are important because they spur technological change in different areas (and this effect is behind the first three characteristics of GPTs listed above). In fact, radical technological changes are often cumulative changes: change in one area leads to change in another area. David Landes is an economic historian and his account of the way in which the invention of the steam engine caused changes in many different industries has become well known. He calls this process ‘technological interrelatedness’.
In all this diversity of technological improvement, the unity of movement is apparent: change begat change. For one thing, many technical improvements were feasible only after advances in associated fields. The steam engine is a classic example of this technological interrelatedness: it was impossible to produce an effective condensing engine until better methods of metal working could turn out accurate cylinders. For another, the gains in productivity and output of a given innovation inevitably exerted pressure on related industrial operations. The demand for coal pushed mines deeper until water seepage became a serious hazard; the answer was the creation of a more efficient pump, the atmospheric steam engine. A cheap supply of coal proved a godsend for the iron industry, which was stifling for lack of fuel. In the meantime, the invention and diffusion of machinery in the textile manufacture and other industries created a new demand for energy, hence for coal and steam engines; and these engines, and the machines themselves, had a voracious appetite for iron, which called for further coal and power. Steam also made possible the factory city, which used unheard-of quantities of iron (hence coal) in its many-storied mills and its water and sewage systems. At the same time, the processing of the flow of manufactured commodities required great amounts of chemical substances: alkalis, acids, and dyes, many of them consuming mountains of fuel in the making. And all of these products – iron, textiles, chemicals – depended on large-scale movements of goods on land and on sea, from the sources of the raw materials into the factories and out again to near and distant markets. The opportunity thus created and the possibilities of the new technology combined to produce the railroad and steamship, which of course added to the demand for iron and fuel while expanding the market for factory products. And so on, in ever-widening circles.
(Landes, 1972, pp. 2–3)
Question 1
Can you think of new industries that have grown out of the PC and the internet?
Answer
You may have thought of online shopping, internet banking, digital cameras, information services (such as online recipes) and computer desks. Having reflected on the nature of technological change and its role in defining industrial revolutions, we shall now examine how technological change affects the efficiency of firms and hence general economic growth.
2.2 The effect of technology on productivity
In each industrial revolution, new inventions radically changed the way that production and distribution were organised, and often led to large and rapid increases in the efficiency of production. The rise of electricity, for example, allowed US productivity to increase in the manufacturing sector (as opposed to the agricultural or service sector) by more than 5 per cent per annum throughout the 1920s.
Let us pause a moment and consider what this means. The term productivity refers to the amount of output that a given amount of inputs (such as hours of labour) can produce. (Productivity is an indicator of the efficiency of production or distribution. Labour productivity can be measured as output produced per hour of labour.) For example, consider an automobile factory that is able to produce 10 cars per day using 100 hours of labour. If a new invention permits those same workers to produce 20 cars in the same amount of time, their productivity has been doubled.
The productivity of a whole economy, such as the UK economy – as opposed to a particular factory – is measured by first calculating the total output produced by the economy in one year. This is called the GDP or gross domestic product. Total output divided by total labour hours in the year gives us a measure of labour productivity. A 5 per cent growth in UK productivity over a year means that the UK economy has become 5 per cent more productive than it was in the previous year. This should mean that the economy can produce 5 per cent more output (GDP) with the same amount of inputs.
Question 2
Stop here and check your understanding of percentages and growth rates. They are quite simple, but it is important to get them clear. If a group of workers produces 10 000 units of output in one year, and 12 000 units the next year, how would you calculate the percentage increase in productivity?
Answer
You want to know the percentage increase represented by the second year's output, 12 000, over the first year's output, 10 000. Subtracting 10 000 from 12 000 gives us the increase. Divide the answer by 10 000 to calculate the increase relative to the first year. Then multiply by 100 to turn the answer into a percentage (the dot‘ ·’ means ‘multiplied by’).

So, output increased by 20 per cent. As the number of workers stayed the same, this is also the increase in productivity.
Exercise 1
If you want to check your understanding of percentages, calculate the percentage increase in productivity if the output expands from 12 000 in year 2 to 15 000 in year 3.
Answer
15 000 − 12 000 = 3000
![]()
The increase is 25 per cent.
In plumbing, for example, productivity would increase if the use of new materials enabled plumbers to fix broken pipes more quickly. This would free up more time for plumbers to work on other operations and hence increase their output per hour, that is, their productivity. Productivity can increase either when work methods are made more efficient without (necessarily) the introduction of new technology, perhaps from a better organisation of the factory floor, or when new methods are introduced to the production process through the introduction of new technology – for example, when new machinery allows work to be done more quickly and with fewer mistakes. Adam Smith (1723–90), one of the founders of modern economics, claimed that increases in productivity lie at the heart of economic growth and prosperity. In his influential book The Wealth of Nations (first published in 1776), Smith uses the example of pin making to describe the process by which productivity can increase through a rise in the division of labour, that is, the degree to which workers divide tasks between themselves. The rest of his classic text is dedicated to describing the effect of increasing productivity on the development of markets and economic growth:
The greatest improvement in the productive powers of labour, and the greater part of the skill, dexterity, and judgement with which it is anywhere directed, or applied, seem to have been the effects of the division of labour … To take an example, therefore, from a very trifling manufacture; but one in which the division of labour has been very often taken notice of, the trade of the pin-maker; a workman not educated to this business … nor acquainted with the use of the machinery employed in it … could scarce, perhaps, with his utmost industry, make one pin a day, and certainly could not make twenty. But in the way in which this business is now carried on not only the whole work is a peculiar trade, but it is divided into a number of branches, of which the greater part are likewise peculiar trades. One man draws out the wire, another straightens it, a third cuts it, a fourth points it, a fifth grinds it at the top for receiving the head; to make the head requires two or three distinct operations; to put it on, is a peculiar business, to whiten the pins is another, it is even a trade by itself to put them into the paper; and the important business of making a pin is, in this manner, divided into about eighteen distinct operations, which, in some manufactories, are all performed by distinct hands, though in others the same man will sometimes perform two or three of them. I have seen a small manufactory of this kind where ten men only were employed, and where some of them consequently performed two or three distinct operations. But though they were very poor, and therefore but indifferently accommodated with the necessary machinery, they could, when they exerted themselves … make among them upwards of forty-eight thousand pins in a day.
(Smith, 1937, pp. 65–6)
Question 3
What are the different tasks, outlined by Smith, involved in pin making? Why does productivity increase when these tasks are divided between workers instead of all being done by one worker, that is, when the division of labour increases?
Answer
The division of labour (the degree to which the various tasks involved in the production of a good or service are divided among different workers), as described here by Smith, increases the productivity of workers by allowing them to concentrate on a fixed and simple task, and hence to become more efficient at that task over time. (Smith also warned of the negative effect that this repetition could have on the workers’ intelligence and morale.)
The division of labour, and hence productivity, increased with the emergence of the factory system, in which many workers were brought together under one roof for the first time and each worker was responsible for a small part of the final product. This was very different from the craft manufacture system, in which each worker was responsible for producing the entire product.
Increases in productivity, even if just in one industry, can be transmitted throughout the economy for several reasons. First, increases in productivity can lead to higher incomes for an economy's citizens. All output must be transformed, through the process of production and sale, into someone's income (e.g. the boss's profits and the workers’ wages). Hence, increases in productivity, which allow more output to be produced by a given amount of inputs, also lead to more income per head, that is, greater wealth for society. For example, if more cars can be produced due to increases in the productivity of car production, more cars are sold, which means that the car manufacturers’ revenues increase. Furthermore, if, as is sometimes the case, increases in wages are linked to increases in productivity, then workers’ wages may also rise (or, at least, their employment prospects maybe more secure).
Second, increases in productivity diffused throughout the economy have an effect on prices. Increases in productivity tend to lower the cost of production, precisely because more output can be produced with the same amount of inputs. Since cost reductions tend to be translated into price reductions, increases in productivity eventually tend to reduce prices. Indeed, the introduction of assembly lines made a substantial contribution to the affordability of consumer durables such as the car. The increase in income per head and the reduction in prices allow consumers to be better off. This potential increase in the wealth of manufacturers, workers and consumers is the reason Adam Smith's book, which focused on the links between productivity and economic growth, was titled The Wealth of Nations.
Productivity may also increase for reasons not related to technological change, for example if workers are simply ‘exploited’ more (with or without new technology). Output per worker may increase if workers are forced to work more quickly or for longer hours, prevented from taking lunch breaks, or given no holidays. These are all conditions that still persist today in some low-income countries, as well as in some industries in those Western countries in which workers are not unionised and/or work in ‘sweatshops’, that is, factories that operate illegally in terms of international standards for wages and working conditions.
For a new technology to affect economy-wide productivity it must be widely adopted across industries instead of being restricted to a narrow domain. For example, full electrification of factories did not occur until the 1920s. Prior to that, from the 1890s to the beginning of the 1920s, most factories simply added electric motors to existing (older) equipment. Until the 1920s power transmission in factories was still operated through the ‘group drive’ system, in which only parts of the factory were electrified and electric motors turned separate shafts. The ‘unit drive’ system did not appear until the boom period of the 1920s, which opened up the potential for new, fully electrified plants (David and Wright, 1999). The switch from group to unit drive transmission allowed individual electric motors to run machines and tools of all sizes. The new unit drive not only allowed huge savings in fuel and energy efficiency, but also allowed the factory layout to be more amenable to the assembly-line system, which spread throughout the economy in the 1920s (although it had first been used by Ford Motors in 1910). The new technology facilitated the circulation of materials, made workers more productive and reduced downtime, as the entire plant no longer had to be shut down to make changes in just one department.
Exercise 2
Write a short paragraph (of not more than 100 words) describing the impact of technological change on economic growth. You should use the key concepts introduced in Section 2, although you do not have to define them.
Answer
Here is my answer
A period of technological change that transforms the way that goods are produced and distributed is known as an ‘industrial revolution’. A general purpose technology such as electricity, which stimulates constant improvements and is used widely across the economy, may initiate improvements in productivity or the efficiency of production. A further elaboration of the division of labour within the economy, exemplified by the factory system, is also likely. The result is an increase in the total output of the economy known as ‘economic growth’ and, usually, an increase in the wealth of producers and consumers.
3 Information technology, productivity and growth
3.1 The impact of information technology
Having discussed the radical and pervasive effect that inventions in previous eras have had on economy-wide productivity, and how they have even defined entire periods, we shall now ask how the rise of information technology compares to these previous revolutions. During the early growth phase of PC use, a leader article in Fortune magazine did not hesitate to compare the rise of the PC to previous technological revolutions.
The chip has transformed us at least as pervasively as the internal-combustion engine or electric motor.
(Fortune, 8 June 1988, pp. 86–7)
In fact, the debate about the ‘new economy’ is a debate about whether the computer and the internet have had an impact on the economy as great as that of other GPTs in previous eras.
Question 4
Would you say that the personal computer is a GPT?
(Hint: in what ways is it applicable across a broad range of uses?)
Answer
The personal computer (PC) qualifies as a GPT due to the wide-ranging and pervasive effect it has had on the economy. Given the four characteristics of GPTs, consider how it: (1) has continued to experience radical improvements, such as the doubling of processor speed every 18 months (known as ‘Moore's Law’), (2) is applicable across a wide variety of industries, from online trading to inventory control in factories, (3) has created the need for new products and processes, such as the production of portable printers, and (4) is often used alongside older technologies, such as the use of computer-aided design/manufacturing (CADCAM) to reduce inventory alongside traditional assembly lines. Furthermore, as happened with electrification, for many years the PC did not break free from its predecessor, the mainframe, but served mainly to support it (as display terminals). Only in 1990, with the emergence of the Wintel platform, that is, the interaction between the Windows operating system and the Intel processor, did the PC break free from IBM's grip on the mainframe computer market.
The emergence of IT has created new products, processes and distribution systems. New products include the computer, the internet and digital TV; new processes include internet banking, automated inventory control and automated teller machines; and new distribution systems include cable and satellite TV. But the evidence does not fully support the claim that IT has affected economy-wide productivity in the same way as technological change in previous eras. In the late 1980s Robert Solow, a Nobel prize-winning economist from the Massachusetts Institute of Technology, summarised the problem as follows: ‘Computers appear everywhere but in the productivity statistics’ (Solow, 1987). The ‘Solow Paradox’, as this is often called, addresses the fact that the wave of inventions based on the microprocessor and the memory chip failed to generate the economy-wide increases in productivity that previous technological revolutions had produced. Only in the mid 1990s did productivity growth seem to be on a rebound: between 1975 and 1995 the annual average productivity growth for the business sector in the USA (i.e. non-agricultural production) was only 1.4 per cent per annum; after 1996 the annual average rose to 2.9 per cent. In the first two quarters of 2000 the figure reached 5.2 per cent, putting it on a par with the productivity increase that occurred after the electrical revolution. In the past, new technologies such as electricity began to affect economy-wide productivity only once they had reached the 50 per cent penetration rate (i.e. when 50 per cent of households and/or businesses used the technology). For electricity, this occurred in the 1920s. Since PCs reached the 50 per cent mark in the USA only in 1999, it might still be too early to ask whether the computer is showing up in the productivity statistics.
3.2 Is productivity sustainable?
Are the recent increases in productivity sustainable? The answer to this question, and the crux of the debate concerning the effect of IT, centres on distinguishing whether recent increases in productivity are just cyclical, and hence temporary, or whether they are the beginning of a new and long-lasting trend. If the increase in productivity in the USA in the late 1990s was cyclical, this means that it occurred simply because the US economy as a whole was undergoing a boom in the latter half of the 1990s, and the increases will disappear now that (as I write) the boom is over. All economies fluctuate in a business cycle. For a few years, growth is quite rapid, output and incomes rise, and unemployment falls. This is the ‘boom’. Then the cycle turns. Growth slows, and in a true recession the total output of the economy falls. This is the down-turn of the cycle. The cycle is driven by changes in consumer spending and business investment and, historically, a boom or recession tends to last three to eight years.
However, if the productivity increases of the late 1990s, especially in the USA, were a trend increase, this means that the rise in productivity was independent of the business cycle and resulted from the characteristics of new technologies or specific government policies. For example, if a new technology allowed the productivity of many industries to increase permanently, it would create a trend increase in productivity. If the rise in productivity persisted during a recession, it would be further evidence of a trend. Indeed, the word ‘new’ in the ‘new economy’ implies that the increase was a trend related to the characteristics of the new technologies (otherwise it would not be new).
IT can affect productivity by increasing the efficiency of the IT-producing sectors, such as computer manufacturers, and/or by increasing the productivity of the IT-using sectors, such as the service industries that process data using computers. There is really no debate at all on the former point: all agree that industries such as the computer and software industries have experienced great productivity increases due to the radical and rapid nature of technological change in these industries. In the 1990s the average productivity growth in the IT-producing sectors was 24 per cent per year, well above that of the other manufacturing sectors. The disagreement, therefore, is about the effect of IT on the rest of the economy.
The optimists in this debate, including Alan Greenspan, Chairman of the US Federal Reserve Bank (1987–2006), argue that the rise of IT has allowed most advanced capitalist economies to achieve a permanent (trend) higher level of productivity, because of the ways in which the new technologies have improved efficiency, for example through better control of inventories and cheaper access to information. They argue that IT has caused firms to increase their investment in capital equipment per worker and that this has occurred simultaneously with large increases in the productivity of other inputs, both machinery and labour, two-fifths of which has come from efficiency gains in computer production alone. These optimists argue that productivity increases will persist into the future, due to the rise in research and development spending and the rise in investments in business capital, including computers. Such investments, argue the optimists, should allow productivity to keep growing.
Pessimists, such as the US economist R.J. Gordon, claim that recent productivity gains have been only cyclical, that is, a result of the fact that the US economy has been experiencing a boom. A boom can cause productivity to increase because there is more work to be done during prosperous periods and hence there is a greater incentive for employers to work employees harder, making them more productive – and leading to an increase in productivity. To support his point, Gordon (2000) provides data showing that most of the productivity gains have been limited to the IT-producing sectors (such as the personal computer industry) and have not spread out to other sectors, including the IT-using sectors. In fact, after excluding the manufacture of durable goods and computers (12 per cent of the economy), and after adjusting for the business cycle, the statistics do not show any productivity increases in the remaining portions of the economy! And to make things even worse, it is in those sectors where IT has been used the most, such as financial services, that productivity increases show up the least.
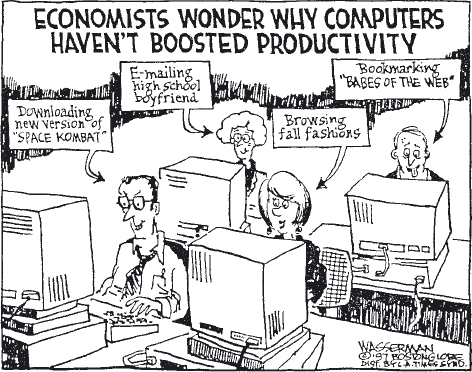
Gordon (2000) claims that it is not so surprising that the rise of the internet has not affected productivity to the same degree as the development of electricity did. Unlike electricity, the internet has not produced new products; it has simply substituted for existing products (e.g. the substitution of online purchasing for mail-order catalogues). Likewise, most of the changes are in terms of market shares not productivity: what one company wins the other loses, as is evidenced by the effect that Amazon.com is having on the profitability of the big bookshop chains Borders and Waterstones. Electricity, however, made possible the invention of many new products such as the vacuum cleaner and the refrigerator. The electric motor, the aeroplane, the telephone and even the indoor flush toilet, invented by the Englishman Thomas Crapper in 1886, have had more effect on productivity than the internet. Surfing the internet may be fun and is often useful, but can its impact on production be compared to the effect of electricity on the illumination of factories and the rise of the assembly line? Some go as far as to say that, if anything, the internet has reduced productivity by distracting people from serious work, a claim that is behind the popular joke that IT stands for ‘insignificant toys’ (Figure 1). Gordon (2000) quotes the finding by Active Research Inc., a San Francisco internet-based market research company, that online shopping does not peak in the evening when workers are at home, but in the middle of the day when they are in the office!
Other sceptics point to the possibility that the rise in US productivity has been due more to the increased flexibility of the US labour market than to any specific characteristics of information technology. OECD studies comparing the US experience with that of other developed countries have found that the high US productivity growth in the mid 1990s was followed only in Australia, Finland and Canada, and not at all in Germany, Italy, France and Japan, which have less ‘flexible’ labour markets (Colecchia and Schreyer, 2002). Flexible labour markets are defined as those in which there are fewer government (and trade union) regulations concerning working conditions and pay scales and in which industrial trade unions are weaker or non-existent. For example, it is well known that in the USA workers can be fired much more easily (often indiscriminately) than in European countries. Hence, a lesson that may be drawn from the OECD reports, although it is not stated directly, is that the higher productivity of the ‘flexible’ countries might be due, not to IT, but to the fact that workers in those countries can be worked harder, paid less and fired more easily.
However, Gordon's (2000) findings have been criticised in turn for not taking into account the difficulty of measuring productivity in an economy characterised by rapid technological change. The issue here is that the traditional measurements of output used to calculate productivity figures do not take into consideration changes in the quality of output, such as improved product quality, choice, time savings and convenience. This is a big problem for productivity calculations as it means that if more change occurs on the quality side than on the quantity side, that is, better products rather than more products, the total change in output will be severely underestimated.
This problem is even greater in the service sector as most service improvements come in terms of not more services but better services. For example, output in the health-care industry will be underestimated if all that is counted is patient throughput or treatment episodes, without accounting for the extent to which consumers enjoy better treatment. Quality improvements in health care include better diagnosis, new medical equipment and less invasive treatments. Another example is provided in a study cited by The Economist (2000). This study claimed that when changes in the quality of output are not recognised, output in the US banking industry appears to have grown by only 1.3 per cent between 1977 and 1994. If quality changes are included, for example by taking into account the rise of automated teller machines and online banking, the study argued that output appears to have grown by 7 per cent!
Another way in which consumer satisfaction is not recognised in traditional productivity accounts is by neglecting the wider choice that people have in the products they buy. In the extreme case, if the same amount of output is produced in one year as in the previous year, but the choice of products has doubled, the official measures would not pick that up as a change in output. These are not problems in a world of mass production, where the point is to produce a lot of standard goods for the general consumer, but they are problems in the world of mass customisation, where the point is to produce the ‘right’ goods for the specific consumer. Nonetheless, economists have devised methods to tackle these problems, some of which will be discussed in Section 4.
3.3 A summary
I have shown that, while IT has no doubt had an impact on productivity, it is not clear whether this goes beyond the IT-producing sector, or whether the gains will outlast the boom period of the business cycle. With so much debate, whom should we believe? Perhaps, as is often the case, the truth lies somewhere in the middle. The optimistic view highlights the way that IT has transformed society, and how this transformation has in many instances led to growth through the productivity-enhancing aspects of IT. The pessimistic view reminds us to be cautious in attributing such growth solely to the rise of IT, given that the rise in productivity has occurred during the boom period of the business cycle. Others argue that perhaps the productivity increase has occurred as a result of influences unrelated to IT, such as the rise of flexible labour markets. If the increase continues, it would appear that the productivity increases have been trend increases. If they fall, it would appear that they are more cyclical in nature.
Exercise 3
List two or three things that could happen in the US economy in the future that would go some way towards settling the debate between optimists and pessimists on the impact of IT.
Discussion
Three things that could happen in industrialised economies in the future that would go some way towards settling the debate between optimists and pessimists on the impact of IT on productivity in favour of the optimists/pessimists are:
the US ecomony endures a recession and productivity growth remains unusually high/falls back to its historical average;
other industrialised economies with relatively inflexible labour markets experience/fail to experience a surge in productivity led by IT;
a permanent trend rise in productivity begins/is not observed a few years after PCs reach 50 per cent market saturation in successive economies.
4 ‘Garage tinkerers’: new economy or industry life cycle?
4.1 Introduction
As you have now seen, the concept of the ‘new economy’ has inspired a number of studies that compare the effect that new technologies have had on economy-wide productivity in previous eras with the effect that IT has – or has not yet – had in the current era. I shall now ask another question, still along the lines of ‘what's new in the new economy?’, but this time from a more microeconomic perspective, which focuses on the individual firm and industry rather than on the whole economy. (Look back at the distinction made in Section 1 between microeconomics and macroeconomics.) I shall ask whether the information revolution, that is, the emergence of IT as a new GPT, has changed the way that firms and industries evolve.
Why should we ask this question? Well, just as there is a debate about whether the ‘new economy’ has changed the dynamics of productivity, there is also a debate about whether the ‘new economy’ has changed the way that firms and industries operate and evolve. For example, some claim that the ‘new economy’ has made technological change and entrepreneurial activity more important to company survival than it was before, and hence has heightened the role of small, flexible and innovative firms. Others claim that technological change, new ideas and entrepreneurial activity were just as important in the early phase of industries that emerged before the ‘new economy’ era. Rather than investigating this debate through the views of optimists and pessimists, as we did above, we can dive right in by comparing an old-economy industry, the US automobile industry, which has been around for 100 years, and a new-economy industry, the US personal computer industry. The goal is to see whether patterns that are claimed to be characteristic of new high-tech industries were just as common in the early development of a traditional industry. These patterns include the role of small entrepreneurial firms (‘garage tinkerers’), the rapidity with which firms rise and fall, and the importance of technological change for company survival.
4.2 The industry life cycle
The comparison between the automobile industry and the PC industry makes sense only if we concentrate on similar periods in their evolution. We will concentrate here on the ‘early’ development of both industries, in what will be called the ‘introductory’ and ‘early growth’ phases in their life cycles. This is the period running from 1900 to 1930 in the automobile industry and from 1975 to 2000 in the PC industry. The automobile industry refers here to all firms producing cars and trucks, and the PC industry refers to all firms producing personal computers (i.e. laptops and desktops rather than mainframes or workstations). To make the comparison as tight as possible, only the US market of each industry is studied, that is, US and foreign firms selling in the US market. Looking at the international market would inevitably cause us to consider other factors independent of industrial dynamics, such as different countries’ business cycles and politics. We will not keep referring to US industries in what follows, but to help you to remember what we are discussing we will use the American term ‘automobile’ throughout this section rather than the British ‘car’.
We will use the ‘industry life cycle’ framework to study the two industries side by side, highlighting similarities and differences in their development over time. The industry life-cycle framework focuses on those economic mechanisms that cause firms to be born (to ‘enter’ an industry), to grow, and possibly to die (to ‘exit’ an industry). It also examines how these mechanisms affect changes in the industry structure. Industry structure refers to the characteristics of an industry, such as the number of firms operating in it, the distribution of power between them (whether some are very large and others very small, or whether they are all very large), and the degree to which new firms find it easy to enter the industry. Mechanisms affecting industry structure include the dynamics of entry and exit, technological change and falling prices. It is, therefore, on mechanisms such as these that we will focus. The industry life cycle is characterised by different phases.
A pre-market or hobbyist phase, in which the product is produced more as a hobby or luxury than for commercial purposes. This phase is characterised by much variety in the characteristics of both firms and the product versions they produce.
An introductory phase, in which the product begins to be produced more for commercial purposes than for hobby reasons. This phase is characterised by the rapid entry of many new firms which seek to take advantage of the new profit opportunities. Entry occurs principally through technological change, that is, each firm enters with a different version of the product, so this phase is the one characterised by the most product innovation.
A growth phase, in which the industry grows rapidly due to the emergence of a standardised product. A standardised product refers to the convergence of industry production around a product with a given set of characteristics (e.g. a four-wheeled car with a roof). Efficiency in the industry increases, as the standardised product can be mass produced (not possible if the product is undergoing too much change), and demand for the product rises as consumers learn more about it. Those firms not able to produce the standardised product efficiently are forced to ‘exit’ the industry (more on this below).
A mature phase, in which demand slackens and fewer technological opportunities are available. If a new product innovation is introduced in the mature phase of the industry (e.g. the replacement of LP records with CDs in the music industry) the industry life cycle may start anew as new firms enter to profit from the new technological opportunities provided by the new product. However, whether the existing leaders remain the leaders will depend on whether the new innovations build on the leaders’ existing capabilities and hence strengthen their position, or make those capabilities obsolete and hence threaten their position.
I shall now review these different phases in more detail through an analysis of the evolution of the US automobile and PC industries. We will see that there are some remarkable similarities in the early development of these two industries.
4.3 Live fast, die young
Both the automobile and PC industries were characterised by a great deal of turbulence in the first 20 to 30 years of their existence. In both cases, many new firms entered the industry, introduced new varieties of the product, and soon left the industry, leaving only a few dozen firms to compete during the growth phase. By 1926 only 33 per cent of the firms that had started producing automobiles during the previous 22 years had survived. In the case of PCs, by 1999 only 20 per cent of the firms that had started producing PCs had survived. In both cases, the majority of firms did not last more than five years! This turbulent ‘live fast, die young’ period of great entry and exit is characterised by a lot of technological change. Let us look at this in more depth.
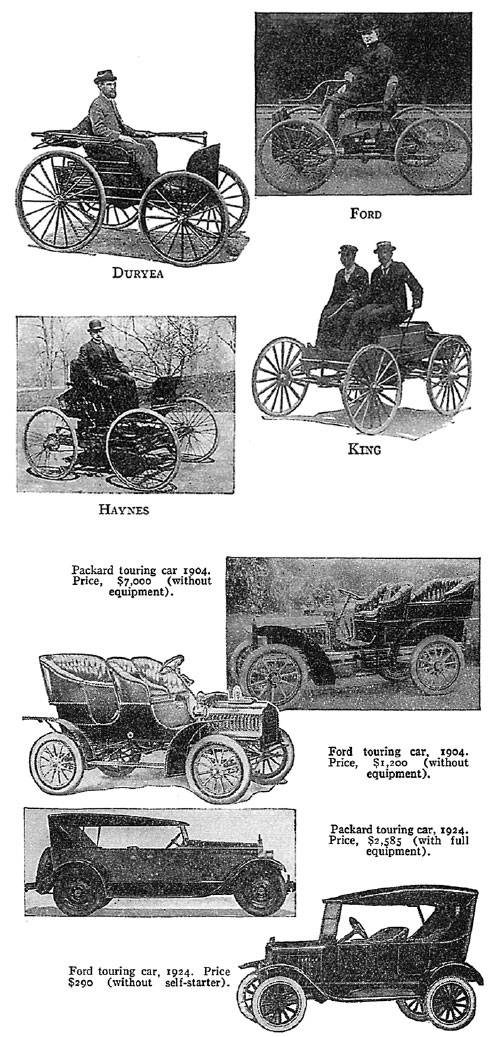
The hobbyist period in the automobile industry lasted approximately from 1885 to 1900. The first internal-combustion engine was invented in 1877 by Nikolaus Otto in Germany, and the first car (three-wheeled!) was invented in 1885 by Karl Benz, also in Germany. The first four photographs in Figure 2 show that between 1893 and 1899 automobiles were simply ‘horseless carriages’. They were the products of experiments carried out by ‘tinkerers’ in their homes or workshops. Carroll and Hannan (2000) document 3845 ‘pre-production’ organising attempts in the US automobile industry, of which only 11 per cent reached the market place.
The introductory period, in which cars began to be manufactured commercially, started in 1900. Before this date the automobile industry was not even listed in the census of manufacturers under a separate heading, yet by 1926 it had already attained an equal importance to shipbuilding and railroads (Epstein, 1928, p. 30). In 1901 Oldsmobile produced the world's first mass-produced automobile, and in 1910 the Ford Motor Company used the industry's first branch-assembly plant, that is, an assembly-line system for mass-producing cars, to produce the Model T, which soon became close to an industry standard. The period between 1900 and the end of the 1920s witnessed the most variety in product versions ever experienced in the industry. The second set of four photographs in Figure 2 shows some of the automobiles that emerged from this period of experimentation and tinkering.
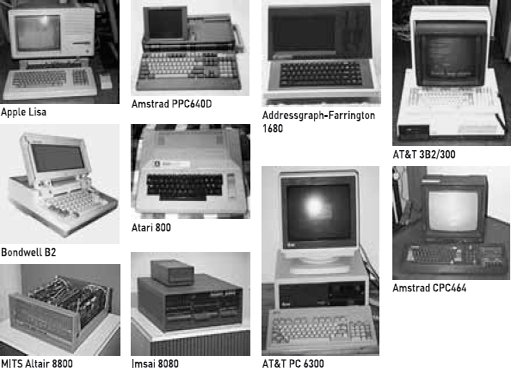
Before 1973, the computer industry was formed around the production of the mainframe computer, dominated by IBM since the 1960s, and the minicomputer, the embryonic form of today's PC, dominated by Digital Equipment Corporation (whose computer was called the PDP-8). The first mass-produced computer was introduced by Micro Instrumentation and Telemetry Systems in 1974 (the MITS Altair 8800). As in the automobile industry, in the early years (up to 1980) demand was concentrated among hobbyists. The new start-ups were very similar to the early ‘tinkerers’ in the automobile industry: production was often organised out of a structure that looked like a garage, and the producers were driven by creativity and a passion for the product. As in the automobile industry, entry occurred mainly through product innovation. Figure 3 illustrates the wide range of product designs in these early years.
The introductory period in the PC industry, in which real commercial growth began, occurred only after IBM introduced the IBM ‘PC’ in 1981, initiating the phase of IBM ‘compatibility’ (both hardware and software) which later allowed economies of scale to operate in the industry. Three further developments markedly increased the growth of the PC industry: (1) Intel's introduction of the 32-bit 386 processors in 1985, which allowed graphical interfaces and hence a more user-friendly environment; (2) the introduction of Windows 3.0 in 1990, which standardised the PC on the Windows operating systems, allowing ‘cloning’ of the IBM PC; and (3) the rise of the World Wide Web in the 1990s. All three developments contributed to a rapid increase in sales and, later, to a rapid fall in prices.
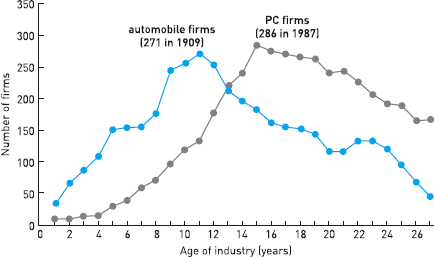
Hence, in both industries the early years were characterised by a great deal of turbulence: new firms entering the industry with new product innovations, and industry growth taking off. Figure 4 depicts this turbulence graphically as the rise and fall of firm numbers (i.e. how many firms exist in the industry in a given year) for the first 30 years or so of each industry. The vertical axis shows the number of firms; the horizontal axis shows the age of the industry for its first 27 years.
Question
Look at Figure 4. What was similar about the early years of the US automobile and PC industries?
Answer
The two industries experienced a remarkably similar pattern of growth: both industries went from infancy to just below 300 firms in only 10 to 15 years. The peaks of the curves in Figure 4 illustrate that there was a maximum of 271 automobile firms in 1909 and a maximum of 286 PC firms in 1987. After this point, the industries experienced a ‘shake-out’, that is, the elimination of a large number of firms, which in the case of the US automobile industry culminated in the survival of only three domestic firms.
What caused the great number of exits, or ‘shake-outs’, from the two industries? As predicted by life-cycle theory, most of the firms left the two industries at around the time the product became standardised, that is, when the great experimentation with different product types had ended and the industry had consolidated around a particular standard. In the automobile industry this occurred around 1910, soon after the Model T was introduced. In the PC industry it occurred around 1990, soon after the new Wintel platform emerged (the combination of the Windows operating system and the Intel processor), which set a new standard for the industry.
Once the product had become standardised, companies focused on increasing the efficiency of production through process innovations. For example, greater efficiency was achieved by introducing mass-production techniques, which allowed economies of scale. The term ‘economies of scale’ refers to the dynamic by which an increase in the quantity produced allows the firm to spread its costs over a larger output, which lowers the cost of producing each unit of output. Mass production also allows improvements in efficiency from ‘learning by doing’: the more that is produced, the more that is learned, from experience, about how to make production more efficient. As large firms, by definition, achieve a higher scale of production (‘scale’ is measured by level of output), small firms are forced out of the market in the phase in which scale matters the most.
4.4 Prices and industrial change
Many of the new entrants entered by introducing a new variation of the product. In fact, the early period in both industries was characterised by much technological change in the form of product innovation. Once a product standard emerged, product and process innovations around that standard led to a drastic fall in the product price in both industries. We will now look at some of the indicators of this turbulence in technology and prices.
How can we look at price changes over time in industries in which the product undergoes so many changes, especially in the early stages? Economists have devised a way to do just that, called ‘hedonic prices’. These are quality-adjusted prices, that is, prices that keep certain quality characteristics constant. In the case of automobiles over the last decade or so, the price might try to exclude changes such as the emergence of anti-lock brakes, the availability of engines with improved fuel consumption and reduced CO2 emissions, airbags, stronger safety shells, traction control and central locking. In the PC industry, the characteristics to be held constant might include available RAM, processor speed, screen size and weight.
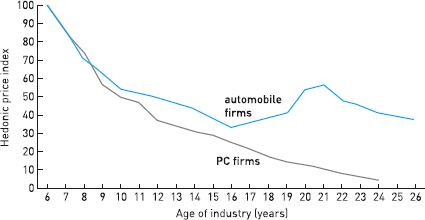
Figure 5 illustrates the evolution of quality-adjusted hedonic prices in both industries. You can see that in both industries prices fell drastically over the first three decades. Between 1906 and 1940, quality-adjusted prices in the automobile industry fell by 51 per cent (i.e. they halved), with most of the change occurring between 1906 and 1918 (Raff and Trajtenberg, 1997). (The quality-adjusted price calculation also removes the effect of inflation.) This fall in price reflects the radical changes in technology, the spread of mass production and the general expansion in the market for cars.
The prices of personal computers were also greatly affected by technological advances. Berndt and Rappaport (2000) found that PC quality-adjusted hedonic prices fell by an average of 18 per cent between 1983 and 1989, 32 per cent between 1989 and 1994, and 40 per cent between 1994 and 1999. Prices began to drop significantly after Intel's introduction of the 32-bit 386 processors in 1985 and the introduction of Windows 3.0 in 1990. The latter allowed the production of PCs to be standardised (via cloning of the IBM PC). The rise of the internet also increased sales and decreased prices. In recent years, quality-adjusted prices have fallen at an average annual rate of 24 per cent (Bureau of Economic Analysis, 2000).
Before we interpret what Figure 5 tells us about prices in the two industries, let me explain the meaning of the numbers on the vertical axis, which shows an index of (hedonic) prices. The concept of an index (plural indices) maybe familiar to you. In case it is not, here is an explanation. It is worth getting this clear, as indices are used a lot in economics. They are basically a simple way of measuring change. The most widely used method of constructing an index is based on the notion of the percentage, as discussed earlier in this chapter (Section 2.2).
Suppose that the price of a product is €5 in 2000, €7.50 in 2001 and €10 in 2002 (just to keep the arithmetic simple). We want to start our index in 2000. So the price in that year is set equal to 100 per cent.
So €5 is the index base =100
Then we compare all the other prices with the index base, using percentages. So to find the index for 2001, we divide the price in 2001 by the price in 2000, and multiply the result by 100 to give us a percentage.
| Year | Actual price of product € | Price index (base 2000) |
|---|---|---|
| 2000 | 5.00 | 100 |
| 2001 | 7.50 | 150 |
| 2002 | 10.00 | 200 |
€7.50 as an index (base 2000) is ![]()
For 2002, we do the same calculation, always comparing it with the base year (2000 in this example).
€10 as an index (base 2000) is ![]()
So Table 1 shows the price index for the three years.
Question 6
Look carefully at Figure 5. What does it tell you about prices in the first three decades of both industries?
(Focus on the slope of the curves, which indicates how prices are changing: a steep downward slope shows rapid price reductions.)
Discussion
Figure 5 clearly indicates that in both industries prices fell drastically during the first three decades. One difference, however, between the two industries is that prices fell for a longer time in the case of PCs. We will examine the reasons for this difference after we have looked at the patterns of innovation.
Exercise 4
Complete Table 2.
| Year | Actual price of product € | Price index (base 2003) |
|---|---|---|
| 2003 | 12.00 | 100 |
| 2004 | 16.00 | |
| 2005 | 19.00 | |
| 2006 | 21.00 |
Answer
| Year | Actual price of product € | Price index (base 2003) |
|---|---|---|
| 2003 | 12.00 | 100 |
| 2004 | 16.00 | 133 |
| 2005 | 19.00 | 158 |
| 2006 | 21.00 | 175 |
4.5 Technological change
In both industries the fall in prices was driven by radical changes in the production of the products. How might we investigate the technological changes and the changes in quality that occurred in both industries simultaneously with the drastic fall in prices? There are various methods used by economists to measure technological change. Some methods focus on the ‘inputs’ into the innovation process, such as the spending on research and development by firms. But this is not ideal as it does not indicate whether the spending was successful, that is, it does not look at the output of the process, just at the intention. Some methods look at innovative output in terms of the numbers of patents issued by the firms. But this is not ideal either as it does not discriminate between patents which barely affect production and patents which cause major change to the industry. We will use two alternative methods here. One takes into account a list of innovations produced in the automobile industry, where each innovation is given a score according to its effect on the production process of automobiles. The other measures quality change and is derived from the quality-adjusted measure of prices explained above.
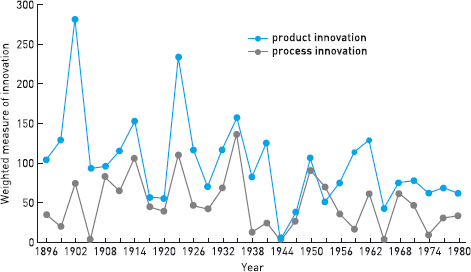
For the automobile industry, Abernathy et al. (1983) compiled a list of all the product and process innovations from 1893 to 1987 and gave each innovation a score on a scale from 1 to 7. This scale is similar to that used by market researchers who enquire how much you like a product on a scale from 1 to 5. The score is called a ‘weight’. A weight of 1 means that the innovation affected the automobile very little (e.g. a new type of colour spray), while a weight of 7 means that it affected it a lot (e.g. the introduction of the assembly line or a new type of engine). The number of innovations per year and their weight produced a score for the year, which indicated the degree to which technological change had occurred. Product and process innovations were listed separately. Figure 6 illustrates this data by plotting the weighted measure of innovation in three-year intervals. The fact that both lines fall over time on average indicates that most product and process innovations occurred in the early years, when the industry experienced a high rate of new firm entry.
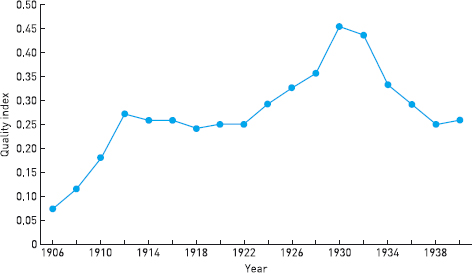
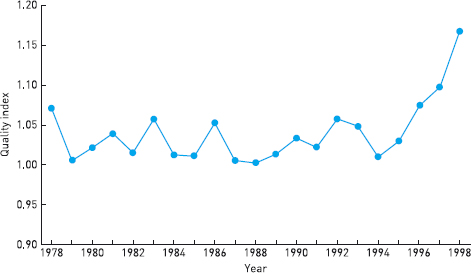
Although we do not have the same data for the PC industry, our second measure of innovation can be applied to both industries. This second measure looks at the degree to which the quality of the product has changed over time, a good proxy for innovation as innovation changes the quality of products and processes. To derive this measure of quality change, you start from the index of actual prices of a car or a PC. This is, in essence, the average price of each product sold in stores, turned into a price index as explained above. That is divided by the quality-adjusted hedonic price you have already studied. The first index shows the prices for goods of changing quality; the second, prices for goods of unchanged quality. Dividing the first by the second gives you a quality index: it will be high if there is a lot of quality improvement and low if there is little quality improvement.
Question 7
Look carefully at Figures 7 and 8. How do quality changes compare at similar stages in the two industries’ life cycles?
Answer
As in Figure 5, it is the slope of the lines that is important: how the quality index changes over time. A steep upward slope indicates a period of great increase in quality.
One difference between the two industries that you can see if you compare Figures 7 and 8 is that, whereas in the automobile industry the degree of quality change was greatest in the very early years (1906–12), in the PC industry it was greater during the third decade of its existence. This difference is due to the fact that the PC industry emerged from the existing mainframe and minicomputer industry, in which firms such as IBM and DEC controlled the industry and hence had little competitive stimulus to innovate. The reason is that a firm's goal when innovating is to out-perform its competitors; so if it is not being challenged by those competitors, it has less incentive to innovate. Radical innovation was not unleashed in the industry until those firms that had a technical lead lost their control of the innovation process. Innovation up until 1990 was to a large extent controlled by IBM, as everything had to be IBM compatible. Only once the Wintel standard (the combination of the Windows operating system and the Intel processor) replaced the IBM standard, did the industry experience the kind of turbulence experienced in the very early years of the automobile industry. Therefore, although there was a lot of entry into the PC industry during its first fifteen years (as seen in Figure 4), it took longer than that for the new firms to eliminate the lead of the giants that preceded them. Below we shall see the implications of this for the industry structure.
Furthermore, Bresnahan (1998) holds that the reason that technological change in the PC industry lasted into the third decade of its existence, instead of dying off as often happens during the growth stage of the industry life cycle (as in automobiles), is that technological leadership in this industry is not dominated by one firm or a set of firms but divided among firms in different parts of the computer industry. These firms are the makers of PCs themselves (e.g. IBM, Dell, Compaq); the makers of the microprocessors (e.g. Intel); the makers of the operating systems (e.g. Microsoft); and the makers of application software (e.g. Lotus, WordPerfect, Ashton-Tate). This divided technical leadership has ensured rapid advances from specialists and a very competitive market, as PC firms are forced to compete not only with other firms that produce PCs but also with firms that produce parts or complementary products that work with another firms’ products.
4.6 Changes in industry structure
How did the turbulence caused by new firms entering and leaving the industry, radical technological change and falling prices affect the overall industry structure? The term ‘industry structure’ refers mainly to the way in which power is distributed among firms. This can be described by factors such as the number of firms in the industry and the distribution of market shares (the market share of a firm is its share of total industry production expressed as a percentage).
An industry that has one firm with 50 per cent of the market and 50 other firms with only 1 per cent of the market (market shares must total 100 per cent) has a very different industry structure from an industry in which 10 firms each have 10 per cent of the market. An industry is described as ‘concentrated’ when a few firms have large market shares. Economists are interested in industry structure because it has implications for consumers. One of the issues is the extent to which the existence of very large firms in the industry will prevent a competitive environment, for example whether they inhibit other firms from entering the industry and discourage innovation. This issue was at the heart of the Microsoft trial, in which a very large software firm, with almost complete domination of the market, was accused of hindering competition in the industry.
In both industries, the periods of greatest technological advance were also the periods in which market shares were the most unstable and industry concentration at its lowest. Market share dynamics are important because unstable market shares mean that the status quo in the industry is being disrupted: the leaders’ lead is being challenged. When market shares are stable the existing leaders are not challenged by outsiders. Incremental technological change tends to be less disruptive to the leaders’ position than radical technological change, which is often carried out by outsiders. In fact, some have argued that competition should be measured, not by the level of ‘concentration’ (i.e. whether market share gives some firms too much power), but by the level of market share instability. As long as there is some instability the existing leaders cannot relax and are thus forced to compete.
Case study: Cars – from technological change to marketing and back?
In the automobile industry, market share instability was especially strong during the period from 1910 to 1925, which witnessed not only high entry/exit rates but also some of the most radical innovations in the industry. Market share instability then decreased as entry fell and innovation became less important. The strong economies of scale that developed in the 1920s, when most of the industry (not only Ford) began to use mass-production techniques, alongside the fall in prices, caused the industry to become increasingly concentrated. The ‘Big Three’ US automobile producers (Ford, GM and Chrysler) have dominated the US industry for most of the post-Second World War period. Concentration stopped increasing in the 1970s when the entry of foreign firms into the US market created a more competitive market. Foreign firms especially profited from the opportunity to satisfy the high demand for small cars during the oil crisis of the 1970s, an area in which they had more experience. Since the 1970s, competition has been carried out principally via advertising wars and price wars. As the twenty-first century opens, however, the automobile industry stands on the brink of a new round of technological innovation, as hydrogen looks set to replace petroleum as the standard fuel.
Question 8
Do you think there are any economic factors under-lying the varying importance of technological change over time? Is this pattern of structural change over time likely to be replicated in other industries (e.g. the PC industry)?
Answer
In the PC industry, market shares were the most stable and industry concentration the highest in the early years when IBM dominated the industry. During the late 1980s and early 1990s, the end of the IBM-compatibility era (with the rise of Wintel) and the emergence of the World Wide Web caused some disruption to the status quo, which resulted in unstable market shares and a fall in concentration. Concentration later rose again in the 2–3 year period up to the time of writing in 2001, because companies such as Dell were focusing less on innovation and more on simple measures to cut costs and hence prices so as to increase market share.
Dell computers is vowing to remain on the offensive in an ongoing PC price war, sacrificing profits in a bid to gain market shares – a strategy that the company's founder admitted could ultimately kill off a competitor.
(Popovich, 2001)
A price war is hitting PC makers hard. Many well-known names could disappear from the high street… But not all the problems are due to the downturn in the economy or the bursting of the internet bubble. Much of the suffering has been caused by Dell computer which started a price war to gain market share.
(Schofield, 2001, p. 1)
For the present let us simply note that this recent trend has, in fact, been seen by many industry analysts as a threat to the industry. Unless the PC industry goes back to the era of competing via innovation (as in the early 1990s) it is bound to end up as a traditional, stagnant industry run by a few firms that are more interested in protecting their market shares (through price reductions and advertising wars) than in the future technological growth of the industry.
4.7 The future?
In the USA, the automobile reached the 50 per cent household penetration rate in 1923, about 23 years into the industry's development. The PC reached that threshold rate in 1999, also about 23 years into its development. Given the discussion in Section 3, this suggests that the economy-wide effects of the PC have yet to be fully seen. And given the arguments in this section, it also suggests that the PC is now starting to reach the end of its growth phase. In fact, in 2001 PC sales fell for the first time. As a report in the Financial Times noted: ‘Shipments of personal computers have suffered their first quarterly fall in at least 15 years’ (Kehoe, 2001).
Given the similarities in the early development of the two industries, it is likely that some of the patterns that have characterised the mature phase of the automobile industry will also characterise the future of the PC industry, which is only now entering its mature phase. Using this logic we might expect the PC industry to be characterised by higher levels of concentration (already happening with the recently proposed merger between HP and Compaq, and with the price war led by Dell), more market share stability between the incumbents, and more focus on process innovation and advertising than on product innovation.
However, if future competition is carried out more through product innovation than through price wars and economies of scale (as it is currently), then this drift into stagnation may not occur. Instead, if innovations allow new firms to come forward and displace the old leaders, the characteristics of the early phase may reappear and the life cycle will start up again. We may witness new entries and exits and renewed market share instability. The future market structure of the PC industry will also be influenced by the nature of innovation in another sense: whether new innovations will continue to allow the technical leadership to be divided among firms, a situation which in the past has allowed new entry to occur and smaller firms to survive.
5 Conclusion
This chapter has enabled you to think about the essential role of technological change in determining economy-wide growth and the growth of firms and industries. We have seen that many issues surrounding the new economy are really issues around the dynamics of technological change: rapid increases in productivity, the emergence of many small firms, new products and new processes, and so on. The main lesson of the course has been to provide a historical perspective to the introduction of new technologies. Without such a historical perspective, patterns may falsely appear to be new: we have just forgotten!
Questions for review and discussion
Question 9
Suppose a firm uses 200 hours of labour per day and produces 4000 mobile phones. It then reduces its labour inputs to 100 hours per day and finds it can produce 3000 phones. Which one of the following is a correct statement about the change in the firm's productivity?
| A | ✓ | The firm now produces 25% fewer phones, so its productivity has fallen by 25%. |
| B | ✓ | The firm has cut its labour hours by 100 but its output has fallen by 1000, so its productivity has fallen. |
| C | ✓ | The firm employs 50% of the labour hours it employed before and produces 75% of its previous output, so its productivity has risen by 25%. |
| D | ✓ | The firm has increased its output per labour hour from 20 units to 30 units, so its productivity has risen by 50%. |
Answer
D
Question 10
Some of the following features of industrial revolutions belong to a microeconomic perspective (as opposed to a macroeconomic perspective). Select the ones you think belong (there is more than one correct statement).
| A | ✓ | There will be a rise in the level of productivity across the economy. |
| B | ✓ | There is rapid entry into and exit from a new industry in its growth phase. |
| C | ✓ | You will see cumulative technological change resulting from the birth of new general purpose technologies. |
| D | ✓ | There is an increase in the level of income per head. |
| E | ✓ | There will be a sustained fall in the price of a new product once a product standard has emerged. |
Answer
B and E
Question 11
Which one of the following characteristics is most typical of an industry in its growth phase?
| A | ✓ | There will be rapid entry of new firms, each producing a different version of the product. |
| B | ✓ | There will be firms of many kinds producing in a pre-commercial way. |
| C | ✓ | The emergence of a standardised product will be followed by the exit of firms unable to produce it efficiently. |
Answer
C
Question 12
The table below is designed to give information about the price of a product in two years, 2000 and 2005. What are the correct values to put into the spaces in the table.
| Year | Actual price of product (£ per unit) | Price index (base year 2000) |
|---|---|---|
| 2000 | ||
| 2005 | £30 | 75 |
Answer
£40 and 100
Question 13
Explain briefly using examples:
how productivity may increase with the introduction of new technology;
how the characteristics of a general purpose technology help us to understand industrial revolutions;
how technological progress may increase economic growth.
References
Acknowledgements
The material below is contained in chapter 2 of Economics and Economic Change Microeconomics (2006) (eds) Graham Dawson, Maureen Mackintosh and Paul Anand which is published by Pearson Education Limited in association with The Open University. Copyright © The Open University
The material acknowledged below is Proprietary, used under licence and not subject to Creative Commons Licence (see terms and conditions). This content is made available under a Creative Commons Attribution-NonCommercial-ShareAlike 4.0 Licence
Grateful acknowledgement is made to the following source:
Course image: mbiebusch in Flickr made available under Creative Commons Attribution-NonCommercial-ShareAlike 2.0 Licence.
Figure 1: Copyright © 1997 Wasserman, Boston Globe, LA Times Syndicate
Don't miss out:
If reading this text has inspired you to learn more, you may be interested in joining the millions of people who discover our free learning resources and qualifications by visiting The Open University - www.open.edu/ openlearn/ free-courses