5.9 Why photovoltaics?
Electricity is the most versatile form of energy available to us, and is intimately integrated into our society. It can be generated from many sources, can readily be transported, and can be used for almost any application. For example, high quality lighting, motors for machines and appliances, communications and entertainment equipment are all readily fuelled by electricity. It is also used for heating and cooking and even for transport.
Renewable energy systems that generate electricity directly are particularly appropriate for integration into our existing infrastructure. These systems include hydro-, tidal-, wave- and wind-power and PV. Hydro, tidal and wave are necessarily large systems that are also very dependent on location. Wind farms produce electricity directly and can be sited close to points of use but their sheer size means they are not suitable for the urban environment. You can see the odd small turbine here and there in towns and cities, but these cannot supply anywhere near enough power to make a serious impact. Furthermore, the efficiency of wind turbines increases with size because wind speed increases with height. By their very nature wind turbines have to be obtrusive.
PV technology stands out as the only renewable option that:
- generates electricity directly
- is practical for small and large scale
- is suitable for the urban environment and remote applications alike
- is silent and is a very low-maintenance ('fit and forget') technology.
It also has a low 'embodied energy', meaning the amount of energy invested in making PV modules is relatively small. It is generally recognised that PV is the most versatile of the renewable energy technologies and the most likely to be integrated on the small to medium scale (see Where the Sun shines brightly).
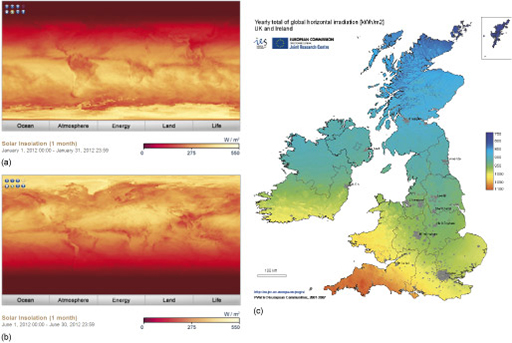
Where the Sun shines brightly
Figure 97 shows the global and UK distribution of solar energy as a resource. The global map shows the insolation (solar power per square metre on a surface facing the Sun) worldwide for the months of January and June. The UK map shows the distribution of its annual total solar energy input onto horizontal surfaces.
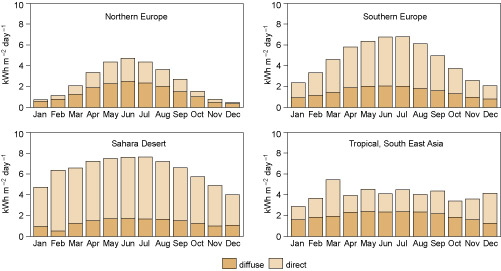
Solar energy is highly seasonal and variable. Figure 98 gives an idea of its variation through the year in four locations. These are averages over a month and take into account typical weather.
The amount of sunlight reaching a given location on average in a given month can be predicted from past records with a fair degree of accuracy. This sunlight includes direct sunshine and the diffuse daylight that occurs on overcast days. Although not transmitting as much energy, this latter component can add a significant fraction to the overall energy levels, particularly in a temperate climate such as that in the UK. Another factor is that at relatively high latitudes, such as the UK, the length of the days in summer means that the total amount of energy compares quite well with those countries where the Sun is higher in the sky. Of course this advantage is reversed in the winter.