
3.3.2 The surface salinity
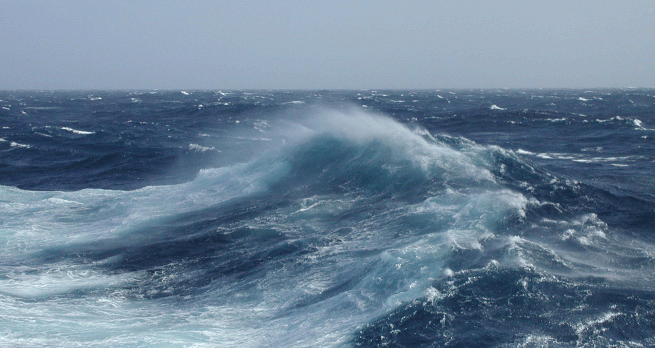
Sea-surface salinity is determined by two competing processes: precipitation and evaporation. Precipitation (P) (including rain and river flow) reduces the salinity of the sea surface while evaporation (E) increases surface salinity by the removal of water. The (E-P) balance is shown in Figure 10 along with the resulting approximate global surface salinity distribution.
A negative E-P value freshens the sea surface, and the shape of the purple line in Figure 10a is interesting. The 'M' shape between 60° S and 60° N shows positive peaks at ~25° S and 20° N due to decreased rainfall and high evaporation, while the trough is due to high rainfall and river inputs.
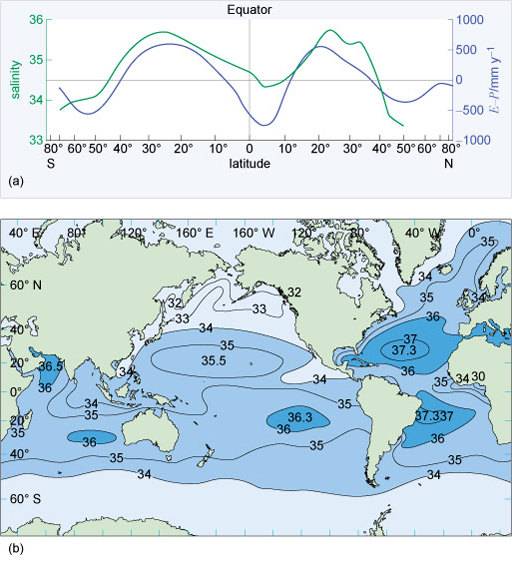
Figure 10b shows a striking difference between the Atlantic and the Pacific Oceans: the salinity in the Atlantic is much higher. In the Pacific Ocean, lines of equal salinity, called isohalines, tend to follow lines of latitude, but not in the Atlantic because of the ocean's circulation. Another example can be seen off the coast of Portugal where less saline waters extend southwards. Like the SST, the surface salinity is being redistributed.