
3.5 The water properties along the Atlantic Ocean
So far, you have looked at single profiles in one location. Figure 13 shows a line of CTD measurements called a hydrographic section. It shows the temperature and salinity distribution along the length of the Atlantic Ocean.
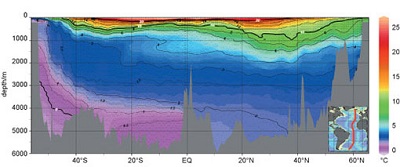
Figure 13 includes data from >120 CTDs and is created by plotting the latitude of each CTD station as the x-axis (which is over 11 000 km long), the y-axis as the depth measurements and colours representing equal temperatures and salinities measured at the CTD stations.
In Figure 13 the black lines of equal temperature - called isotherms - are superimposed on the colours and 0 °C, 10 °C and 20 °C are bold lines with white numbers. The spiky grey shaded region at the bottom of the plot is the sea floor along the section similar to that shown in Figure 3. The red line on the inset map shows the location of the section.
In the upper 1000 m the range of temperatures is very large (from blue to bright red) and the temperature can change as much as 20 °C. The isotherms are a squashed 'W' shape and are generally shallow at high latitudes above 40° N and 40° S, at their deepest points at about 30° N and 30° S, and shallow again at the Equator. Below 1000 m to the sea floor the temperature change is relatively small (4-5 °C). The isotherms at these depths have a 'U' shape across the Atlantic Ocean, rising towards the poles and deepest around the Equator. The mauve region in the south which contains the 0 °C water is close to the surface at 50° S. This is very cold water from the Antarctic that is descending and spreading throughout the deep ocean to be stopped by the seamounts of the Mid-Atlantic Ridge.
-
Is there ice in the deep ocean close to Antarctica?
-
No, there is no ice at this depth. Just as in fresh water, the ice would float because of the molecular structure of H2O. The salt in the seawater has lowered the freezing point of the water below 0 °C.
-
Based on what you have already learned, think of reasons why very cold water formed in the Arctic does not spread out through the deep ocean.
-
When exploring with Google Earth you found that the gateways from the Arctic to the rest of the global ocean are relatively shallow. The densest cold Arctic water is not able to enter the rest of the global ocean.
Finally, Figure 13 shows that at the Equator the temperature between the surface and the sea floor varies over a wide range - almost 30 °C. In higher latitudes the temperature range between the surface and the sea floor is very much reduced, for example at 52° S the range is only ~3.5 °C. Solar radiation is mostly responsible for heating the surface of the ocean, and the lack of solar radiation in the high-latitude regions is responsible for cooling the surface. Waters of different temperature are then spread throughout the oceans because colder water is denser and sinks beneath the warmer waters.
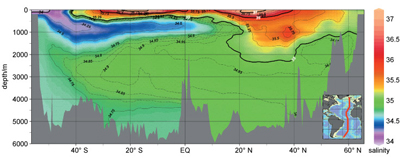
The salinity distribution in Figure 14 is more complicated. It is almost as though a clockwise circulation is wrapping the colours up. The very low-salinity, mauve-coloured water at the surface at about 50° S sinks and extends north at ~900 m depth. This implies that the low-salinity water at about 800 m depth in the salinity profile in Figure 7 originates in the Antarctic. North of this blue 'tongue' of water, there is an orange-yellow patch of water between 20 and 40° N of salinity ~35.5. Lastly, note that in the South Atlantic water below 4000 m must be the most dense - denser than the fresher water from the north.
In Section 4 you will see that both Figures 13 and 14 show features which are a result of the circulation of the ocean.