Use 'Print preview' to check the number of pages and printer settings.
Print functionality varies between browsers.
Printable page generated Thursday, 25 April 2024, 8:49 PM
Reducing the carbon footprint of the place where I work
Introduction
This introduction considers how human activity has changed the natural process known as the greenhouse gas effect resulting in global warming and climate change. The unit explores these key questions:
What is climate change and why is it a big deal?
What are the main anthropogenic causes of recent climate change?
What is the evidence that the climate is changing?
What will more global warming mean later this century?
What are some of the common myths about climate change?
Why are some scientists sceptical about climate change?
What can I conclude from this evidence?
Learning outcomes
By the end of this unit you should be able to:
build a basic understanding of the causes of climate change and the role of anthropogenic processes and activities, over time;
understand what is happening to the climate today;
build your confidence and competence in understanding and using climate change language;
develop critical curiosity in exploring the controversies about the human causes of climate change;
develop systemic learning of the wider, systemic picture in which climate change is happening.
1 What is climate change and why is it a big deal?
1.1 What is climate?
A remark usually attributed to Mark Twain sums this up well: ‘Climate is what we expect, weather is what we get.’
Weather varies a lot, from one day to the next. I used to live up in Orkney, where people say that if you don't like the weather, just wait five minutes and it'll change. It's true. You'll often get four seasons in one day.
Climate is the average weather over a longer time (typically 30 years) and a larger scale. We know that in the UK the climate varies (colder and wetter in the north and west; warmer and drier in the south and east) and the Mediterranean climate is a major factor in its appeal as a holiday destination. You may also have heard about equatorial, polar, maritime and continental climates. The bigger the scale and the longer the time period the more confident we can be about the ‘climate’ (because we average out the ‘noise’ or local variation of ‘weather’).
These web-based resources provide additional information
A rather fine Web-based animation from Oxford University explains this in a few minutes.
RealClimate hosts a briefing and discussion on the differences between weather and climate.
1.2 What is the climate system?
Our climate is one of the largest (if not the largest) complex open systems that we have.
There are five main components for the current climate:
atmosphere (the envelope of gases surrounding the Earth), e.g. increasing carbon dioxide (CO2) concentration and radiative forcing
hydrosphere (oceans, seas, rivers, freshwater, underground water), e.g. changes in the ocean carbon-sink and changes in evaporation
cryosphere (snow, sea-ice, ice-sheets, glaciers and permafrost), e.g. changes in the Earth's reflectivity (albedo) and melting ice caps
land surface, e.g. desertification and deforestation
biosphere (all ecosystems and living organisms), e.g. combustion of fossil fuels and CO2 fertilisation.
These all interact with each other. For any study of climate change over long timescales we would need to add the lithosphere (the crust and upper mantle involved in plate tectonics), which controls the geological part of the carbon cycle, volcanic activity, the distribution of the continents and oceans and major topographic features such as mountains and high plateaux (and hence major oceanic and atmospheric circulation).
We can identify two main influences on the climate:
internal changes in the interactions between different components of the climate system (the composition of the atmosphere, oceans, etc.) – human activity can exert a profound influence here
external changes, such as fluctuations in solar radiation and volcanic activity over which humans have no influence.
1.3 What are positive and negative feedbacks?
In a system, things interact. Sometimes they interact to reinforce a given effect – a positive feedback; sometimes they interact to dampen an effect, holding the system in check – a negative feedback. A couple of examples are given below.
One example of a positive feedback in the current climate system is that increasing CO2 from human activities warms the atmosphere. After some time the surface ocean temperatures begin to rise (this takes a long time because it takes a lot more energy to heat a given amount of water than it does for the same amount of land or air). The combined effect of warming atmosphere and warming surface ocean waters leads to melting of polar ice. When the ice melts it exposes either land or sea. Ice is much more reflective than either land or sea, so reducing the extent of ice means that more of the Sun's radiation is absorbed by the Earth. This leads to more warming, so more melting of ice, less reflectivity and more absorption of solar radiation, more warming and so on.
A warmer atmosphere warms the surface ocean waters. Oceans are an important ‘sink’ for CO2 (they remove CO2 from the atmosphere), but this effect weakens as ocean temperature increases. So, a warming ocean removes less CO2 from the atmosphere, increasing the amount of CO2 in the atmosphere, further warming the surface ocean waters, and so on.
One important point about positive feedback loops is that it really doesn't matter where you enter the cycle (which comes first), it's still a positive feedback. For example, it doesn't matter whether an increase in temperature warms the atmosphere, which weakens the ocean sink effect, which leads to an accumulation of CO2 in the atmosphere leading to further warming, etc.; or whether an accumulation of CO2 in the atmosphere leads to a warmer atmosphere, which leads to a weakening of the ocean sink effect, etc. For more on this, see Section 9 ‘Why are some scientists sceptical about climate change?’
Increasing cloud cover is an example of a negative feedback. A warmer atmosphere holds more water vapour. If this condenses to form clouds, then (depending on the type of cloud, its altitude and other factors) more cloud means higher reflectivity, so less absorption of incoming solar radiation, so a cooling effect.
These web-based resources provide additional information
An explanation of feedbacks can be found at the Encyclopedia of the Atmospheric Environment.
RealClimate hosts an in-depth discussion of internal feedback effects, especially water and clouds.
1.4 What are the main causes of climate change?
There are four main causes that determine climate. These are:
| Cause | Some forcing factors | Timescale (typical) | Spatial scale |
|---|---|---|---|
| • The amount of solar radiation coming into Earth (mainly in equatorial latitudes) | Solar intensity and | Years to 100s of years to millions of years; | Global |
| interactions in the Earth's orbital cycles | 10 000s to 100 000s of years | ||
| • Albedo – the amount of solar radiation reflected back out to space | The extent of ice cover (mainly polar ice caps); | Seasonal to centuries | Regional |
| cloud cover; | Days | Regional | |
| atmospheric particles; | Years | Regional/global | |
| and vegetation cover | Years | Regional | |
| • The distribution of incoming solar radiation to the poles (via oceanic and atmospheric circulation) | Interactions in the Earth's orbital cycles; | 10 000s years | Global |
| and the distribution of the continents (including connections between the oceans) and major topographic features such as high plateaux like Tibet; | 10s to 100s millions of years | Regional to global | |
| variations in oceanic and atmospheric circulation patterns (e.g. El Niño southern oscillation) | Decadal | Regional to global | |
| • The composition of the atmosphere (the concentration of ‘greenhouse gases’) | The carbon cycle – there are three main parts: | ||
| The terrestrial cycle (moves carbon through the atmosphere, plants, animals and soil) | Days to 10s to 100s of years | Local to regional to global | |
| The marine carbon cycle (moves carbon through the oceans) | 10s of years to 1000s of years | Regional to global | |
| The geological carbon cycle (moves carbon through certain rocks – mainly limestones and organic rocks (including fossil fuels – coal, oil and gas)) | 10s to 100s of millions of years | Regional to global |
All of the factors act all of the time. Because they influence climate, they are often referred to as forcing factors. The extent to which any one of them is apparent as a major driver of climate change depends on the scale at which you look at climate change. In general, a given rate and scale of climate change will tend to be driven by a forcing factor, or combination of factors, acting on the same space and timescale. For example, El Niño events and a variety of local land management factors are likely to be important factors in decadal climate change; global change over tens of thousands or hundreds of thousands of years is dominated by orbital forcing factors; and, for global change over tens or hundreds of millions of years, then factors like the distribution of continents is an important consideration.
The carbon cycle is the main factor in considering the concentration of greenhouse gases in the atmosphere. The terrestrial cycle dominates climate change over decades or hundreds of years; the marine cycle up to thousands of years and the geological carbon cycle for changes in atmospheric composition and, hence, climate over tens or hundreds of millions of years.
If only natural factors were acting and we were interested in the role that coal, oil and gas might play in climate change, then the geological carbon cycle is the relevant factor and we would expect them to influence climate over tens or hundreds of millions of years.
But natural factors are not the only ones at play. Humans are.
1.5 Web-based resources on climate
The Essentials of Geology website has a quick Flash animation illustrating the three main cycles in the Earth's orbit around the Sun.
The Department of Geography at the University of Oregon has a selection of global climate animations.
A brief account of the role of orbital forcing factors in climate change can be found at the NOAA Paleoclimatology Program.
The Encyclopedia of Earth describes three of the main orbital cycles and their interactions.
2. Why is there so much concern about current climate change?
2.1 The enhanced greenhouse effect
Our climate is always changing: it always has and it always will. As discussed for the previous question, these changes result from interactions between a number of astronomic, atmospheric, oceanographic, biological, geological and social factors. They contribute to a natural greenhouse effect.
Current concern centres on the rate of change in the concentration of greenhouse gases in the atmosphere – the enhanced greenhouse effect. This is due to human activity – especially our use of coal, gas and oil (fossil fuels) and deforestation. These activities amount to a shortcircuiting of the terrestrial and, especially, the geological parts of the carbon cycle.
When we burn fossil fuels (coal, oil, gas) we take carbon out of the geological reservoir and emit it into the atmosphere. This dramatically reduces the time normally taken for that carbon to re-enter the atmosphere (from tens of millions of years to a few years). Similarly, deforestation accelerates the rate of transfer of carbon from plants back into the atmosphere.
Furthermore, the geological organic carbon reservoir (including fossil fuels) is very large – more than 10 000 times larger than the atmospheric reservoir. The effect of taking even relatively small amounts of carbon from the geological organic carbon reservoir and transferring it to the atmospheric carbon reservoir is very marked. Imagine you have two (very big!) bags, one containing 10 000 000 marbles, and the other with 1000. If you take 1000 marbles from the larger bag it reduces in size by 0.01% (a hundredth of 1%). If you add those marbles to the smaller bag it doubles in size (increases by 100%). So you have made a negligible difference to the size of the bigger bag, but a major difference to the smaller bag.
Once in the atmosphere carbon stays there for typically 100 years before being taken up by either the terrestrial or marine part of the carbon cycle. While in the atmosphere the carbon combines with oxygen to form CO2 – a greenhouse gas.
2.2 Terrestrial and marine carbon cycles
There are many routes by which an atom of carbon in the atmosphere can enter the terrestrial or marine carbon cycle. For example, it might get taken up in an organism that lives for a few hours, or a tree that lives for hundreds of years. So it's difficult to say exactly how long carbon stays in the atmosphere (i.e. its residence time) – the accepted range is 0–200 years, with 100 years taken as the typical residence time.
Play the carbon cycle game from the University Corporation for Atmospheric Research (UCAR) to see some of the possibilities.
A useful animation from the US Environmental Protection Agency illustrates key components of the carbon cycle and how human activity affects it.
2.3 What is the greenhouse gas effect?
Understanding the greenhouse gas effect is central to the human causes of global warming. The Earth receives energy from two main sources: the Sun and the atmosphere.
Energy from the sun in the form of radiation passes through the Earth's atmosphere and heats the surface of the Earth. Some of this radiation is absorbed and re-emitted back through the atmosphere. This radiation has a longer wavelength than incoming radiation. At this longer wavelength it is absorbed by certain gases in the atmosphere and re-emitted in all directions, some of it back to Earth. This warms the atmosphere. This is the greenhouse effect.
The gases involved are called greenhouse gases. Together they form a tiny fraction of total atmospheric gases – so small that we talk about their concentration as ‘parts per million’ (ppm – 10 000 ppm is 10 000/1 000 000 or 1%). The current concentration of all greenhouse gases in the atmosphere is about 470 ppm. That's much less than 1%, but they play an important role in the Earth's climate.
If there were no greenhouse gases in the atmosphere, then global average temperature would be about −18°C, but with them the average global temperature is about +15°C.
So, greenhouse gases may only comprise a small part of the atmosphere, but they have a very potent effect. Small changes have a big effect on global temperature and climate.
A short animation from the BBC's Weather Centre explains the greenhouse effect in a few minutes.
The answer to the question ‘What is the greenhouse effect?’ can be found at the IPCC's website.
2.4 What are the main greenhouse gases?
We've already mentioned that CO2 is a greenhouse gas. There are several others; some are natural and some are man-made. All of them have different global warming potentials, and these are expressed in comparison with CO2. So, for example, a given amount of methane has 21 times the global warming potential of the same amount of CO2. The most important greenhouse gases (as a result of a combination of volume and global warming potential) are CO2, methane and nitrous oxide. There are several other greenhouse gases, some with very high global warming potentials – but they are present in very small amounts. Over two-thirds of the enhanced greenhouse effect is attributed to CO2.
The role of water in the atmosphere is complicated. As water vapour it acts as a greenhouse gas (so has a warming effect) but as certain cloud types it increases the Earth's albedo so has a cooling effect. The amount of water in the atmosphere depends on temperature: a warmer atmosphere holds more water. This leads to a positive feedback: increasing CO2 enhances the greenhouse effect, resulting in a warmer atmosphere which is able to hold more water vapour, which further enhances the greenhouse effect. Although there is a lot of water vapour in the atmosphere overall, this varies in different parts of the globe (more in the tropics, less in the desert latitudes and poles) it tends to be removed within a few days (e.g. precipitation, uptake by vegetation). So, for the enhanced greenhouse effect, water vapour is not as important as CO2 and other greenhouse gases.
These web-based resources provide additional information
The New Scientist compares the relative importance of water and CO2 and the enhanced greenhouse effect.
The Carbon Dioxide Information Analysis Center gives details and concentrations of all greenhouse gases.
RealClimate discusses the role of water vapour in global warming.
RealClimate also looks at ‘The CO2 problem in 6 easy steps’.
2.5 What is happening to global temperatures?
Over the last 100 years the global temperatures have risen by over 0.74°C. The most significant rise has taken place since the 1970s and the 10 warmest years on record have occurred since 1997. Global temperatures for 2000–2008 are almost 0.2°C warmer than the average for the decade 1990–1999.
The rate of increase has not been constant. The increase in temperature stabilised and even began to fall slightly from 1945 to 1970. This prompted concerns about the possibility of the Earth entering another ice age. This halt in the rising trend is explained by two main factors. First, and mainly, an increase in sulfate aerosols from post-War increase in economic activity and a dramatic increase in the amount of coal used (before any clean air acts were passed), and volcanic activity. Sulfate aerosols have a cooling effect, but are rained out within a decade or so. Thus, the main effect was short-term cooling, partially masking the longer term enhancing of the greenhouse effect. Second, changes in the way that sea surface temperatures were collected during the 1940s account for some of the observed temperature changes.
See the IPCC FAQ ‘How are temperatures on Earth changing?’.
See the briefing in the New Scientist on the drop in temperature between 1940 and 1970.
The Fourth Assessment Report from the IPCC details historical and projected temperature change; see its ‘Synthesis report – summary for policymakers’.
2.6 Does increasing atmospheric CO2 have any other effects?
Yes. The most important direct effect is exchange of atmospheric CO2 with the surface ocean waters, leading to an increase in CO2 in the oceans. The oceans have taken up 27–34% of CO2 emitted by human activity over the last 150 years. This ‘buffering’ capacity has effectively weakened the enhanced greenhouse effect. However, the continued uptake of CO2 by the oceans will lead to a slowdown in its capacity to absorb more CO2, meaning that in future more CO2 will remain in the atmosphere. In addition, there is growing concern about the possible impacts of increasing ocean CO2 on marine ecosystems. Increasing CO2 in the oceans raises the pH of the oceans – popularly referred to as ocean acidification. Increasing ocean pH impedes the ability of organisms to grow their external shells. This raises concerns about destabilising oceanic ecosystems where tiny shelly organisms (cocolithophores, a type of phytoplankton) form the base of the marine food web.
It is important to bear this in mind in evaluating geoengineering solutions to climate change. Putting to one side the proposed scale of interventions with various ecosystems (and potential problems arising as a result of that), many of these proposals aim to deal with the impacts of the enhanced greenhouse effect on global mean surface temperature (e.g. mirrors in space), but fail to address changes in the chemical composition of the oceans. See also ‘What about geoengineering? Won't that help us to control the climate?’ in Section 5.15.
These web-based resources provide additional information
A short note on CO2 and ocean acidification, with a link to a pdf file for a full briefing, can be found at the UK Marine Climate Change Impacts Programme.
RealClimate has a briefing and discussion on ocean acidification.
The Royal Society of London has an article on ocean acidification.
RealClimate has a collection of briefings and discussions on geoengineering.
2.7 What do all of these different measures and units mean?
2.7.1 Measuring greenhouse gases
Carbon of CO2? It is increasingly common to refer to CO2 rather than carbon. Look out for this, because one molecule of carbon is equivalent to 3.67 molecules of CO2; and one molecule of CO2 is equivalent to 0.27 molecules of carbon. Or if you were to place monetary value on CO2, for example, then £100/t of carbon would be equivalent to £27/t of CO2. It might be easier to persuade people to pay £27/t of CO2 rather than £100/t of carbon – even though they are exactly the same!
CO2 or CO2-equivalent (CO2-eq)? CO2-eq is a way to express the sum of the radiative forcing factors arising from the composition of the atmosphere over a given period of time (e.g. 100 or 200 years) as the equivalent amount of CO2. This is complicated by a variety of factors, e.g. different greenhouses gases or aerosols have different residence times in the atmosphere, some have a positive effect and others are negative. Another way to express this would be as the total radiative forcing (which is what the IPCC tend to use), but CO2-eq has become established in policy debates. Look out for this, because some reports cite CO2 (which is strictly only CO2), whereas others use CO2-eq. CO2-eq should express the sum of all forcings (because this is what matters for climate change), but sometimes it is used to refer to the forcings resulting only from the six gases regulated by the Kyoto Protocol.
Definitions and terminology matter here, because the numbers are used to inform policy responses (e.g. emission reduction targets). But too often authors are sloppy and use carbon and CO2 interchangeably, use CO2 sometimes to refer to CO2 only and sometimes as shorthand for all greenhouse gases – leading to all sorts of confusion. It makes a difference – and sometimes the slip conveniently understates the scale of the challenge.
Even then, converting between CO2 and CO2-eq is not straightforward, because CO2-eq is a way of grouping all greenhouse gas forcings and the combined effects are non-linear (they are related by a logarithmic function). The following figures from the UK Climate Change Committee (CCC; 2008, Chapter 1) may be a useful guide:
Between 350 and 485 CO2, add 95 ppm for CO2-eq
Thereafter, the relationship is non-linear, so:
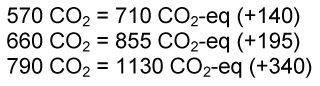
Having said all of that, if we use CO2-eq as shorthand for the net enhanced greenhouse effect, which includes both positive and negative forcing factors, then these factors more or less cancel each other out so that current atmospheric CO2 levels are close to CO2-eq.
RealClimate explains CO2-eq.
2.7.2 Volume and mass measures
Volume measures. We are familiar with contents listed as percentages (or ‘parts per hundred’) – such as the ingredients list for some foodstuffs, but greenhouse gases occur in tiny amounts in the atmosphere – much less than 1%. So scientists express these tiny amounts as ‘parts per million’ (ppm – 10 000 ppm is 10 000/1 000 000 or 1%). The current concentration of CO2 in the atmosphere is about 380 ppm, compared with the pre-industrial level of 278 ppm.
Mass measures. You'll come across a variety of measures, some familiar (tonnes and grams) – but sometimes prefixed by unfamiliar terms (like ‘mega’, giga and so on). Scientists use a standard system called the SI system. Here's what the prefixes mean:
mega – a multiple of 1 000 000 (106, abbreviated to ‘M’)
giga – a multiple of 1 000 000 000 (109, abbreviated to ‘G’)
tera – a multiple of 1 000 000 000 000 (1012, abbreviated to ‘T’)
peta – a multiple of 1 000 000 000 000 000 (1015, abbreviated to ‘P’).
1 tonne (1 t) is 1 000 000 or 106 g
1 million tonnes is sometimes called a megatonne (Mt)
1 billion tonnes is sometimes called a gigatonne (Gt).
Wikipedia has an entry on the SI system of units.
3 Anthropogenic causes of global warming
3.1 What are the main causes of the enhanced greenhouse effect?
The most significant greenhouse gas is CO2. When fossil fuels such as oil, coal and gas are burnt, CO2 is released into the Earth's atmosphere. The cutting down of forests also increases the concentration of CO2 in the atmosphere, as growing forests remove CO2 from the atmosphere by absorbing it in wood, leaves and soil; this CO2 is released back into the atmosphere when forests are burnt. The human activities of deforestation and fossil fuel use are the major anthropocentric causes of climate change.
But there are other important greenhouses gases, such as methane, nitrous oxide and water. And aerosols have a cooling effect. All of these, and others, are taken into consideration in arriving at the main conclusion above, and summarised in a neat diagram in the FAQ ‘How do human activities contribute to climate change and how do they compare with natural influences?’ from the IPCC.
In a short video with Sir David Attenborough, computer models are used to compare the natural and human causes of global warming.
3.2 Which is more important – deforestation or burning fossil fuels?
Globally, burning fossil fuels accounts for about 80% of the human contribution to the enhanced greenhouse effect, with the remaining 20% attributed to land use, land use change and forestry. It varies in different countries. In most developed countries the contribution is dominated by fossil fuel use (typically more than 90%).
There are lots of different ways to look at energy and climate statistics. Some headline figures for the UK are that:
energy use in buildings accounts for around 50% of UK emissions
power generation accounts for about two-thirds of emissions
transport (mainly private cars) accounts for over a fifth of emissions.
These web-based resources provide additional information
Part of the UK Government's pages on climate change provide a useful summary of the main sources of global and UK emissions.
The Guardian newspaper gives climate change statistics for every country and region.
Worldmapper shows greenhouse gas emissions at a glance – with country sizes distorted according to greenhouse gas emissions.
Annual statistics on UK emissions of greenhouse gases are provided by the UK Government.
Source data for the UK greenhouse gas accounts are available from the National Atmospheric Emissions Inventory.
3.3 What is included in national greenhouse gas accounts and what is excluded?
Signatories to the Kyoto Protocol are required to produce annual emissions inventories for the six gases covered by the protocol (CO2, methane, nitrous oxide, hydrofluorocarbons, perfluorocarbons and sulfur hexafluoride).
Emissions from international aviation and shipping (sometimes called bunker fuels) are excluded, as there is not yet an agreed method to allocate proportions of emissions to different countries.
The inventories cover emissions produced within territorial boundaries (production accounts).
This raises an intensive debate about emissions ‘embedded’ in goods and services imported from other countries. For example, one of the factors contributing to the decline in UK emissions since 1990 is the decline in the UK manufacturing sector. But the UK has not ceased to consume the products of those industries; we import them from elsewhere. Some analysts argue that we have a responsibility for those emissions in other countries that arise due to the consumption of goods and services in the UK. These are sometimes called consumption accounts, and the emissions are indirect emissions.
There are difficulties in allocating emissions in consumption accounts. For example arising from problems with defining boundaries for life cycle analysis, and apportioning emissions where there is more than one beneficiary in steps along the life cycle. So, international reporting continues to be based on production accounts (direct emissions). But consumption accounts reveal interesting perspectives that could be used to inform relevant policy interventions. For example, a number of separate studies of UK emissions based on consumption indicate that, rather than decreasing by 12% since 1990, emissions have in fact increased by 10% or more.
View the press release and the full report by the Stockholm Environment Institute for the Department for Environment, Food and Rural Affairs on UK consumption.
3.4 What is the relationship between affluence and climate change?
Emissions of greenhouse gases are normally reported by sectors for different countries. Researchers at Princeton University have come up with another view, calculating the emissions for every individual for every country in the world. The findings are striking.
The richest 500 million people on the planet (i.e. less than 10%) are responsible for more than 50% of global emissions, while the poorest 3 billion (i.e. just less than 50% of the population) are responsible for practically zero emissions. What's interesting about the analysis is that the findings apply to rich people in both rich and poor countries; similarly, those who bear least responsibility for the problem are the poor in both rich and poor countries.
Part of the rationale behind the work was to try to break the deadlock in negotiations between rich and poor countries – although it raises all sorts of questions about vested interests at the negotiating table. The analysis suggests that affluence is much more important than population as a cause of climate change. The author uses the analysis to support per capita caps on emissions to help solve the problem.
You might not agree with these findings, but one important point to emerge is that the way you look at a problem (e.g. climate change by emissions by country, sector or affluence/individual) will strongly influence the proposed solutions to it.
The Princeton research was presented by Stephen Pacala to the International Institute for Applied Systems Analysis (IIASA):
a 10 minute podcast and slides (you can listen to the presentation and scroll through the slides at the same time)
a transcript of the talk is available
the slides.
3.5 What has affluence got to do with the science of climate change?
This is an important question and relates to the perceived objectivity of science.
The example above on affluence and climate change is an example of a ‘poverty-based’ approach to equity and climate change.
Other perspectives on equity include:
Rights based – the right of people to the global commons, in this case a fair share of per capita emissions. Contraction and convergence is an example.
Liability based – the right of people not to be harmed by the action of others without suitable compensation (e.g. poor countries that are vulnerable to climate impacts would have rights to compensation).
Opportunity based – the right of people to achieve a standard of living enjoyed by those with greater access to the commons.
There are others, and they all these raise questions about the way that emissions are measured and about how responsibility for emissions is apportioned. So they all connect with science at least in relation to approaches to measuring emissions. It's quite difficult for science to avoid these issues, because adopting any single approach to measurement may implicitly assume one ethical approach over others.
As the IPCC notes:
The equity debate has major implications for how different stakeholders judge different instruments for reducing greenhouse gases (GHG) and for adapting to the inevitable impacts of climate change.
See the IPCC Fourth Assessment Report, Mitigation of Climate Change (Chapter 2, Framing issues, pp. 142 for a detailed discussion of equity issues in response to climate change.
4 The effects of global warming
4.1 What are the global effects of climate change?
There are three main global effects of climate change:
increasing global mean surface temperature
rising sea level (initially mainly as a result of thermal expansion of warmer seawater)
changing ocean water chemistry (increasing acidity as CO2 concentrations rise in the oceans).
The effects vary with increasing temperature. On the face of it the differences in temperature sound quite small (1 or 2°C or 3°C or more). But it is important to remember that these figures are for global mean surface temperature. They incorporate everything from the average temperature in the coldest parts of the Earth (e.g. Vostok in Antarctica with average monthly winter temperatures of less than −50°C) to average summer temperatures in the hottest places on Earth (+40 or 50°C). So, the global mean average incorporates a range of about 100°C, and the changes will be much more marked in some places than in others. In general, we expect to find much greater change at high latitudes (the polar regions) and low latitudes (the desert belts), while temperate latitudes will be slower to change.
Similarly, the impacts of sea level rise will be different in different parts of the world, depending on, for example, regional variations in the rise and fall of continents.
Changes in climate will interact with regional or local factors, including management of the land and sea to produce different effects in different places. It is often difficult to disentangle these factors to say how much is definitively attributable to a changing climate and how much is due to other factors. But a major conclusion of the IPCC Fourth Assessment Report is unequivocal evidence for climate change caused by human activity.
Additional information can be found in these web-based resources
Slideshow from the BBC entitled ‘How the world is changing’
Glacial Retreat 2009 BBC Film.
IPCC Fourth Assessment Report, Working Group III, Adaptation, Impacts and Vulnerability – Summary for Policy Makers
Red Cross Red Crescent Climate Guide .
4.2 What are the regional effects of climate change?
Just as the causes of the enhanced greenhouse effect are not evenly distributed (see Section 3, Anthropogenic causes of global warming), so the effects are also unevenly distributed. This uneven distribution applies both to impacts in different regions of the Earth and over time.
In general, the impacts will be most evident in more sensitive ecosystems, especially those at polar latitudes and those at low latitudes. There are substantial uncertainties in disentangling local management and other factors from climate. Nevertheless, a number of observations have been made that are consistent with the predicted impacts of climate change, leading to the unequivocal conclusion of the IPCC Fourth Assessment Report:
warming of the climate system is unequivocal, as is now evident from observations of increases in global average air and ocean temperatures, widespread melting of snow and ice and rising global average sea level
The website Global Warming: Early Warning Signs usefully recognises two main effects:
Fingerprints – direct manifestations of a widespread and long-term trend toward warmer global temperatures, such as:
heat waves and periods of unusually warm weather
ocean warming, sea-level rise and coastal flooding
glaciers melting
Arctic and Antarctic warming.
Harbingers – events that foreshadow the types of impact likely to become more frequent and widespread with continued warming, namely:
spreading disease
earlier spring arrival
plant and animal range shifts and population changes
coral reef bleaching
downpours, heavy snowfalls and flooding
droughts and fires.
The map, compiled by the Union of Concerned Scientists, helps you explore some of the evidence (fingerprints) and likely trends (harbingers) arising from climate change in different parts of the world. It was last updated in winter 2003, so it's a little dated now, but it's still a useful summary of observed trends and likely change.
Additional information can be found in these web-based resources
A podcast and animation from NASA shows the declining extent of the Arctic ice cap over the 30 years to 2008.
A slide show from the National Academies shows the impact of climate change for North America.
The website of the UK Climate Impacts Partnership (CIP) provides an overview of the scenarios and enables you to explore different climate futures for the UK.
The UK Marine Climate Impacts Partnership provides a similar service to UK CIP (above), but for marine impacts – see their annual report card.
The research report ‘A handbook of climate trends across Scotland’, published by the Scotland & Northern Ireland Forum for Environmental Research, describes likely climate trends and likely impacts for Scotland, based on UK CIP 02 scenarios.
The IPCC ‘Fourth Assessment Report Working Group III, Adaptation, Impacts and Vulnerability – Summary for Policy Makers’ discusses the strength of evidence across different regions of the world.
5 What will more global warming mean later this century?
5.1 How do we know what future climate will look like?
We don't ‘know’ what future climate will look like. The system is too big, open, complex and chaotic for that. But we can use models and scenarios to help us to improve our understanding of how the system works, and to test how it might respond to future changes.
We can test the models by their ability to reproduce historical climate change, and the impact of particular events such as volcanic eruptions.
These issues and related factors are explored in this section.
5.2 Why do we use models and scenarios?
Models and scenarios help us to make decisions. They are a way to simplify complex systems to help make decisions. Models are only as good as the
quality of the input assumptions
validity of the mathematical assumptions used to describe the system
way that the model treats uncertainty
way that users interpret the findings or results.
Answering the question about what more global warming will mean later this century requires some insight to future emissions. There are huge uncertainties here; for example, to do with future rates of economic growth and population in different parts of the world, the development of new technology and so on. One thing we know for sure (unless we are very lucky!) is that when we try to say things about what the world will look like in the future, we'll get it wrong.
Scenarios help us to explore a range of possible futures, which allows us to explore uncertainties more fully, based on the way that different and uncertain variables might change and interact. But we should always remember that scenario builders and modellers are all human. So it's inevitable that subjectivity, values, beliefs and feelings are embedded in all models and scenarios.
To an extent these tendencies can be evaluated through rigorous testing of models, for example by running hundreds of different models for the same set of input conditions and then by comparing the results – and to do this several times for several sets of different input conditions.
Nevertheless, this doesn't mean that that for example the central results are any more or less reliable than the extremes – they might for example reflect widely held prevailing social norms for the type of people who are inclined to develop and test models!
Models are the best tool we have for understanding the future direction of climate change. If anything they are more conservative than alarmist. Their veracity is tested by ‘predicting’ known climate or the impact of particular events (such as the eruption of Mt Pinatubo), which the best models do very well.
Or, as the IPCC put it in their Third Assessment Report (2001):
In climate research and modeling, we should recognize that we are dealing with a coupled non-linear chaotic system, and therefore that the long-term prediction of future climate states is not possible. The most we can expect to achieve is the prediction of the probability distribution of the system's future possible states…
Additional information can be found in these web-based resources
‘How reliable are the models used to make projections of future climate change?’ from the IPCC.
Briefing from NASA on the role of models in predicting future climate.
RealClimate on climate models.
DIY climate change modelling tools and resources for education and research at Educational Global Climate Modeling from Columbia University.
Your chance to help the climate modellers! – by allowing them to exploit the computing power of millions of PCs by remotely running a program on your computer (no catch, no hassle for you). See Climate Prediction for details.
Article from New Scientist ‘Why economic theory is out of whack’ discusses the role of assumptions made in models and the recent financial crisis, and a tendency to conservatism.
5.3 What are the IPCC scenarios?
In their own words:
Between its Second (1995) and Third (2001) Assessment Reports, the Intergovernmental Panel on Climate Change elaborated long-term greenhouse gas emissions scenarios, in part to drive global ocean-atmosphere general circulation models, and ultimately to assess the urgency of action to prevent the risk of climatic change. Using these scenarios led the IPCC to report a range of global warming over the next century from 1.4–5.8°C, without being able to report any likelihood considerations. This range turned out to be controversial, as it dramatically revised the top-range value, which was previously 3.5°C. Yet some combinations of values that lead to high emissions, such as high per-capita income growth and high population growth, appear less likely than other combinations.
The scenarios are still used, as the storylines still seem to apply to a wide range of possible futures. They are denoted by letters and numbers. There are four scenario families, two (coded A) for economic development and two (coded B) for environmental development. The families are subdivided to show whether the scenarios are globally (suffix 1) or regionally oriented (suffix 2).
So they are, broadly:
A1 – economic; global (further subdivided into A1F (fossil fuels), A1T (transition to non-fossil fuels) and A1B (balance – between A1F and A1T))
A2 – economic; regional
B1 – environmental; global
B2 – environmental; regional
The scenarios simply allow possible futures to be explored. Three important caveats apply to all of them:
they are descriptive
none is more likely than the others
all assume no new climate policies in the future.
The last one may need to be revised before too long. Actual emissions since 2000 have been higher than the worst-case A1F1 scenario. The IPCC Fourth Assessment Report estimates the range of temperature increase associated with this scenario to be 2.5°C to 6.4°C by 2100.
Report from the IPCC providing the rationale for the scenarios used in the Third and Fourth Assessment Reports (dated 2000).
Global Carbon Project's annual carbon budget report including a link to a slide show detailing actual emission trends compared with IPCC scenarios.
RealClimate discusses ‘What the IPCC models really say’.
5.4 What is the relationship between emissions now and climate change in the future?
The range of future climate change is constrained within quite narrow margins between now and 2030, because:
we are committed to change as a result of past emissions (the world would continue to warm by 0.6°C even if all emissions attributed to human activity were to stop immediately)
interactions between various forcing factors related to emissions into the atmosphere (some of which have negative effects but have short residence times) mean that there's a time lag between emissions of greenhouse gases and their effect on climate.
Current emissions will impact on climate from 2030 onward, so the level of climate change beyond 2030 depends crucially on the rate at which global emissions decline from now on.
From 1970 to 2000, global average mean surface temperature increased by 0.6°C, and will increase by a further 0.6°C by 2030.
On current trends and projections a ‘global average temperature warming of between 1.8°C and 4°C over 1990 levels by 2100, depending on the level of emissions, but warming of up to 6.4°C is possible’ (UK Government response to the recommendations of the CCC – see below).
If temperatures rise by 4, 5, 6°C or more by 2100, then that increase will be dramatic – all within 70 years from 2030 (but increasingly non-linear).
Briefing on future temperature change from the US Environmental Protection Agency.
5.5 What is climate sensitivity?
Climate sensitivity is usually expressed as the increase in global mean surface temperature for a doubling of atmospheric CO2 compared with pre-industrial levels. So, since pre-industrial levels were 278 ppm, it's the temperature associated with 560 ppm atmospheric CO2.
Climate sensitivity was estimated to be in the range 1.5–4°C by the US National Academy of Sciences in 1979. The range used by the IPCC is 2–4.5°C, although they note that higher values are possible. In the Second Assessment Report (1995) the best estimate was given as 2.5°C, rising to 2.8°C in the Third Assessment Report (2001) and 3°C in the most recent Fourth Assessment Report (2007).
The RealClimate report ‘Target CO2’ discusses climate sensitivity as high as 6°C.
5.6 So how much warming is likely?
There are two aspects to this question: by how much and when? This depends crucially on ‘climate sensitivity’. And there are two important aspects to this: one is about the temperature increase due to the enhanced greenhouse effect and the other is about how long it takes for the temperature to come down from there.
The actual increase in temperature cannot be given with certainty, but involves probabilities of keeping below or exceeding various temperature limits associated with different concentrations of greenhouse gases and other emissions (including aerosols, etc.).
The table below, from the UK CCC report in December 2008, is a useful guide.
| CO2 concentration (ppm) | CO2-e concentration (ppm) | Global mean T incr above pre-industrial at equlibrium (ºC) based on climate sensitivity of 3ºC | Peaking year for CO2 emission | Change in global CO2 emissions in 2050 (% of 2000 emissions) |
|---|---|---|---|---|
| 350–400 | 445–490 | 2.0–2.4 | 2000–2015 | −85 to −50 |
| 400–440 | 490–535 | 2.4–2.8 | 2000–2020 | −60 to −30 |
| 440–485 | 535–590 | 2.8–3.2 | 2010–2030 | −30 to +5 |
| 485–570 | 590–710 | 3.2–4.0 | 2020–2060 | +10 to +60 |
| 570–660 | 710–855 | 4.0–4.9 | 2050–2080 | +25 to +85 |
| 660–791 | 855–1130 | 4.9–6.1 | 2060–2090 | +90 to +140 |
Earlier policy discussions associated avoiding dangerous climate change with 2°C warming and a stabilisation target of 550 ppm CO2-eq, but that figure has now come down to 450 ppm CO2-eq. As mentioned in the answer to ‘What is the relationship between emissions now and climate change in the future?’ in Section 5.4, 2°C warming is now widely accepted as inevitable.
However, Jim Hansen (Director of NASA's Goddard Institute for Space Studies) and colleagues argue that climate sensitivity may be as high as 6°C and that a ‘safe’ stabilisation target is 350 ppm (30 ppm less than current levels). This is based on palaeoclimatic research on the growth of the Antarctic ice cap. After a thermal maximum 50 million years ago, global temperatures cooled and atmospheric CO2 declined until it reached a critical threshold between 350–550 ppm 35 million years ago when the Antarctic ice cap started to grow. So, the reasoning is that the more atmospheric CO2 concentrations rise above 350 ppm, the more likely major environmental change becomes. Part of the reason for adopting the lower end of this range is to be clear about the direction of travel required: a marked reduction in CO2 emissions rather than giving the impression that we can get away with slowing the rate of emissions.
Although the relationship between climate sensitivity and CO2 is believed to be linear for a doubling of atmospheric CO2, it is increasingly non-linear thereafter (e.g. due to increasing positive feedbacks as terrestrial and oceanic sinks take up less CO2 from, and begin to release stored carbon to, the atmosphere).
Animation and website dedicated to the science and campaign on 350 ppm.
Briefing and discussion on ‘Target CO2’ and for climate sensitivity as high as 6°C from RealClimate.
5.7 What is a ‘safe’ limit of climate change?
One answer to this (not as glib as it sounds) is that ‘there isn't one’ – at least if we mean by that a safe limit of the enhanced greenhouse effect. Defining an acceptable temperature increase is a political issue, although it may be informed by science. But the relationship between stabilisation levels for CO2 concentration, emission reductions, carbon budgets and temperature rise is mainly based on our scientific understanding of how the climate works.
The question raises a number of serious equity issues, some of which are outlined below.
The IPCC Third Assessment Report (2001) identified five reasons for concern in which to consider climate change risks with the intensity of impacts increasing from 1 to 6°C. These are still valid, although recent work suggests that the temperature thresholds for impacts may need to be lowered, and the upper range extended to 7°C.
The five reasons are:
risks to unique and threatened systems – from ‘risks to some (0.6°C) to ‘risks to many’ (6°C)
risk of extreme weather events – from ‘increase’ (0.6°C) to ‘large increase’ (6°C)
distribution of impacts – from ‘negative for some regions, positive for others’ (0.6°C) to ‘negative for most regions’ (6°C)
aggregate economic impacts – from ‘positive or negative market impacts; majority of people adversely affected’ (0.6°C) to ‘net negative in all metrics’ (6°C)
risks of large-scale discontinuities – from ‘very low’ (0.6°C) to ‘higher’ (6°C)
The notion of a ‘safe’ level of climate change goes to the heart of current policy debates. Current focus remains on the desire to ‘avoid dangerous climate change’ – the phrase at the core of the UN Framework Convention on Climate Change. That limit is commonly expressed as a rise in global average mean surface temperature of 2°C above pre-industrial levels.
However, we can already see that the impacts of climate change are not evenly distributed. Current impacts associated with an increase of 0.74°C over the last 100 years are already having serious impacts on a number of ecosystems and countries in different parts of the world. To the people affected by recent climate change, even this apparently small increase due to human activity looks pretty ‘dangerous’.
As authors on RealClimate put it
even a ‘moderate’ warming of 2°C stands a strong chance of provoking drought and storm responses that could challenge civilized society, leading potentially to the conflict and suffering that go with failed states and mass migrations. Global warming of 2°C would leave the Earth warmer than it has been in millions of years, a disruption of climate conditions that have been stable for longer than the history of human agriculture. Given the drought that already afflicts Australia, the crumbling of the sea ice in the Arctic, and the increasing storm damage after only 0.8°C of warming so far, calling 2°C a danger limit seems to us pretty cavalier.
The increasing diversity and intensity of impacts associated with increases in global average mean surface temperature above 2°C is the basis for that interpretation of ‘dangerous’, especially as above that level the effects are likely to become more and more widespread and so noticeable in the developed countries of temperate latitudes.
Furthermore, there are a number of technical and scientific problems in relating 2°C to a particular concentration of atmospheric greenhouse gases (a ‘stabilisation target’), as explored in the next question.
The IPCC Fourth Assessment Report – ‘Impacts, Adaptation and Vulnerability: Summary for Policy Makers discusses diversity and intensity of impacts with increasing temperature.
RealClimate on ‘Hit the brakes hard’.
5.8 How do you compare different emission reduction targets and carbon budgets?
With difficulty! But we need to pause and think about this. I want to address the question of timescales and measurements. In both the scientific and policy literature you'll see all sorts of timescales and measures for carbon targets and budgets, making it almost impossible to compare like with like.
Common dates for targets for policies are 2012 (end of the first Kyoto period), 2020, 2050 and 2100. But you'll no doubt find others thrown in for good measure too (a recent paper looks at carbon budgets from 1750 to 2500). For any target, the baseline is important, and common ones are 1990 (baseline for the Kyoto Protocol), 2000, or ‘now’ (the current year) – but you'll also find 1750 (start of the Industrial Revolution).
The baseline matters. We may have a target for a 50% reduction in annual emissions by 2050. Against a 1990 baseline that's 50% of 36 GtCO2-eq, so 18 GtCO2-eq in 2050. But if we opt for a baseline from ‘now’ for which the latest data are for 2007, that's 50% of 48 GtCO2-eq, so 24 GtCO2-eq in 2050. So, by moving the baseline we've just increased the emissions allowed in 2050 by a third! Moving baselines matter a lot – watch out for them.
Did I mention CO2-eq? There's another one. Sometimes quantities will be in carbon, sometimes as CO2 (CO2 = 0.27 × carbon), and sometimes as CO2-eq. CO2-eq is a larger figure than CO2-only, but the relationship between them is complex (see Section 5.6 – ‘So how much warming is likely?’) – especially when CO2-eq might mean ‘the six gases governed by the Kyoto Protocol expressed as the equivalent emissions of CO2’ or ‘all of the enhanced greenhouse effect expressed as the equivalent emissions of CO2’ (see Section 2.7 – ‘What do all of these different measures and units mean?’)
It can be difficult for even seasoned professionals to compare a GtC budget for 1750–2500 with a CO2 budget for 2000–2050 versus a CO2-eq for 1990–2050!
But that's what we'll have to do for the next few questions on targets and budgets and temperature increase. I've tried to work the figures so that we can make direct comparisons – but you might not want to take my word for it!
Author's reflection on scientific data and policy
There's a wider question here about the social context in which scientific work occurs; but, as far as basic measurements goes, this is an area where the scientific community really does itself very few favours. Scientists often complain about a mismatch between policy interventions and what the science says is required. But if scientists want policy makers to see the relevance of the evidence, then they have to spell it out to them in language that policy makers can relate to. That's not to say that the questions, methods, analysis and conclusions have to be framed in policy-relevant terms – clearly, natural processes have no regard for the ever-changing political processes and administrative boundaries invented by people. But if scientists want their findings to be reflected in policies, then they must help policy developers by interpreting their findings in a policy-relevant context.
Policy developers can and do play on this – given the ambiguity and confusion in the scientific literature, it's all too easy to make just about any claim and defend it on the basis of one scientific output or another. Science progresses through vigorous disagreement and debate, so I'm certainly not suggesting we stifle that. But unnecessary obfuscation through differences in basic things such as the metrics used is unhelpful.
5.9 What's the relationship between emission reduction targets, global carbon budgets and global temperature increase?
This depends on ‘climate sensitivity’, the time of peak emissions and the rate of decline thereafter. Because CO2 has a residence time of 100 years in the atmosphere, what matters is the total amount of carbon emitted.
The answer to ‘So how much warming is likely?’ (Section 5.6) gives some insight to the question here.
Current policy time horizons don't look beyond 2100, but a number of papers point to CO2 emitted by human activity influencing global climate for thousands of years. Once CO2 concentrations reach a particular point at any time from now on, even if emissions were then shut down completely the concentration would not reduce. Inertia in the climate system means that the CO2 concentration could stay at that level for hundreds of years at least.
Targets are an important way to communicate the complexity of a carbon budget. Even though they focus attention on a particular year (e.g. 50% by 2050), behind that lie calculations linking probable temperature ranges to concentrations of greenhouse gases in the atmosphere and the associated total emissions of greenhouse gases due to human activity. This gives a carbon budget. Like any budget, it can be profiled over the budget period to give the amount of carbon that can be released in any one year to remain within budget. If you overshoot in one year, then you have to find savings in subsequent years to get back within budget. For any plot of emissions over time (whether historical or projected) it is the area under the curve that represents the cumulative emissions (i.e. the carbon budget). This is the key number.
But there are limits to this financial analogy. One important difference is that early carbon savings are likely to be more valuable than emission reductions later in the budget period. This is because avoiding emissions sooner means that carbon doesn't get into the atmosphere where it remains for a long time with the potential to trigger positive feedbacks.
What matters most is the global carbon budget.
5.10 How do you work out a carbon budget?
Because CO2 has a long residence time in the atmosphere, it is the cumulative emissions that matter.
There are at least two ways to work out global carbon emission budgets to avoid 2°C warming – and they arrive at similarly challenging budgets.
One method is to link cumulative emissions to ‘stabilisation targets’ for atmospheric CO2 concentrations, taking account of uncertainties in the carbon cycle and the climate response. This yields probabilistic relationships between concentrations of atmospheric CO2 and likely increases in global average mean surface temperature. Limiting cumulative emissions over 2000–2050 to 1440 GtCO2 gives a 50/50 chance of exceeding 2°C; limiting them to 1000 GtCO2 gives a 75% chance of avoiding 2°C. Emissions between 2000 and 2006 were 234 GtCO2, and current annual emissions are 36 GtCO2. If we assume that annual emissions continue at a constant rate of 36 GtCO2 (rather than increasing at 1–3% a year as they have been since 2000), then we would use up the 1440 GtCO2 budget by 2039 and the 1000 GtCO2 budget by 2027.
The carbon emitted from known fossil fuel reserves (i.e. known and commercially viable) would be 2800 GtCO2. This vastly exceeds the carbon budget described above, without worrying about new finds or ‘peak oil’. Avoiding 2°C means that most of this – coal in particular – must stay in the ground.
Another approach uses a combined climate and carbon cycle model to produce simulations spanning a range of climate futures consistent with historical change. The results show that emitting a total of 3670 GtCO2 (=1 trillion tonnes of carbon) between 1750 and 2500 is likely to lead to exceeding 2°C. Since the start of the Industrial Revolution in 1750 humans have released 1835 GtCO2 (or 500 GtC) into the atmosphere – half of the budget.
That's a bit higher than the 1440 or 1000 GtCO2 (390 or 270 GtC respectively) budgets above, but note the timescale is rather longer (the budget period runs out to 2500 rather than to 2050) – and it's still much less than burning known fossil fuels.
Turning that back into targets equates to at least 80% reductions in global emissions by 2050 (rather higher than the ‘challenging’ 50% currently forming the basis of the post-Kyoto talks to be held in Copenhagen in December 2009).
And even 2°C is far from ‘safe’ for many people.
These web-based resources provide additional information
George Monbiot discusses these issues.
RealClimate discusses ‘How long will global warming last’.
RealClimate, in ‘Simple question, simple answer… not’, explores an answer to the question of the amount of global warming that greenhouse gases will bring.
5.11 How do the UK and Scottish Climate Change Acts compare with a 1000 GtCO2 budget for 2000–2050?
The UK's Climate Change Act was passed in 2008. The Climate Change (Scotland) Act received Royal Assent in August 2009. Both are rooted in the analysis and recommendations of the UK CCC.
Broadly, they both require reductions of at least 80% of greenhouse gases by 2050 compared with 1990 levels, with an interim target of reductions by at least 34% or at least 42% in 2020. The increase in the 2020 target depends on success in international negotiations during 2009 and a consequent increase in the EU carbon reduction target from 20% to 30% in 2020.
The UK CCC notes the importance of cumulative emissions and estimates the global budgets associated with the recommended targets (now adopted) to be around 2500 GtCO2-eq, of which they estimate about 780 GtCO2-eq has already been used (since 1990). They further emphasise the importance of continued reductions out to 2100.
The overall budget for 2000–2050 recommended by the UK CCC, therefore, is around 2200 GtCO2-eq (subtracting global emissions between 2000 and 2007 of about 300 GtCO2-eq from the 780 GtCO2-eq used since 1990 – assuming that emissions rose from around 40–48 GtCO2-eq from 2000–2007, based on figures in the report). The 1000 GtCO2 budget is equivalent to around 1500 GtCO2-eq for a 75% chance of avoiding 2°C (a 2000 GtCO2-eq budget gives a 50/50 chance of avoiding 2°C).
So, UK and Scottish targets would need to be higher and the emission reduction pathways would need to be steeper to maintain a better-than-evens chance of avoiding 2°C, consistent with the answer to ‘How do you work out a carbon budget?’ (Section 5.10).
The report ‘Part I: the 2050 target’ from the UK CCC sets out the rationale for recommended UK emission reduction targets, including associated global budgets.
5.12 Can we avoid a 2°C temperature rise?
The answers to the previous four questions explain the basis for the answer given here, which is that it's going to be difficult to avoid 2°C rise by 2100. It all very much depends on the global carbon budget.
The current focus of the policy debate is for a global peak in 2015, reductions of 3% each year leading to a 50% global reduction by 2050 – for a 50/50 chance of avoiding a 2°C increase. But recent work (see Section 5.10 – ‘How do you work out a carbon budget?’) suggests that global reductions of 80% are required.
If even a 50% reduction equates to 80% reductions for developed countries, if we are to give any space to developing countries to develop, then an 80% global reduction must come close to a requirement for full decarbonisation for developed countries by 2050 at the latest. Annual reductions will have to be much more than the 3% usually talked about, with some studies concluding that the challenge for developed countries is for reductions of at least 6% a year after a 2015 peak.
2015 is therefore a useful threshold for evaluating the likely effectiveness of proposed emission reduction measures. Most of the large-scale technology solutions that are proposed (e.g. new nuclear power stations, carbon capture and storage for coal and gas-fired power stations, hydrogen fuel for cars, large-scale shift to electric transport from low-carbon sources, alternatives to kerosene for aviation fuel and so on) are unlikely to make any impact on emission reductions (at least in the UK) before 2020–2025 at the earliest. At least five years too late.
The biggest tool in the box in the short term is behaviour change, with all of the political controversy that brings.
According to the Global Carbon Project's annual carbon budget, current global efforts to bring about reductions in CO2 emissions are putting us on a course for 4–6°C increases in global temperature.
Adapting to the inevitable impacts of climate change is essential. The further 1.2°C that will take us to 2°C is part of that inevitability. Beyond that depends on serious efforts through international policy development, regions (including coalitions of the willing), countries, business and individuals.
Mitigate for 2°C but adapt for 4°C is becoming an increasingly voiced message over the last two years or so.
Journalist George Monbiot gives a personal view after a meeting in Copenhagen in March 2009.
5.13 Do we have any control over climate impacts in the future?
We have no control over the 0.6°C increase that will occur between 2000 and 2030.
Increases after 2030 depend on the emissions that we produce every day from now on and how quickly we use up the total global carbon budget of around 1000 GtCO2 available to 2050 (or the 500 billion tonnes of C, or 1835 GtCO2 available to the global population up to 2500).
5.14 What about geoengineering? Won't that help us to control the climate?
This is an area where the social context of science is important, linking science, technology and ethics.
Geoengineering has been persistently talked about for a number of years now. As politicians avoid the challenge of reducing emissions and the impacts of climate change become more apparent, these solutions are being given increasingly serious attention – mainly in the belief that we can't afford to dismiss any potential solution.
Geoengineering solutions aim to cool a warming planet. Solutions can be divided broadly into two groups. One attempts to deal with short-wavelength radiation by reducing the amount of solar radiation entering the Earth's climate system. Examples include attempts to increase the Earth's albedo by cloud whitening or placing arrays of mirrors in space. The other group deals with long-wavelength radiation by attempting to reduce the amount of CO2 in the atmosphere. Examples include ‘biochar’ (turning biomass into charcoal and accelerating the uptake of carbon by soils) and fertilising plankton blooms in the oceans.
If they work (a big ‘if’), short-wavelength solutions are likely to act more quickly (almost instantaneous for some solutions) than long-wavelength solutions (tens of hundreds of years or more). Short-wavelength solutions won't deal with ocean acidification; long-wavelength solutions tend to involve very large-scale perturbations in regional or global ecosystems, which may involve adverse side effects.
Given the very substantial regional variations in climate in both space and time, geoengineering solutions inevitably raise fundamental ethical questions about who controls the climate and in whose interests is that control operated?
Robert Socolow (Princeton University) has some thought-provoking Powerpoint slides on ‘Prospicience and geoengineering: what if we can dial our future?’
RealClimate has a collection of briefings and discussion on geoengineering.
Activity 1
Think through these questions to explore the relationships between science, climate change and geoengineering solutions.
What ethical considerations should be taken into account in deploying geoengineering solutions?
Is it even sensible to think about ‘controlling’ a system as open and complex (and ever changing) as global climate?
What would be the ‘desired’ global average temperature?
How would we keep it there?
Who would make the decisions, over what spatial and time scales and in whose interests?
What do we really mean when we say we want to make the world a ‘better’ place?
6 What are the regional effects of climate change on different parts of the world?
This section briefly covers the main points from the UK CCC's excellent summary of the impacts and vulnerabilities in different regions of the world, based on the IPCC Fourth Assessment Report.
Areas particularly vulnerable to climate change include the Arctic (recent rapid reductions in the extent and thickness – of particular concern is the loss of ‘old’ ice), mountain ecosystems (where climate change pushes the habitable zone uphill until it runs out) and the Amazon rainforest (drought and fire).
Water. Dry regions get drier; wet regions get wetter and 1–2 billion people at risk for a 2°C warming. Longer droughts interspersed with heavier rainfall, leading to water management problems. Retreating glaciers and ice cover remove water sources for around 1 billion people. Areas particularly affected by water stress: southern Africa, the Andes, Asia, Australia, Mediterranean Europe and western USA.
Ecosystems. Climate exacerbates other human pressures on ecosystems. But 20–30% of plant and animal species face a ‘commitment to extinction’ directly as a result of climate change for a temperature rise of 2–3°C. After 4°C warming, major extinctions are likely. Systems at particular risk include tundra, mountain and Mediterranean-type systems, mangroves and coral reefs, all with significant knock-on consequences. Ocean acidification is expected to make it more difficult for marine organisms to form calcareous shells, with negative consequences across the food chain.
Food. Impacts on crop production are likely to differ markedly by region. Local warming of about 1–3°C gives positive impacts for food supply in temperate zones, depending on the crop. But in low latitudes expect falling productivity even for very low global temperature increases. Beyond a global average 3°C increase, world food production is projected to fall in all regions. Increased flooding and drought is also likely to put crops at risk. Areas facing a particular threat to food security and income include Africa, Asia and Latin America. Continued changes to the distribution of fish species are expected to have adverse impacts on fisheries.
Coasts. Large settlements and concentrations of infrastructure are often situated on coasts (e.g. eastern USA, Bangladesh and eastern China). Many small islands are also very exposed to changes in sea level. The IPCC estimated global average sea level rise of up to 59 cm above 1980–1999 levels by the end of this century, excluding the possibility of rapid melting of the Greenland and West Antarctic ice sheets. Up to 3 million people could be at risk of coastal flooding for a 2°C global temperature rise, with poor communities more exposed through their limited adaptive capacity. More recently, other studies have suggested that a global rise of 1.6 ± 0.8 m by 2100 may be more realistic.
Health. Despite some benefits, such as fewer deaths from cold exposure, climate change is likely to have a net negative impact on human health. Increases in deaths, diseases and injuries from heatwaves, floods, storms, fires and droughts are predicted, as well as problems associated with poorer air quality in urban areas. Reduction in crop productivity in low latitudes will increase levels of malnutrition. Infectious diseases will become less prevalent in some areas and more so in others.
Singular events. Rather than steadily varying impacts, major shifts in the Earth system may exceed some threshold, making them effectively irreversible. Examples include the possible melting of the Greenland and West Antarctic ice sheets. Models suggest that Greenland could start irreversible melting as a result of sustained global warming of 1.9–4.6°C.
7 What are the regional effects in different parts of the UK?
7.1 Current estimates (2009)
It's quite hard to answer this question at the time of writing. The best estimates currently available are from UK CIP published in 2002 (the ‘UK CIP 02 projections’). These are now six years old. A new set was published in Summer 2009 (UKCP09) based on the latest science.
When exploring these scenarios it is important to remember that they are just that – scenarios. They are not predictions. There are many possible climate futures, and scientists use models and scenarios to explore these uncertainties. For any given climate future there will also be short-term natural variability. Not all future summers with be hot and dry, nor winters wet and mild – there will always be a range of weather conditions. In 2050, average UK climate will be different from today, but individual winters and summers may be very similar to some summers and winters we experience today. Effective adaptation to a changing climate means taking account of short-term natural variability as well as the longer term climate vector(s).
These web-based resources provide additional information
The UK CIP overview of the scenarios is on their website.
The annual report card from the UK Marine CIP gives a succinct picture of the main changes in the marine and coastal areas of the UK.
The Scotland & Northern Ireland Forum on coastal flooding in Scotland projects net sea level rise, but could be revised upward by new UK climate projections.
This can be contrasted with current UK Government guidance on expected sea level rise, which still assumes net sea level fall for much of Scotland.
8 Common myths about climate change.
8.1 Can ‘global warming’ lead to regional cooling?
Yes! ‘Global warming’ can be a misleading term. It's accurate when applied to the change in global mean surface temperature – it has been rising for the last 100 years (see Section 2.5 – ‘What is happening to global temperatures?’) and will continue to do so (see Section 5.4 – ‘What is the relationship between emissions now and climate change in the future?’). But global mean surface temperature incorporates a huge variation in temperature (see Section 4.1 – ‘What are the global effects of climate change?’).
Local cooling (e.g. recent trends in parts of central Antarctica) is consistent with climate change models. It's not just the ice that helps to keep Antarctica cold, but ocean currents play a vital role too. Indeed, the isolation of Antarctica over the South Pole 35 million years ago allowed the circum-polar current to become established, and this is thought to have played an important role in keeping Antarctica cold and influencing global climate trends since that time.
In the longer term, weakening of the North Atlantic Drift/Gulf Stream could have a marked cooling effect for northwest Europe, including the UK and Ireland. Warm waters originating in the Gulf of Mexico currently keep the UK climate much milder than comparable coastal latitudes (e.g. Newfoundland, Canada). A large input of freshwater is considered likely to weaken the current, and this would be linked to rates of melting of the Greenland ice cap. This is currently considered to be unlikely before 2100 (see also Section 8.4 – ‘What will The Day After Tomorrow be like?’).
RealClimate discusses the merits of the term ‘global warming’.
Environment Watch has a brief outline on the main climate impacts across the UK, including discussion on possible cooling effects.
8.2 What are the upper limits of temperature increase and sea level rise?
The increase in global mean surface temperature over the next century depends on the emission scenarios, especially over the next five years and when global emissions peak and the rate at which they then decline. See Section 5 for more detail on future scenarios.
At current emission rates (especially since 2000), an increase of 2°C is unavoidable, and 4°C is probable. The upper end of the IPCC range in their Fourth Assessment Report (2007) was 6.4°C by 2100. The main uncertainties in the future are the economics, technology and rate of development – and hence the emissions pathway – hence the use of IPCC scenarios to explore this complex area and the range of temperature estimates covered by the scenarios.
For the science, the main uncertainty is ‘climate sensitivity’ – the amount of warming for a doubling of atmospheric CO2 concentrations compared with pre-industrial levels (broadly, from 280 ppm to 560 ppm). The current ‘best estimate’ for this is 3°C (IPCC Fourth Assessment Report), but that has increased in each assessment report (see Section 5.6 – ‘So how much warming is likely?’). There is agreement that climate sensitivity is likely to be linear up to around 2–3°C warming, and that thereafter it is likely to become increasingly non-linear as positive feedbacks kick in (such as reduced uptake of atmospheric CO2 by terrestrial sinks and the oceans).
Adjusting to warmer than 2°C worlds is likely to be challenging because of the uncertainties associated with the way that complex open systems like climate operate.
Sea level is more difficult to model. Current ‘best estimates’ are in the range 80 cm to 2 m by 2100. Major uncertainties include the rate at which the major ice sheets of Greenland and West/East Antarctica are likely to melt – and much current research is concentrated on understanding the dynamics of ice melting.
Mark Lynas presents a credible view of possible future climate worlds in his popular science book Six Degrees.
RealClimate endorses the scientific content of Mark Lynas's book Six Degrees and also discusses the question ‘How much will sea level rise?’.
8.3 Is the ‘hockey stick’ reliable?
The name derives from the shape of a curve that describes historical climate change (over the last 1000 years) and projected possible future climates to 2100 (based on the low/high emissions scenarios developed by the IPCC to explore future uncertainties).
RealClimate discusses ‘Myth vs. fact regarding the “hockey stick”’.
8.4 What will The Day After Tomorrow be like?
Not like The Day After Tomorrow! There is some good science in the movie, but it's masked by a lot of really bad science. The main problems are to do with the rates of supposed change. This is not a reliable source for commenting on future climate change.
In particular, the rapid shutdown of the North Atlantic Drift causing northwest Europe to plunge into a mini ice age is one particularly overhyped aspect of some popular coverage on climate change.
A personal view of some of the main features of climate change and analysis of ‘The Day After Tomorrow – good and bad science as presented in the movie’ is presented at Geoteach.com.
RealClimate discusses the idea of a Gulf Stream slowdown.
8.5 Can I rely on the science in Al Gore's movie An Inconvenient Truth?
Yes – it's pretty good. There are a few errors (nine ruled on in the UK courts – but see the New Scientist review below for further discussion on these). The errors are minor and don't detract from the validity of the main arguments. If you want a documentary to get an overview on the science of climate change, it's a good start.
Al Gore's film An Inconvenient Truth has a companion website.
BBC News covered the court ruling on the nine errors in Al Gore's film. Its opinion was that the errors did not detract from the main point of the film and its suitability for use as a teaching aid in UK secondary schools
The New Scientist review of the film An Inconvenient Truth, including commentary on the issues brought up in the UK court case.
RealClimate have a commentary on the science behind An Inconvenient Truth.
8.6 Is the media coverage on climate change accurate?
It depends; the prestige or quality press is getting better (with the possible exception of the Wall Street Journal) but the tabloids tend to be unreliable, presenting contrarian views and adding unnecessary confusion to the debate. Some of the specialised sections hosted by, for example, the BBC and the Guardian newspaper are very good.
There are two main characteristics of articles on climate change in the media. A tendency to pick up on ‘alarmist’ stories, coupled with a weak ‘action’ message so that the overall message is an apocalyptic one, ‘but it'll be OK if you turn off the lights on your way out’.
A third characteristic is a problematic attempt to achieve a ‘balanced view’. Often an interview with somebody who accepts climate change science is ‘balanced’ by another view from a sceptic. This leads to false objectivity, because the vast majority of scientists accept climate change science and the approach merely serves contrarian views. There are people who believe that the Earth is flat (The Flat Earth Society), but nobody would expect them to advise on planning satellite communications or teach Earth Sciences or geography. It's good to promote healthy debate on meaningful aspects of subjects, but not on issues that have been squarely reviewed and rebutted time and time again. Not one of the sceptics’ arguments stands up to any scrutiny, and many of their claims are mischievous and/or false. There are plenty of contentious issues and no shortage of uncertainty on the detail of climate change and the adequacy of responses to it – but the scientific case for it is well established.
These web-based resources provide additional information
The Institute of Public Policy Research has a report called ‘Warm Words 2: How the climate story is evolving and the lessons we can learn for encouraging public action’ characterising and analysing media coverage of climate change.
environmentalresearchweb have a briefing on a paper by Boykoff and Mansfield entitled ‘Media coverage on climate change’ and the tendency to diverge from the scientific consensus, especially in the tabloid press (and notably the Daily Mail).
Boykoff and Mansfield published ‘“Ye Olde Hot Aire”: reporting on human contributions to climate change in the UK tabloid press’ in Environmental Research Letters in 2008.
RealClimate discusses ‘Global warming delusions at the Wall Street Journal. Another RealClimate posting on the same theme is ‘WSJ editorial board: head still buried in the sand.
9 Why are some scientists sceptical about climate change?
9.1 What are the main climate change sceptics’ arguments and are they valid?
The top 12 main arguments are listed below. None of them stands up to scrutiny.
The Earth's climate is always changing and this is nothing to do with humans.
CO2 only makes up a small part of the atmosphere and so cannot be responsible for global warming.
Rises in the levels of CO2 in the atmosphere are the result of increased temperatures, not the other way round.
Observations of temperatures taken by weather balloons and satellites do not support the theory of global warming.
Computer models which predict the future climate are unreliable and based on a series of assumptions.
It's all to do with the Sun – for example, there is a strong link between increased temperatures on Earth with the number of sunspots on the Sun.
The climate is actually affected by cosmic rays.
The scale of the negative effects of climate change is often overstated and there is no need for urgent action.
Climate's changed before.
There is no consensus.
Variations on the Earth is cooling; we're heading into an ice age; it hasn't warmed since 1998; Antarctica is cooling/gaining ice.
Surface temperature is unreliable.
And so on. There are over 50 in total.
In the words of the Royal Society:
Our scientific understanding of climate change is sufficiently sound to make us highly confident that greenhouse gas emissions are causing global warming. Science moves forward by challenge and debate and this will continue. However, none of the current criticisms of climate science, nor the alternative explanations of global warming are well enough founded to make not taking any action the wise choice. The science clearly points to the need for nations to take urgent steps to cut greenhouse gas emissions into the atmosphere, as much and as fast as possible, to reduce the more severe aspects of climate change. We must also prepare for the impacts of climate change, some of which are already inevitable.
The Royal Society has produced answers to eight misleading arguments about climate change in their publication ‘Climate change controversies: a simple guide’
New Scientist has ‘Climate change: a guide for the perplexed’.
The Skeptical Science website examines the science of global warming scepticism and includes 74 sceptics’ arguments, ranked by frequency of occurrence.
RealClimate also has a set of ‘Responses to common contrarian arguments’.
9.2 Why the fuss about Channel 4's Great Global Warming Swindle?
The programme is a one-sided polemic providing a vehicle for a number of well-known sceptics to air their contrarian views. It misrepresented the views of prominent scientists – the IPCC, David King (the UK Government's Chief Scientific Advisor at the time the programme was aired) and Carl Wunsch. It has virtually no (I hesitate to say ‘no’) scientific merit, but it does provide a useful summary of most of the main sceptical arguments (and debunks them all in one go). Quite a lot of organisations took up this particular challenge, including the UK Government, the Royal Society of London and RealClimate.
A complaint was made to Ofcom about the programme. Their ruling in July 2008 found that the programme was misleading and that it did misrepresent the views of key individuals and the IPCC – so failed to show impartiality on a controversial issue. But the ruling also said that the programme did not materially mislead audiences ‘so as to cause harm or offence’, and so Channel 4 were not penalised for broadcasting the programme.
Why the fuss, then – if it was just a piece of harmless nonsense? The answer to this is more complex. I watched the programme and discussed it with people who get most of their information on climate change through the popular press and media. They are by no means stupid, but most of them were convinced by the programme. And why not? It was a confident piece, after all. You'd have to be pretty well up on some geeky aspects of climate science to spot the main flaws. One result of the programme has been to fuel doubt, mistrust and confusion among the public on issues and, hence, to muddy the waters for individual action, which in turn weakens politicians’ resolve to get on top of the issue.
So the fuss is about how science can be portrayed through the media and the influence (whether directly or indirectly) that can have on policy development. And the responsibility that the media have in representing issues, not just in an impartial and/or ‘balanced’ way (see Section 8.6 – ‘Is the media coverage on climate change accurate?’) but, crucially, where the weight of that consensus lies.
A common response from the media is that any news is good news if it helps to keep an issue in the news and have it aired and discussed.
These web-based resources explore this subject further
Letter from Carl Wunsch pointing out that his views were grossly distorted by Channel 4's Great Global Warming Swindle.
RealClimate discussion: Swindled! rebuts all of the main ‘arguments’ put forward in the film.
Website dedicated to the Ofcom complaint on The Great Global Warming Swindle, including the full complaint, the Ofcom ruling and responses to the ruling by authors of the complaint
Press release from the National Environment Research Council on Ofcom's ruling.
BBC coverage of the Ofcom ruling.
9.3 So why are some scientists sceptical about climate change?
The emphasis on ‘why’ makes this a more difficult question to answer, as it requires some knowledge of people's motives. It involves some insight to the social construction of science, vested interests, strategies and tactics to influence policy, different world views, values and beliefs and something about public understanding of science, to name but a few factors.
The scientific community is just that – a community. We are not all the same. There are academic scientists, government, business/industry, NGOs, independent consultants and so on. Most people are going to work to work in areas where their professional role doesn't conflict with their personal beliefs.
There are many different scientific views – sometimes on the detail, sometimes leading to paradigm shifts. Dispute, debate and discussion are essential for science to thrive and survive.
All of that challenges the notion of ‘objectivity’ in science – at least in the commonly held notion of there being some single dispassionate position that is somehow insulated from an individual's life history, social context, their place in the scientific community and where the science is going.
A cynical view might be that independence and objectivity stops where the pay cheque starts. You don't want to bite the hand that feeds you. Where possible it's certainly worth checking who supports different viewpoints (e.g. ExxonMobil are often connected to climate change sceptic views – they may have a vested interest in doing so).
Some people are sceptics because they don't agree with the actual or proposed response to climate change. For example, if the crux is rapid and steep cuts in emissions of greenhouse gases, some of the proposed solutions challenge our lifestyles and the way we organise our society, how we express ourselves through the goods and services we purchase, sense of self, our ‘shared values’ (whatever they are) and so on. One response to that is to provide contrary views about the nature of the problem (i.e. that there isn't one). An alternative response might be to accept the evidence and find alternative solutions.
Some scientists are ‘sceptical’ not because they disagree with the science of climate change, but because they react against the hyperbole and alarmist nature of media coverage, which can then distort the policy response to the issue.
RealClimate discusses various aspects of climate change scepticism.
SourceWatch exposes the actors, factors and issues behind the climate sceptics.
The Tyndall Centre has a briefing note entitled ‘“Dangerous claims”: is the way we perceive climate change leading to a precautionary approach or an irrational response?’
9.4 What can I conclude from this evidence?
I hope you are able to agree with the IPCC that:
warming of the climate system is unequivocal, as is now evident from observations of increases in global average air and ocean temperatures, widespread melting of snow and ice and rising global average sea level
and with the Royal Society of London that:
Our scientific understanding of climate change is sufficiently sound to make us highly confident that greenhouse gas emissions are causing global warming. Science moves forward by challenge and debate and this will continue. However, none of the current criticisms of climate science, nor the alternative explanations of global warming are well enough founded to make not taking any action the wise choice. The science clearly points to the need for nations to take urgent steps to cut greenhouse gas emissions into the atmosphere, as much and as fast as possible, to reduce the more severe aspects of climate change. We must also prepare for the impacts of climate change, some of which are already inevitable.
I also hope that you agree that urgent action is required to reduce emissions of greenhouse gases markedly, but that the response should not be based on hyperbole and alarmist media coverage that distorts the scientific basis for our changing climate. The likely change arising from recent and current emissions even when stated conservatively, by discounting the likelihood of more extreme events or rapid positive feedbacks, is more than alarming enough. Responding to the science of climate change is very much a social and political process; as individuals, scientists are very much part of those processes.
Acknowledgements
Grateful acknowledgement is made to the following sources for permission to reproduce material in this unit:
The content acknowledged below is Proprietary and used under licence (not subject to Creative Commons licence). See Terms and Conditions.
Text
Unit authored by Clive Mitchell
Unit image
Getty photodisc