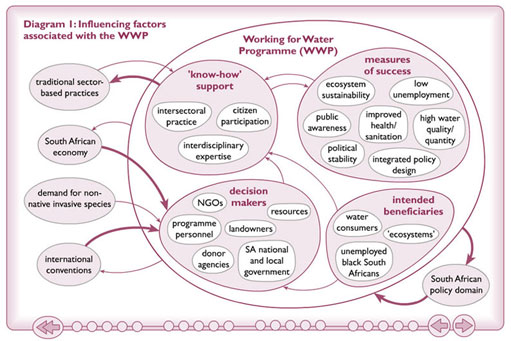
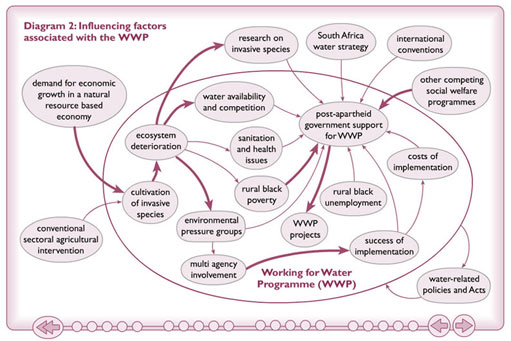
3.2 Final diagrams
You may wish to refer back to the WWP case study as you work through the activity on this page.
For a printable A4 size copy of this diagram, click on ‘View document’.
View document [Tip: hold Ctrl and click a link to open it in a new tab. (Hide tip)]
For a printable A4 size copy of this diagram, click on ‘View document’.
Activity 4 Systems map
Copy out or retrieve the systems map that you drew for the activity on systems mapping and sketch in arrows to indicate areas of strong and weak influences.
In addition, draw an influence diagram of one of the following starting from a blank sheet of paper:
- your impressions of key influences on the South African Working for Water Programme; or
- another example of an intervention or event that you have personal experience of, or familiarity with, in relation to work or other areas of interest.
Identify the key structural features of influence and arrange them clearly on your diagram. See if you can draw a boundary between structural features that might be components of the system of interest and elements that lie outside the immediate concerns of a system of interest. Distinguish between strong and weak lines of influence.
After completing your diagram, note the strong and weak influences associated with your diagram and write down brief notes on which structural features need attention in the event of further intervention.


