

4.4 Power versus interest
In terms of trying to plan for a successful system, one important step is to find out more about the criteria a stakeholder or group of stakeholders would use to judge the system’s success. A tool that can be used here is the power/interest grid. This grid is sometimes referred to as Mendelow’s matrix (Mendelow, 1991) and is shown in Figure 2.
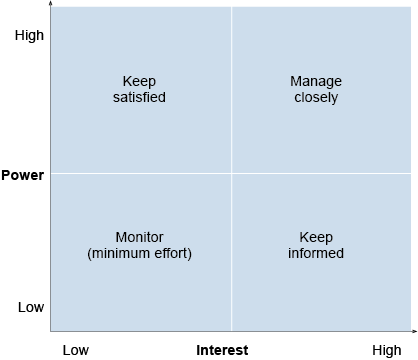
As you can see, the grid has four cells that are labelled according to the strategy for managing the stakeholders. Groups of stakeholders, and individual stakeholders where necessary, are plotted against the two dimensions of this grid, power and interest, and then treated according to the quadrant in which they fall.
‘Level of interest’ is relatively straightforward to estimate but there is the complication that it can change over time so after initial judgements have been made they need to be monitored carefully to look for shifts. Power is a much more slippery concept. For example, disparate groups of stakeholders, each with very limited amounts of power individually, can wield a surprising amount of power if they unite in common cause and it is also possible for stakeholder power to aggregate unintentionally in a ‘bottom-up’ fashion. For this reason we shall be considering the concept further in the next section. Before we do that let us look at a way of presenting the results of a stakeholder analysis. This is shown in Table 5 where a couple of sample rows of a table are presented showing stakeholders, their goals, their past reactions to change, what can be expected of them now, whether the change embodied within the proposed system will affect the stakeholder in a negative, positive or mixed way and what their likely reaction is going to be. The last column is being used to indicate ideas for managing the relationship with that stakeholder while the system is developed and put in place.
| Stakeholder | Their goals | Past reactions | Reactions expected | Impact on stakeholder: negative/positive | Possible future reactions | Ideas to ensure support |
|---|---|---|---|---|---|---|
| Production managers | Keep production on schedule | Sceptical of benefits of change, worried about problems with new systems | Likely to be furious if things go wrong at changeover | Could be negative if things go wrong; should be very positive if things work well | Could refuse to switch to new system if they remain sceptical of success | Keep them abreast with progress; involve them in trial runs and testing of new system |
| Production operatives | Remain in paid employment | Contact unions if the change is likely to have a detrimental effect on their jobs | Likely to be obstructive if the change is seen as negative | Should be positive if the new system improves productivity and brings in more customers (and jobs) | Could refuse to operate the new system if they feel watched or their jobs are threatened | Explain benefits of the new system; offer bonuses for increased productivity |