

2.8 Social competition, stress and subordination in humans
Status hierarchies are deeply ingrained amongst humans, and social and economic hierarchies and inequalities within and between societies have powerful consequences for poverty, self-esteem and health, including mental health (Wilkinson and Pickett, 2009).
Humans also appear highly sensitive to situations that parallel, or are analogous to, outranking and defeat in animals such as monkeys. The clinical psychologist Paul Gilbert (Gilbert 1989, 1992), building on the suggestions of Price and Sloman (1987), suggests that ‘evolutionary-based “social mentalities” that involve ranking and power are activated in depression’. Essentially he believes that depression is a state like that of an outranked, defeated monkey, and is likely to be provoked by situations of loss where a person feels ‘helpless and powerless, seeing no way forward’. Gilbert suggests these are also situations in which people are likely to feel humiliated and ashamed.
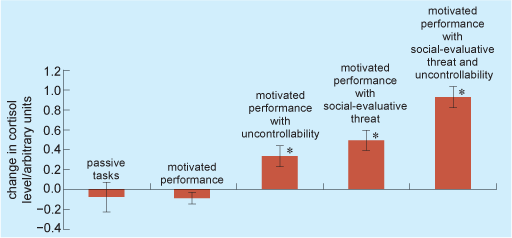
In support of these suggestions, there is evidence that the situations people find most stressful are ‘social evaluation’ situations, where not only might they fail, but they will be seen to fail – that is, situations where public humiliation is a possibility. For instance, Dickerson and Kemeny (2004) reviewed studies of cortisol levels in people placed under different kinds of stress. They found that people’s cortisol levels were highest in situations where their performance was likely to be assessed in public and where they felt they had no control over their performance (Figure 9). (See Box 1 for an explanation of the type of data shown in Figure 9.) Some of the changes in cortisol levels shown in Figure 9 were statistically significant. Statistical significance means that a mathematical test has been applied to the results and has shown there to be a difference that is ‘real’; in other words, a difference that is most unlikely to have been obtained by chance. When scientists report that the results are significant, they mean that they are statistically significant.
Gilbert (1989) suggested that what would be most likely to lead to depression would be:
- situations of direct attack on a person’s self-esteem that forced the person into a subordinate position
- events undermining a person’s sense of rank, attractiveness and value, particularly via the consequences of the event for roles (for instance, as a mother or professional) that the person held dear; and
- blocked escape.
Testing these ideas, Brown et al. (1995) found that humiliation and entrapment were indeed the most powerful provoking events for the onset of major depression in their study population of women (Table 1; see also Box 2 for definitions of humiliation, etc.).
| Psychosocial aspects of life event | Number of events that occurred in this category | Number (and %) of events in this category that provoked onset of major depression |
|---|---|---|
| Humiliation and entrapment | 131 | 41 (31%) |
| Loss alone | 157 | 14 (9%) |
| Danger | 89 | 3 (3%) |
| Total | 377 | 58 (15%) |
The differences shown Table 1 are highly statistically significant.
From Table 1, what is the second most powerful provoking kind of event for the onset of depression?
Loss alone – 9% of such events led to depression.
Box 1 Research methods: analysis of scientific data – descriptive statistics
The data in Figure 9 are shown as the mean change in the concentration of cortisol in the blood, plus the SEM (standard error of the mean, which is generally written as +/− SEM) You will probably be familiar with the term ‘mean’ which is calculated by adding up all of the data from a group of participants and dividing the total by the number of participants. The mean is sometimes referred to as the average and it allows simple comparisons to be made from one group to another. For example, you can easily see that the mean results for those in a situation of ‘motivated performance with social evaluative threat and uncontrollability’ are very different for the results for those in a situation of ‘motivated performance with uncontrollability’. However, the mean is a summary of the data obtained and can mask considerable variation within the data. The size of the mean does not tell you anything about the range of the data, in other words the lowest and the highest values. It is possible that some of the values obtained in the first group above were the same as values obtained in the second group above. The second problem with the mean is that it can be distorted by one value that is much higher or lower than the rest of the values obtained for the group. For these reasons, sometimes different ways of summarising data are used, which give a different picture of the data. The first of these is the median, which is found by ranking the data in order of value and taking the middle value (median values are shown in Figure 13). The second is the mode, which is the value that occurs most frequently. The mean, median and mode are sometimes referred to as ‘measures of central tendency’.
Most scientific data in this course, however, are presented in the form of a mean. In order to make sense of differences between means, researchers calculate an additional statistic which takes account of the pattern of the observed values, known as the variance. The variance is calculated from the differences between each value and the mean, so the more values there are that are much higher or lower than the mean, the greater the variance will be. The variance is usually quite a large figure relative to the mean value, so the square root of the variance is often used, known as the standard deviation (SD). The SD therefore gives an idea of the spread of data about the mean. Alternatively, a further calculation is performed, which takes into account the number of participants, giving a SEM. The SEM gives an idea of the accuracy of the mean, or how close it is to the true population mean. Data is usually presented in the form mean ±SD or mean ±SEM. In graphs, the SD or SEM is usually shown as a small bar (line with a flat top) above and below the mean value, as shown in Figure 9.
In summary, descriptive statistics such as the mean, SD and SEM, are used to summarise quantitative data and provide useful information about the values and spread of data obtained in different groups. They allow comparisons between groups. They do not, however, allow any meaning or significance to be inferred from these observations; this requires the application of a relevant statistical test.
Box 2 Psychosocial dimensions of life events
(Modified from Kendler et al. (2003))
- Loss: for example, a real or anticipated loss of a person, a material possession, employment, health, respect in the community or a cherished idea about oneself or someone close to oneself.
- Humiliation: feeling devalued in relation to others or against a core sense of self, usually with an element of rejection or sense of role failure.
- Entrapment: ongoing circumstances of marked difficulty of at least 6 months’ duration that the subject can reasonably expect will persist or get worse, with little or no possibility that a resolution can be achieved as a result of anything that might reasonably be done.
- Danger: the level of potential future loss, including both the chance that a given traumatic event will recur or a possible sequence of circumstances in which the full threat or dire outcome has yet to occur.
In the following section we consider emotional disorders, such as major depression, further.