

1.2 Tools for analysing digital library content today
We can do a lot of analysis working with the metadata. For example, we can analyse correspondence networks without needing transcriptions of letters, using a resource like Early Modern Letters Online (EMLO) [Tip: hold Ctrl and click a link to open it in a new tab. (Hide tip)] which is a growing catalogue of correspondence.
We can also use tools that help us analyse the digital content. This is often called ‘distant reading’ after Moretti (2000).
NGrams
The Google Ngram Viewer allows us to chart the frequency of different items in Google Books texts from different times.
The graph below shows how the frequency of the words ‘radio’ and ‘wireless’ varies across time.
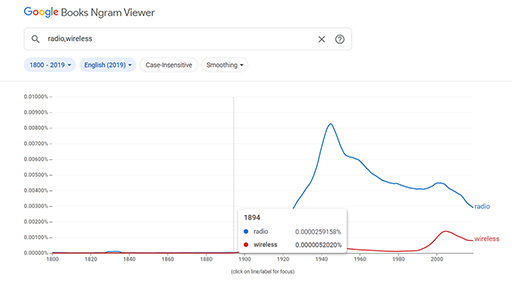
Activity 2 Using the NGram viewer
See if you can obtain the same graph as above, i.e. the frequency of wireless and radio in Google Ngram Viewer, using corpus English (2019) and smoothing 3. See how changing the settings affects the outcome and reflect on what this tells us about the corpus. (With thanks to Ylva Berglund Prytz, University of Oxford, for this question.)