2.3 Understanding the main sequence
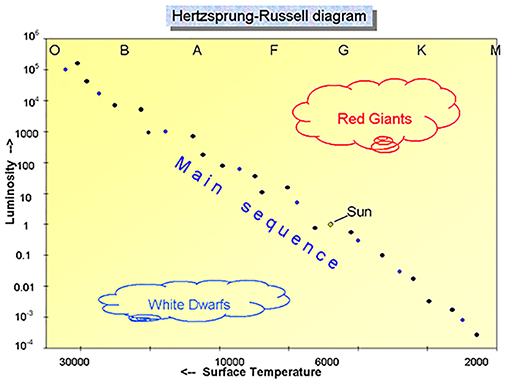
Figure 3 shows a schematic version of the HR diagram that we constructed in the video in the previous section, with the main sequence highlighted.

Full resolution image here [Tip: hold Ctrl and click a link to open it in a new tab. (Hide tip)]
In this section you concentrate on the main sequence, which is a broad strip running from the top left to bottom right of the diagram, and which contains about 90% of all of the stars in our Galaxy. There are three main conclusions to draw from this plot:
- Firstly, stars span a huge range of temperatures and luminosities. The temperature ranges from about 2000 K for the coolest stars, to 30 000 K for the hottest. And in terms of luminosity, stars range from 10 000 times fainter than the Sun to a million times brighter. This is a huge range – much wider than the range of temperatures.
- Secondly, not all combinations of temperatures and luminosities are equally likely. The vast majority of stars lie on this main sequence, with other regions for giants and white dwarfs, but some parts of the diagram are more or less empty, indicating that those particular combinations of brightness and temperature do not occur.
- Finally, the stars on the main sequence show a strong correlation between temperature and luminosity, becoming more luminous as their temperature rises.
In order to understand these ranges of temperatures and luminosities and the relationship between them that defines the main sequence, we need to look at the physical reasons behind how the stars emit their energy.
In Week 5 you learned that increasing the temperature of any object results in the colour of light it emits becoming bluer (or in scientific terms the peak in the emitted spectrum at which the most energy is emitted shifts to shorter wavelengths). It turns out that there is another, related, effect – that the hotter an object is, the more energy it emits, which is another way of saying that it becomes more luminous. And this is exactly what we see for stars.
In fact the energy output (or luminosity) of a heated object such as a star is a very sensitive function of its temperature. If you remember back to Figure 2 in Week 5 with the heated metal balls – the hottest one on the right was very much brighter than the others. It turns out that if you increase the temperature of an object by a factor of two the object emits sixteen timesas much energy. The mathematical relationship is that the amount of energy emitted depends on the fourth power of the temperature all other things being equal.
How much would the energy output of a body increase if its temperature increased by a factor of 10?
The mathematical formula means that the temperature is multiplied by itself four times. . Another way to calculate this is to square the number and then square it again. In this case, if the temperature increases by a factor of 10, the luminosity (energy output) would increase by 104 – or 10 000 times.
The answer to this question explains in part why the hotter stars are more luminous. Yet the range in luminosities on the HR diagram is far greater than the factor of alone would suggest. The temperature scale on the diagram covers a range of 2000 to 30000 degrees – a factor of 15. Taken alone, this would suggest a range of approximately 50 000 in energy output , yet the luminosity scale is far more wider-ranging than this – from one-thousandth of the brightness of the Sun to more than a million times. This suggests that the stars on the main sequence must differ in ways other than temperature alone.
What additional factor could influence the luminosity of a star?
The size of the star will also affect the luminosity. A large star will radiate more energy than a smaller star of the same temperature, simply because it has a larger surface area. To explain the wide range of luminosities, the brighter stars on the main sequence must be larger in diameter as well as hotter.
