Skip to content
Skip to main content

About this free course

Download this course

Share this free course

MSE’s Academy of Money

Start this free course now. Just create an account and sign in. Enrol and complete the course for a free statement of participation or digital badge if available.
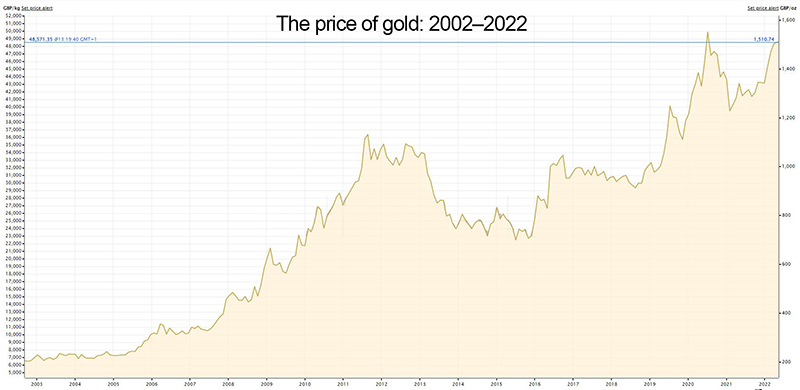
The image is a line graph showing the price of gold between 2002 and 2022. Over this time period the price has risen markedly – from just above £200 per ounce to close to £1,500 per ounce. This increase in price was particularly pronounced from 2006. The direction of price was, though, not upwards throughout with sharp falls in price in the mid-2010s and in 2020.
Figure 14 Commodity prices can be volatile

 13 Understanding commodities