EEA, 2012
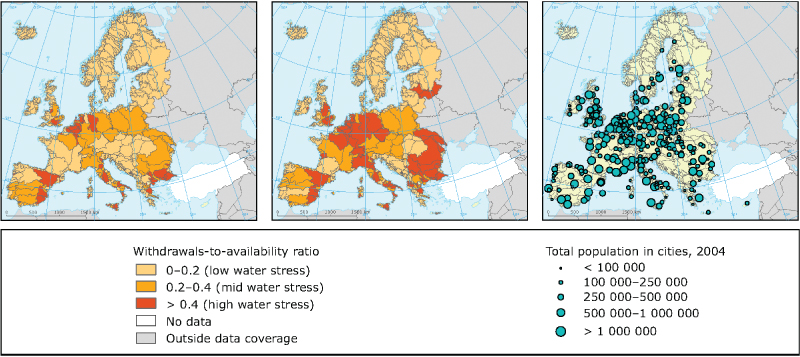
Figure 16 Water stress indicator for annual average on river basin level for the 2005 baseline (left), for 2050 under ‘economy comes first’ scenario (middle) and compared with urban population numbers (right)

Personalise your OpenLearn profile, save your favourite content and get recognition for your learning

Start this free course now. Just create an account and sign in. Enrol and complete the course for a free statement of participation or digital badge if available.