Week 2: Income, taxation and benefits
Use 'Print preview' to check the number of pages and printer settings.
Print functionality varies between browsers.
Printable page generated Sunday, 5 April 2026, 12:46 AM
Week 2: Income, taxation and benefits
Introduction
Martin gives you a heads up on what to expect.
This is where you start to build your budget, filling in all your sources of income using a budget planner. Make sure you keep a copy of your workings so that you can refer to them again when you complete your budget by adding your expenditure. You can record these details in your fact find.
Transcript
This course is presented with the kind support of True Potential LLP.
The True Potential Centre for the Public Understanding of Finance (True Potential PUFin) is a pioneering Centre of Excellence for research in the development of personal financial capabilities. The establishment and activities of True Potential PUFin have been made possible thanks to the generous support of True Potential LLP, which has committed to a five-year programme of financial support for the Centre totalling £1.4 million.
2.1 Income, wealth and assets
When thinking about personal finance it’s important to make a distinction between income and what is commonly called ‘wealth’. This might appear strange – having a high income and being wealthy are sometimes perceived as being the same thing, but they are two different concepts.
Income is a flow of money received over time – such as salary or benefit payments. An income flow might be, say, £24,000 per year, or the same amount could be expressed as £2000 per month, or £462 per week.
Wealth is a stock of assets owned and valued at a particular point in time. There are several ways of categorising these assets. The Office for National Statistics (ONS) splits assets into financial assets and non-financial assets (Social Trends, 2010). Financial assets are those assets which are not physical things and are held in order to produce a flow of income and/or a monetary gain. Examples are money held in a savings account (which pays interest) or share holdings (which usually pay dividends). By contrast, non-financial assets are those assets – usually tangible, physical items – that do not normally provide a flow of income, such as property, jewellery or an expensive work of art. Usually in order to obtain money from these assets you would have to sell them.
Assets can be categorised in other ways too. All of the examples so far are assets for which a market value (or price) can be realised, and so they’re said to be ‘marketable’ assets. However, there are some assets – such as money held in an occupational pension scheme – that normally cannot be sold, and so these are classed as ‘non-marketable’ assets.
A third way of categorising assets is perhaps the most important for personal finance. This is dividing up assets according to how ‘liquid’ they are. Liquid assets are those that can be converted into cash easily and readily. The most liquid asset is cash. Other liquid assets include the balance on a current account or a savings account. There are other assets that cannot be sold or liquidated so easily, such as a house. Later in the course you’ll look at household assets in more detail. In this session we concentrate on income.

2.1.1 Income or asset?
This quiz tests your ability to distinguish between an income and an asset.
Activity 1
a.
Antique clock, M&S shares, savings interest, salary
b.
Classic car, Ming vase, pension fund, Tesco shares
c.
Furniture, home being bought with mortgage, jewellery, monthly pension
d.
Apple share dividends, bank account, rent from buy-to-let property, shares in an investment fund
The correct answer is b.
b.
Well done.
2.1.2 Incomes and inflation
In order to consider changes in income levels or other financial variables over time, it’s important to know whether figures are in ‘real terms’. Figures that are expressed in ‘real terms’ have been adjusted to take inflation into account, so that we can compare like with like.
Let’s look at inflation in a bit more detail.
Inflation refers to a sustained increase over time in the general level of prices for goods and services. If, for example, the rate of price inflation is 4%, this means that you will need £104 to buy the same goods and services next year that you can buy this year with £100.
There are two main inflation figures used in the UK: the Consumer Prices Index (CPI) and the Retail Prices Index (RPI). Both follow the same underlying principle of expressing the rate of inflation as a percentage figure by measuring how much a typical ‘basket’ of goods changes in price from one year to the next.
The CPI and RPI are calculated once a month, with the contents of the basket of goods designed to reflect household spending. For many years the RPI was most commonly used in the UK. More recently the UK government has used the CPI. A key difference between the two is that the CPI excludes important housing costs such as mortgage interest payments and Council Tax. Typically, the CPI is lower than the RPI (ONS, 2012). Any shift to putting up state benefits or other financial payments in line with CPI, as opposed to RPI, would result in lower increases, which would save the government money. Recently (2014 to 2018), the RPI rate has tended to be circa 1% above the CPI rate.
Inflation is a concept that is crucial to personal finance, as is the distinction between real values, which have been adjusted to take into account inflation, and nominal values, which have not. Real values are usually expressed in terms of a particular year’s prices, such as ‘expenditure at 2018 prices’ or ‘income at 2018 prices’. When you see such a phrase added to a set of figures or a graph, you can tell that the values have been adjusted to take inflation into account. In the example above, where inflation is 4% and you will need to have £104 to buy the same as £100 today, £104 is the nominal value but the real value (the buying power of that money) is £100.
Let’s apply this to income. If, one year after starting a new job, your annual salary rises by 5% from £20,000 to £21,000, the nominal value of your salary is £21,000. But if price inflation in the same period has also been 5%, the real value of your new salary is £20,000 – the same as it was a year ago.
In real terms disposable income per head more than doubled between 1971 and 2007 (Social Trends, 2010). This would suggest that households in 2007 could afford a considerably higher standard of living than households in 1971. But in a number of years since the financial crisis of 2007 and 2008 the real incomes of many households in the UK have fallen, because nominal pay increases, particularly in the public sector, did not keep pace with price increases. Sharp price increases in energy, petrol and food at certain points during these years particularly hit living standards.

2.1.3 Measuring real incomes

Have a go at measuring change in the real value of incomes.
Let’s say that your monthly gross income today is £1000.
The annual price inflation rate for the next three years is forecast to be 2% (this means that prices will rise by 2% in each of the next three years).
First, you want to know the real value of the £1000 in a year’s time. Go to the column in Table 1 that shows 2% and look at the row for one year. This shows that the real value of your £1000 gross monthly income will be £980.39 in a year’s time.
| Number of years | 1% | 2% | 3% | 4% | 5% | 6% | 7% | 8% |
|---|---|---|---|---|---|---|---|---|
| 1 | £990.10 | £980.39 | £970.87 | £961.54 | £952.38 | £943.40 | £934.58 | £925.93 |
| 2 | £980.30 | £961.17 | £942.60 | £924.56 | £907.03 | £890.00 | £873.44 | £857.34 |
| 3 | £970.59 | £942.32 | £915.14 | £889.00 | £863.84 | £839.62 | £816.30 | £793.83 |
| 4 | £960.98 | £923.85 | £888.49 | £854.80 | £822.70 | £792.09 | £762.90 | £735.03 |
| 5 | £951.47 | £905.73 | £862.61 | £821.93 | £783.53 | £747.26 | £712.99 | £680.58 |
Now try the calculation again but with an inflation rate of 5%. What’s the outcome?
Now try the calculation again with the original inflation of 2% per annum but for a period of three years. What’s the outcome in three years’ time?
Next, think about the impact on real incomes if there’s an increase in the nominal value of your earnings.. Here what you have to do is calculate the difference between the growth of gross income and the rate of price inflation.
For example, for many people in the UK between 2010 and 2015, gross incomes were unchanged or grew at around 1% each year, while prices rose typically at between 2% and 3% each year. So, for many people, a reduction in real value of incomes was experienced in the range of between 1% and 3% each year.
Use Table 2 to see how much loss in value on £1000 results from price inflation exceeding earnings inflation. The top row of the table shows the change in nominal income over a year from a cut of 5% to an increase of 7%. Taking price inflation to be 3% over the year, the figures below the percentage change in nominal income show how the real value of income changes.
| Number of years | -5% | -3% | -1% | 0% | +1% | +3% | +5% | +7% |
|---|---|---|---|---|---|---|---|---|
| 1 | £922.33 | £941.75 | £961.17 | £970.87 | £980.58 | £1000.00 | £1019.42 | £1038.84 |
Now try the exercise using your own circumstances. Can you work out how much your gross income has risen (or fallen) in the past year?
Work out the percentage growth (or decline) and look at the relevant column in Table 2. A deduction of 0.6% is applied to get the real value of incomes, since 0.6% is close to the average rate of price inflation in the UK over the past year.
To calculate the exact figure for you, it is necessary to scale your gross income to the benchmark of £1000 in the table. So, for example, if your gross income is £2000 per month you need to double the values of the real incomes shown.
If you’ve been fortunate enough to see your gross income rise by more than the price inflation rate of 3% you can see from Table 2 how much your real income has increased.
Clearly the relationship between the rate of increase in your gross income and the rate of inflation is central to the determination of whether your standard of living is improving or declining.
2.2 Taxation and benefits
Take a look at deductions that are made to income in the UK in the form of Income Tax and National Insurance. Consider the income that comes in the form of state benefits and review the current overhaul of the UK benefits system.
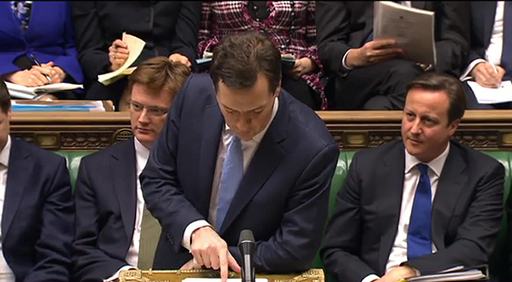
In the video George Osborne, UK Chancellor of the Exchequer, announces his proposals for tax changes to a packed House of Commons.
Transcript
Here we start to look in more detail at the deductions (for Income Tax and National Insurance in the UK) and additions (through benefit payments) that take us from gross to net income. (Note that for some people another possible deduction from gross income is contributions to their pension scheme: these schemes are discussed later in the course.)
Income Tax is levied on almost all types of income, including paid employment. When it is collected via an employer it is often referred to as a ‘pay as you earn’ (PAYE) tax. Income Tax is paid on income received within a given tax year, from 6 April of one year to 5 April of the following year. Income Tax is the single largest source of government revenue. In 2016/17, Her Majesty’s Revenue & Customs (HMRC), the government department responsible for collecting taxes, collected £176 billion in Income Tax – close to a third of all government receipts (ONS, 2017).
In the UK Income Tax system most people receive an ‘allowance’ of income that can be earned before Income Tax has to be paid. This ‘personal allowance’ is £11,850 in 2018/19. The allowance is higher for certain groups of people, such as those who are registered blind. The personal allowance has an income limit of £100,000. Above this limit the allowance tapers away.
Income above the personal allowance is then subject to tax at three different standard rates in English, Wales and Northern Ireland (Gov.UK, 2018):
- in 2018/19 the first £34,500 (after the basic allowance has been taken into account) is taxed at 20%
- above this figure and up to £150,000 of taxable income, the rate is 40%
- there is an additional rate of 45% on taxable incomes over £150,000.
Since 1999 Scotland has had some discretion over its income tax rates. These powers were extended in 2016 and 2017 giving the Scottish Parliament full discretion over the income tax rates and bands applied to non-savings income. Discretion over income tax is also planned to be extended to Wales and Northern Ireland.
Using its discretion the Scottish Parliament approved the following income tax rates and bands for 2018/19 (BBC, 2017).
| Income Band | Name of Band | Tax Rate |
|---|---|---|
| £0 - £11,850 (personal allowance) | Personal Allowance | 0% |
| £11,851 - £13,850 | Starter Rate | 19% |
| £13,851 - £24,000 | Basic Rate | 20% |
| £24,001 - £44,273 | Intermediate Rate | 21% |
| £44,274 - £150,000 | Higher Rate | 41% |
| £150,001 and above | Additional Rate | 46% |
By taxing additional income slices at higher rates, the proportion of tax increases with income. UK Income Tax is an example of progressive taxation, meaning that the proportion of a person’s income paid as tax increases as their income increases. This tax structure therefore helps to reduce income inequalities in the UK.
Next, have a go at using what you’ve learned here to try some calculations for yourself.
2.2.1 Calculating Income Tax
This quiz tests your ability to calculate the Income Tax you should pay on an income.
Activity 2
a.
£5000
b.
£6000
c.
£3000
d.
£1500
The correct answer is c.
c.
Well done. The full computation is as follows:
Income from employment or pension £26,850
Minus personal allowance £11,850
Taxable pay £15,000
Basic rate 20% on £15,000 is £3000
Tax to be paid in the year 2018/19 is therefore £3000
£3000 of tax would be paid.
This is calculated as follows: first, subtract the tax-free amount of £11,850 from £26,850 to give £15,000 of taxable income. The next £15,000 is taxed at 20%. This is £3000.
2.2.2 Setting Income Tax rates
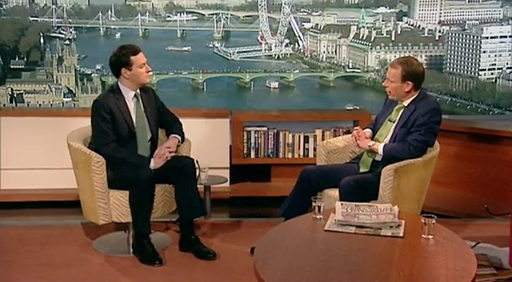
Watch the UK Chancellor of the Exchequer, George Osborne, being interviewed on the BBC by Andrew Marr. This interview took place in 2012 and debates the cut in the additional rate of income tax (on taxable incomes above £150,000 annually) from 50% to the current rate of 45%.
Transcript
The social and economic backdrop to the issues discussed in the interview are important.
First, taxes (together with state benefits which you look at later in this week) represent an example of the interdependence between the individual and the broader social and economic environment in which they live. Taxation funds state benefits, such as state pensions and social security benefits, and pays for public services such as the National Health Service (NHS).
Second, the UK’s tax and state benefits system also has the effect of some redistribution of income – some of the taxes raised collectively are transferred back to individuals and households. Of course, the people receiving benefits will often be different from those paying taxes such as Income Tax, but many people will pay tax and receive benefits at different stages in their life course. The availability of state benefits is also an important part of the way that people cope with unexpected events, which you’ll examine later in the course.
Who should bear the burden?
What factors does the Chancellor of the Exchequer have to take into account when setting Income Tax rates for low-, middle- and high-income earners?
2.2.3 National Insurance
A second important deduction from gross income is National Insurance contributions. National Insurance – which was introduced in 1911 and subsequently expanded, especially in the 1940s – is paid by both employees and employers. Historically, it formed the basis for paying social security benefits related to unemployment, illness and retirement.
The government’s tax and National Insurance receipts fund all benefits as well as other public services and state provision. National Insurance contributions from employers and employees make up the second largest single contribution to UK government receipts, at £124 billion in 2016/17 or approximately 22% of all government receipts (ONS, 2017).
The mechanics of collection are that HMRC issues each person in the UK with a National Insurance account number against which contributions are recorded. The level of contributions influences entitlement to, and in some cases the level of, certain benefits. As with Income Tax, the rules and regulations surrounding National Insurance change regularly. In 2018/19 there is a primary threshold of £8424 per year and an ‘upper earnings limit’ of £46,384. On income between these limits, employees’ National Insurance is generally levied at 12%. Any portion of income above the upper earnings limit is subject to only a 2% levy (Gov.UK, 2018).

2.2.4 State benefits
So far you’ve looked at Income Tax and National Insurance. There are other taxes such as Value Added Tax (VAT), excise duties, Stamp Duty Land Tax and Inheritance Tax – all raising revenue to pay for state benefits and services such as health, education, defence, the transport infrastructure and the police service.
Money raised in taxes goes a substantial way towards paying for the physical and social framework within which citizens live and work. This money, raised and spent collectively, reduces the need for private expenditure that would otherwise be required for health, education and so on.
State benefits represent important components of the welfare state. They have been built up in the UK over the last century or so to provide social protection against various risks such as unemployment, sickness or work injuries, and to ensure that financially poor and marginalised citizens have sufficient income.
One key issue facing governments is a concern that provision of benefits might act as a disincentive for people to seek employment. Related to this is the need to ensure that those on low incomes are not treated unfairly by the tax and benefits system, by making them worse off than those who do not work. One way the UK government has been addressing these issues has been to raise the income threshold at which you start to pay income tax. There have also been two major initiatives since 1997 to address these issues through the structure of state benefits.
The Labour government that came to power in 1997 designed a new form of benefit payment called a ‘tax credit’ to help people move off welfare and into paid employment. These consisted of the Working Tax Credit (WTC) and the Child Tax Credit (CTC), and represented an attempt to integrate the benefits system with the tax system.
The Conservative/Liberal Democrat coalition government elected in 2010 introduced substantial changes to the benefits system. Its strategy was immediately to cut benefits and, in the medium term, replace many work-related benefits with a new benefit called a Universal Credit. Specific measures also included restricting Child Benefit payments to households where neither parent is a higher rate taxpayer, placing a cap on Housing Benefit payments and an overall cap on benefits.
Following trials in North West England, the coalition government’s major overhaul of the benefits system started to be phased in from October 2013, with Universal Credit replacing Income Support, Housing Benefit, Working Tax Credit (WTC) and Child Tax Credit (CTC), as well as the income-related parts of Jobseeker’s Allowance and Employment and Support Allowance. Initially Universal Credit will be paid to new claimants and existing claimants whose circumstances change – for example, if they have another child. Subsequently all other claimants will be transferred, in stages, to Universal Credit with the roll-out of the new benefits system (for both new and existing claimants) now expected to be finalised in 2022. On completion it is anticipated that 12 million working-age claimants will be receiving Universal Credit (BBC, 2013).
Some of these benefits are means tested: they are made only to those who are assessed to have a certain level of income or less, and in some cases a certain level of assets or less.
The government’s objectives are that the new benefits system will be simpler – with a single monthly payment rather than multiple payments to claimants. The new structure is also intended to make work pay by reducing the chance that incomes fall if people move from benefits into low-paid work. Administratively, Universal Credit is planned to be more efficient, with people managing their claims online – although the early trials of Universal Credit were beset with IT problems.
Some households will gain under Universal Credit – particularly those made up of couples with children – while others will lose, particularly couples with no children. Overall the ‘winners’ and ‘losers’ under the new system are widely expected to be approximately equal in number, although this has not stopped critics of Universal Credit claiming that the reform of the benefits system is intended to be a cost-cutting exercise.
Major changes to state benefits were announced in 2015. The key changes, which started to take effect from the 2016/17 tax year included:
- the freezing of working-age benefits for 4 years
- an annual household benefits cap of £20,000 for couples, with or without children living with them (£23,000 in London).
Additionally, from 2017/18 Child Tax Credits and the child element of Universal Credit have been limited to 2 children for children born on or after 6 April 2017. Some exemptions to this rule do apply though, for example in the case of multiple births.

2.2.5 Benefits in transition
In 2018, therefore, the benefits system is in the throes of a major transition. The current system comprises the following benefits. Those in the process of being replaced by Universal Credit are marked by an asterisk.
Jobseeker’s Allowance (JSA) is paid to those available and actively looking for employment. It is split into contribution-based JSA and income-based JSA *.
Income Support * is a means-tested benefit paid to certain groups of people who do not have enough money to live on.
Employment and Support Allowance (ESA) is for people who cannot work because of illness or disability. It is split into contribution-based ESA and income-related ESA * which is a means-tested benefit.
Personal Independence Payment (PIP) is a benefit for people under 65 who have personal care needs or problems with mobility.
Carer’s Allowance is a benefit for people who are giving regular and substantial care to disabled people in their own homes.
Attendance Allowance is a benefit for people with care needs who are over 65.
Child Benefit is a tax-free benefit paid to people with children whose household income falls below a certain amount. (From January 2013, individuals paying a higher rate of tax were excluded from this benefit.)
Pension Credit is a means-tested benefit for people over the minimum state pension age.
Council Tax Reduction is a means-tested benefit provided by local authorities for people on low income to help them pay Council Tax. It has replaced Council Tax Benefit.
Housing Benefit * is a means-tested benefit for people on low income to help them pay their rent.
Prescriptions and dental treatment are either free or subsidised.

2.2.6 Government minister and benefits reform
Listen to Work and Pensions Secretary Iain Duncan Smith speaking to the Today programme presenter James Naughtie (9 December 2013). The interview focuses on the difficulties that are being encountered in rolling out this massive change to the benefits system – a change made even more challenging by problems with the supporting IT systems.
Transcript
In the interview Iain Duncan Smith refers to a figure of £30 billion when talking about benefits fraud. Please note that this figure has not been verified and has been challenged by other commentators.
2.2.7 State benefits – inflation and tapers
Now take a look at two important factors that determine the amount of money people receive from state benefits, and discuss their implications.
Activity 3
First, one of the early changes introduced by the Conservative/Liberal Democrat coalition government after coming to power in 2010 was the shift from increasing the benefits (including Income Tax allowances) in line with the RPI measure of inflation to the CPI measure.
Second, an important element of tax credits and of Universal Credit is that they are means tested on household income. In other words, the amount a household receives from them goes down as household income goes up. The rate at which these benefits are withdrawn as income rises is called tapering. For example, for 2018/19 the taper for Working Tax Credit and Child Tax Credit was set at 41 pence for each additional £1 earned by families beyond an annual household income of £6420 (Gov.UK, 2018).
With Universal Credit a ‘work allowance’ is disregarded and then, in 2018/19, a taper of 63 pence in the £ is applied to the rest.
Consider these two questions.
- Bearing in mind what you have learned about the relationship between CPI and RPI, what impact is the move to raising benefits in line with CPI likely to have?
- Why is a ‘taper’ applied to the removal of benefits as income increases? Why not just deduct £1 of benefit for each additional £1 of extra household income?
Answer
CPI inflation has historically been lower than RPI inflation. The changes are likely to reduce the size of annual increases in benefits.
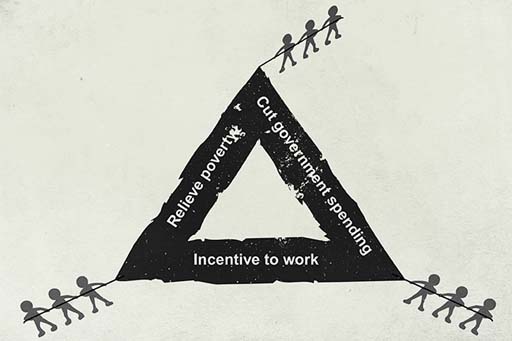
The existence of such a taper demonstrates an important challenge facing policy makers. They wish to make paid employment financially attractive but at some point they also wish to begin to remove benefit payments (in order to contain the cost to government of providing benefits). If they do this too quickly – say, for example, the taper was £1, or even 90 pence or 80 pence in the pound – then many benefit recipients might consider the financial reward for returning to work insufficient. Clearly there are many other positive aspects associated with entering the labour market, such as making a worthwhile contribution to society and improving your skills. But from a purely financial perspective paid employment with a high taper may not appear too appealing. Economists have described such a situation as the ‘poverty trap’, where a high taper represents a disincentive to enter the labour market.
2.3 Managing your budget
You’ve seen that households can receive income from a number of different sources. You know that assessing your position is always an important first step in financial planning, and assessing income is often one of the most important factors in financial decision making. One tool that can be used to do this is the budget.
To draw up a budget you start by looking at your cash flows. This involves measuring inflows and outflows of money on a regular basis. In the remainder of this week, you concentrate on inflows. The spending side – outflows – of the budget statement is covered next week.
There are four issues to be considered in measuring the income side of a budget. You’ll soon start to do this in practice.
First, the statement should record inflows of income in the relevant time period, such as a month or a week. For most people this will represent their net income: payers of standard rate Income Tax whose income consists of pay will already have been taxed via PAYE, and National Insurance contributions (and, for people in occupational pension schemes, pension contributions) will have been paid. Self-employed people, by contrast, are not taxed via PAYE. They will need to set aside the sums due for tax payments on their gross earnings. These sums are normally made in two payments to HMRC in January and July each year. However, some people will receive at least some income paid gross, such as some investment returns or state benefits. In this case the gross income should be recorded, but it must be remembered that there may be tax still due on this income at the end of the tax year, and tax payments may be an expense that will need to be factored into the budgeting process.
Second, it is important to include all the different sources of income, such as income from paid employment, self-employment, savings and investments, pensions and social security benefits. Any additional income is recorded under the ‘other’ category.
Third, it is important to take account of how frequently different types of income are received. For instance, a household may receive a combination of weekly benefits and monthly pay. In order to standardise these different frequencies of income for a monthly budget, the technique is to calculate an equivalent annual income first (for example, by multiplying a weekly income by 52) and then estimate a monthly income equivalent by dividing this figure by 12.
Fourth, the income side of the budget can be drawn up at the level of the household or individual. The choice will depend on household composition, but to get an accurate figure of total household income it is necessary to include all income earners.

2.3.1 Your budget – the income side
This is your first opportunity in the course to use a budget planner. The UK government has set up an independent service called the Money Advice Service (MAS) which offers a set of excellent financial planners and calculators. You’ll be using a number of MAS planners and calculators, so why don’t you register for free with MAS now? Once you’ve registered you’ll also be able to save your workings and come back to them later.
The MAS budget planner is presented in two formats – a simple version and a version with more detail. Both are easy to use and self-explanatory. Go to the MAS budget planner in a new window or tab and choose the version with which you feel most comfortable.
Now complete the income part in the budget planner for your household.
If you’re in a one-person household, this means completing it for just yourself.
If you’re in a multi-person household, the normal assumption would be that the income of other household members would be recorded. However, if this is not possible, simply complete using your own income.
When you’ve done this go to your fact find and fill in the income side of your budget – the first five rows. Use the current month’s figures to fill in the column ‘Cash flow £ per month’. In the second column – ‘Average month £ per month’ you may want to adjust these figures if the current month is not a representation of what you get on average in a month. For people receiving salaries, there’s typically no difference but for those who are self-employed there can be wide variations in what is earned from month to month.
Don’t put in expenditure figures in at this stage – you’ll be looking at expenditure next week.
Once you’ve done this, move on to the test for this week.

Week 2 quiz
This quiz allows you to test and apply your knowledge of the material in Week 2.
Complete the Week 2 quiz now.
Open the quiz in a new window or tab then come back here when you're done.
Week 2 round-up
In Week 2 you’ve looked at the various ways income comes into households – either in the form of earnings from work or as state benefits.
You’ve learned about inflation and how it impacts on household finances, and you’ve seen the ways that incomes are taxed.
You’ve also examined the changing structure of UK state benefits.
Finally you’ve had some practical experience of drawing up an income side of a budget.
The next week turns to the other side of a household’s budget – expenditure.
You can now go to Week 3: Expenditure and budgeting
References
Acknowledgements
This unit was written by Martin Upton and Jonquil Lowe.
Except for third party materials and otherwise stated in the acknowledgements section, this content is made available under a Creative Commons Attribution-NonCommercial-ShareAlike 4.0 Licence.
The material acknowledged below is Proprietary and used under licence (not subject to Creative Commons Licence). Grateful acknowledgement is made to the following sources for permission to reproduce material in this unit:
Unit image
Figures
Figure 1 © The Open University/iStockphoto.com/kvkirillov/antagain/stocknshares/PhilipCacka/sorendls
Figure 2 © iStockphoto.com/1amgreen
Figure 5 © iStockphoto.com/Westend61
Figure 8 unknown source
AV
Taxing income © Contains Parliamentary information licensed under the Open Parliament Licence v1.0 http://www.parliament.uk/ site-information/ copyright/ open-parliament-licence/
Setting Income Tax rates © BBC
Government minister and benefits reform © BBC
Every effort has been made to contact copyright owners. If any have been inadvertently overlooked, the publishers will be pleased to make the necessary arrangements at the first opportunity.
You can now go to Week 3: Expenditure and budgeting
Don't miss out:
1. Join over 200,000 students, currently studying with The Open University – http://www.open.ac.uk/ choose/ ou/ open-content
2. Enjoyed this? Find out more about this topic or browse all our free course materials on OpenLearn – http://www.open.edu/ openlearn/
3. Outside the UK? We have students in over a hundred countries studying online qualifications – http://www.openuniversity.edu/ – including an MBA at our triple accredited Business School.