Week 5: Investing for retirement – planning your pension
Use 'Print preview' to check the number of pages and printer settings.
Print functionality varies between browsers.
Printable page generated Saturday, 6 June 2026, 9:52 AM
Week 5: Investing for retirement – planning your pension
Introduction
Watch the following video to hear Martin introduce Week 5 of Managing my investments. This week covers the crucial subject of pension planning.

Transcript
Making provision for your income in retirement is a critical aspect of your overall investment strategy. It requires long term forecasting of your income needs in retirement and the returns from your pension products intended meet those income needs. Given the recent liberalisation of pension rules in the UK, there are now more options for using the ‘pension pots’ built up ahead of retirement. While this has been generally welcomed, this liberalisation has created uncertainty about the best options to utilise the money built up for retirement.
When planning for income in retirement, it is clearly essential to take into account the state pension you may be entitled to. When you have forecast your state pension, you will have a clearer idea about how much income your own pension plans (e.g. occupational pension or personal pension) will need to generate to provide the total income you need in retirement. In the UK, state pension arrangements are going through a period of transition with the state pension age being pushed back and with the roll out, from 2016, of the new ‘flat-rate’ state pension.
There’s a lot to examine this week, particularly given the concurrent changes to the pensions landscape. But the effort will be worthwhile, since you will gain greater clarity about what you need to do now to ensure a comfortable retirement in the future.
5.1 Investing for a pension
A central and vital part of investment activity relates to investing in pension schemes to produce an income stream in retirement. How does the UK fare when it comes to this vital activity?
Table 5.1 sets out the percentages of adults in the UK who were active members of pension schemes in 2016–18. The data, compiled by the Office for National Statistics (ONS), does not provide an overall picture, since the numbers will not include those who were members of schemes but have deferred receipt of pension benefits. The data also excludes those who have retired already and who are drawing pension income. Additionally the data does not reflect those that are simply investing in assets outside a formal pension scheme to provide for their retirement.
| Scheme | Males | Females |
|---|---|---|
| Occupational defined benefit (1) | 24% | 28% |
| Occupational defined contribution (1) | 26% | 20% |
| Personal pension (1) | 10% | 6% |
| Total in pension scheme(s) (2) | 56% | 50% |
Footnotes
(1) The differences between defined benefit and defined contribution schemes are explained in the coming sections. Personal pensions are explored too.Footnotes
(2) The total for each gender is higher than the sum of the different types of pension schemes are some adults were in more than one scheme.Notwithstanding these limitations, the data points to a worrying conclusion – that a significant proportion of adults are not making their own provisions for retirement and may, as a consequence, become entirely reliant on their state pension when they do retire. The situation was little changed by 2021/22 with the participation in pension schemes amongst working-age adults being 55% for males and 52% for females (DWP, 2023).’
On a more positive note the percentage of adults – both male and female – participating in a pension scheme has been growing in recent years. One reason for this has been the introduction of automatic enrolment onto ‘workplace’ pension schemes that was rolled-out in stages in the UK in the 2010s.
5.1.1 How much do you need?
In Week 3, you looked at the process of forecasting the size of the pension you need in retirement, using the Age UK pension planning tool. Even if you accessed the tool in Week 3, you might want to try it again here as the starting point for your pension plan.
In doing so, you need to take into account how your spending needs in retirement may vary from those during your working life. These differences could include:
- lower day-to-day travelling costs as you will not be commuting to work
- savings on work-related costs such as National Insurance Contributions (NICs) and pension contributions (NICs are not deducted from pension income)
- higher holiday costs given the greater spare time you will have
- higher utility bills given the longer time you will be spending at home
- possibly, later in retirement, more spending on health-related items
- savings on a range of items due to the ability to take advantage of ‘off-peak’ pricing
- possibly lower housing costs since, by retirement, most homeowners would have completed paying off their mortgage.
To help your analysis of the pension income you need, watch the video where Martin and his Open University colleague, Jonquil Lowe, talk about how to start pension planning.
The video was filmed in 2015. However, the issues explored remain relevant to retirement planning.
Transcript
Once you have completed this section, you should be building up a picture of the income needed in retirement. The next section is to determine how much of this you anticipate to receive through your state pension entitlement.
5.1.2 State pensions
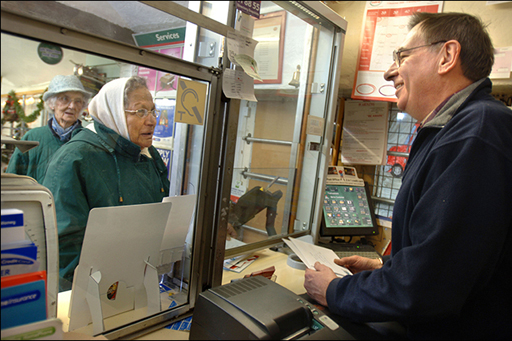
We now turn to a particular and very important way that we can invest in funds: pension products. But before we look at the products we can enter into, it is important to understand how much we will get from the state pension scheme. Clearly, the greater the financial support availed by state pensions, the less we need to ensure that we provide pension income ourselves through building up a pension fund ahead of retirement.
Limited state retirement pensions were first paid in the UK in 1908. These were improved by the 1946 National Insurance Act which brought in flat-rate universal state pensions (with effect from 1948).
While various developments in state pensions have taken place since then, the main thrust of policy in recent years has been to limit public expenditure on state pensions.
The UK government has planned staged rises in the age at which people can receive their state pension, to reach 68 years in the mid-2030s, with further increases likely. Many predict that the state pension age will eventually rise to 70 years. One aim of these moves is that, on average, no more than a third of adult life should be spent in retirement. So, the longer the population lives on average, the higher will be the state pension age.
There are actually two state pension schemes in place in the UK. The ‘old’ scheme for those who reached state pension age before April 2016 and the so-called flat-rate pension scheme for those reaching state pension age from April 2016 onwards.
The ‘old’ scheme has two parts. The first part is the basic state pension which amounted to £156.20 per week for a single person in 2023/24. This amounted to circa 25% of average full-time earnings in 2023 compared with 28% in 1980. The reason for the decrease was that during the period from 1980 to 2011 state pensions were normally increased in accordance with the rate of price inflation which tended to be lower than earnings inflation.
However, from 2011 onwards, the basic state pension has increased each year with the higher of either earnings inflation, consumer price inflation or 2.5%. This is known as the ‘triple-lock’ – an arrangement that is proving to be politically controversial. Whilst this ‘triple-lock’ remains in place the basic pension should retain its value relative to earnings (or even rise a little faster).
Entitlement to the basic state pension depends on paying, or being credited with, National Insurance contributions (paid by employees and the self-employed) during working life. Credits are given for certain periods out of work, such as being ill, unemployed or caring for children.
People reaching state pension age before 6 April 2010 needed to have National Insurance covering roughly nine-tenths of their working life to get the full basic state pension. For people reaching state pension age on or after 6 April 2010, the required contribution record was reduced to 30 years – although this rose to 35 years from April 2016.
A shorter record means a reduced pension – although from April 2016 a minimum number of 10 years for those reaching state pension age has become required to get any state pension.
Wives – and, since April 2010, husbands and registered civil partners – can claim a basic pension of up to £93.60 (in 2023/24) based on their spouse’s or partner’s record if their own basic pension would come to less than this. From 2016 this stopped for those new to reaching state pension age.
The second part of the state pension – the additional state pension (or state second pension) – is restricted mainly to employees. It was first introduced in 1978, when it was called the State Earnings Related Pension Scheme (SERPS).
Whilst this additional state pension can materially add to the basic state pension large numbers do not benefit from it. Many people have been ‘contracted out’ of the state additional pension, which means that this part of their state pension has been replaced by a workplace or personal pension scheme in return for reduced or refunded National Insurance Contributions.
5.1.3 The new flat-rate state pension
From April 2016, for those new to attaining the state pension age (SPA) the state basic and additional pensions have been replaced by a single flat-rate pension (for 2023/24 of £203.85 per week).
For 2023/24, the UK government’s assessment of the minimum weekly income required by pensioners was £201.05 for a single person and £306.85 for a couple (whether married or not) (Age UK, 2023).
This contrasts with the situation in the mid-1980s, when the basic state pension was about the same as the minimum level of income that was deemed enough for a single householder to live on. Therefore, anyone relying solely on the basic state pension is now also eligible to claim a means-tested top-up.
Such means-tested retirement benefits can discourage saving for retirement because building up a small private pension simply reduces the amount of benefits that can be claimed. The change to a flat-rate pension from April 2016 was intended to ensure that the state pension no longer falls short of the minimum income required. As a result, far fewer pensioners will need to claim means-tested benefits and there will be no disincentive to saving for retirement.
The rules relating to UK state pensions, the new flat-rate state pension and the impact on both of our record of National Insurance Contributions (NICs) are quite complex. To help you through the maze, watch this video, in which Martin and his Open University colleague, Jonquil Lowe, talk about UK state pensions and the 2016 changes.
The video was filmed in 2015. However, the issues explored remain relevant to retirement planning.
Transcript
[LAUGHTER]
5.1.4 Understanding the new flat-rate pension
The new flat-rate pension began to be paid to those reaching state pension age from April 2016.
How much is this worth? How many years of National Insurance contributions do you need to receive it? What happens if you haven’t paid enough in contributions?
Work through the sums in this video and see what’s likely to be the overall effect on people’s saving habits.
The video was produced in 2015. However, the issues explored remain relevant to retirement planning.

Transcript
This ends our coverage of state pensions. You now move on to how we can supplement the retirement income we get from the state, with pension products such as occupational and other workplace pensions.
5.2 Occupational pensions

Occupational pension schemes are set up by employers for their employees. They typically provide a package of benefits:
- a retirement pension for the employee payable from the scheme’s normal pension age (often 65) or later
- a tax-free lump sum for the employee at retirement
- a pension payable if the employee has to retire early due to ill health
- pensions for a widow, widower, registered civil partner and dependent children if the employee dies either before or after retirement – most schemes also pay such a pension to an unmarried partner
- lump sum life insurance if the employee dies before retirement.
There are generally two types of occupational pension scheme: defined contribution schemes (also called money purchase schemes) and defined benefit schemes.
Defined contribution schemes
Defined contribution schemes invest contributions from the employer, and normally the employee as well, to build up a pension pot for the employee. Personal pensions also work on this basis (more about this later in the week). The key features to note are that employees don’t know in advance how much pension they might receive, and the pension is directly affected by factors such as the value of investments rising and falling with the stock market.
Defined benefit schemes
By contrast, a defined benefit scheme promises to pay a specified pension at retirement (often, but not necessarily, linked to the employee’s pay while working). In a defined benefit scheme, the yearly pension is commonly worked out according to a formula, for example:
Yearly pension = accrual rate × number of years in scheme × salary
The accrual rate is a fraction, typically 1/60th or 1/80th. How ‘salary’ is defined depends on the type of scheme and its rules. For instance, the salary that counts towards the pension might be less than the total salary the employee gets. In a ‘final salary scheme’, salary would mean pay just before retirement (or pay at the time of leaving if the person leaves before reaching retirement).
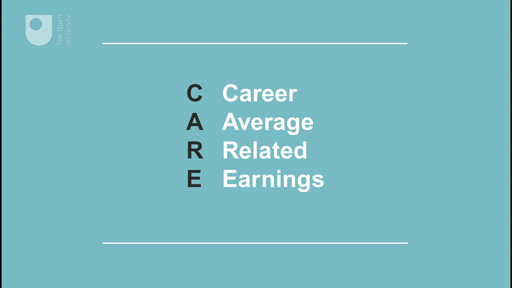
Increasingly, defined benefit schemes are shifting to a ‘career average revalued earnings’ (CARE) basis. This means the pension is based on average pay over all the years in the scheme, after adjusting each year’s pay for inflation between the time it was earned and the person retiring or leaving the scheme. Note, though, that the exact impact of the move to a CARE scheme will depend on the specific rules relating to the scheme.
Whatever the definition of salary, this type of formula works in basically the same way. For example, a person earning £36,000 a year and retiring after thirty years in a 1/60th scheme would receive a pension of 1/60th × 30 × £36,000 = £18,000 a year.
The pension from a defined benefit scheme is usually increased each year in line with price inflation. Historically, this was measured by the RPI but in 2010 the government announced that pensions for retired public sector workers would rise in line with the (typically lower) CPI. The pension from an occupational defined contribution scheme was covered by similar rules but, since April 2005, the retiring employee can usually choose whether or not the pension will be increased each year.
The key point is that the level of pension promised does not directly depend on factors such as stock market performance. For example, while a slump in stock markets is likely to push up the cost to the employer of funding the promised pension, the employee’s promised pension would be unchanged.
Nonetheless, indirectly, the employee could be affected if the increasing cost to employers of providing this type of pension results in the employer closing or changing the pension scheme or, worse still, going out of business, leaving the pension pot with too little in it to pay the promised pensions.
Recent developments
In recent years, there’s been a marked decline in the number of employees who belong to defined benefit schemes. This shift has affected employees in the private sector: by 2018, there were over nine times as many active members of defined contribution schemes as there were of defined benefit schemes (ONS, 2019b).
Where defined benefit pensions continue for existing members, in many cases the pension formula has been changed to promise less generous pensions in future. New employees are typically offered membership of defined contribution schemes instead.
For the employer, defined contribution schemes are less risky than defined benefit schemes because the employer promises only to pay specified contributions – a predictable, stable cost to the employer’s business.
Defined contribution schemes are also less costly because most employers pay far less into this type of scheme than they would into a defined benefit scheme. In 2018, the average employer contribution to private defined benefit schemes was 19.2% of an employee’s pay, compared with just 2.4% for a defined contribution scheme (ONS, 2019b). What this means, of course, is a reduction in the money going into an individual’s pension pot, which will tend to reduce the resulting pension. Indeed, in 2023/24 the minimum required employers’ contribution into their employees’ workplace pensions was a lowly 3% of pay.
5.2.1 Workplace pensions

A major development in pensions occurred in 2012, with the commencement of the government’s ‘automatic enrolment’ scheme for pensions. From October 2012, employers started being required both to offer a workplace pension scheme to their employees and to automatically enrol them onto the scheme.
Workplace pensions can take various forms, such as the defined benefit and defined contribution occupational schemes you looked at earlier. They can also be in the form of personal pension plans, which you’ll look at later this week.
Large employers were the first to undertake this new approach to pension planning in the workplace. By 2018, all employers were automatically enrolling their eligible employees into a workplace pension scheme.
If employees do not want to be enrolled in the pension scheme offered by their employers they have to take action to opt out. So the prospect is that, for many, inertia will result in them becoming, and remaining, enrolled in a workplace pension scheme.
Automatic enrolment is an important initiative to get people to contribute to a pension plan, although some criticisms have been voiced about the scale of the fees levied on those enrolled onto schemes.
5.2.2 Workplace pensions: NEST
In 2014, the UK government announced plenty of policy initiatives for pensions. One came with the announcement that, from 2017, those in state-backed workplace pension schemes, like the ones examined in the previous section, would have greater scope to invest in the NEST (National Employment Savings Trust) pension scheme.
NEST is the public organisation set up by the Pensions Act 2008 to offer pension products for employers offering workplace auto-enrolment schemes.
NEST started to take on pension fund members from 2012, when auto-enrolment into workplace pensions started to be offered by the larger employers in the UK. Under this scheme employees have to take action to opt-out of a workplace pension if they wish to avoid auto-enrolment. By 2019, 7.9 million workplace pension savers were invested in the NEST pension scheme (NEST, 2019).
5.2.3 Personal pensions
Personal pensions and defined contribution occupational schemes are examples of defined contribution schemes, and all work in essentially the same way. The pension depends on:
- the amount paid in, which is invested in a pension pot
- how much the invested pension pot increases in value
- how much is taken out of the pension pot in charges
- how much the saver decides to draw out as a cash lump sum at retirement
- how much pension the remaining pot can buy at retirement (most commonly the pot is used to buy an annuity, but an alternative is income drawdown).
Anyone can have a personal pension and anyone can pay into a personal pension for someone else – so the main earner in a couple could pay into a plan for a partner who has a caring role.
Personal pensions (unlike occupational defined contribution schemes) do not necessarily offer a package of benefits. It‘s up to the individual to choose whether to buy extra benefits, such as life cover, a pension for a partner or increases to the pension once it starts to be paid.
Personal pensions and occupational defined contribution schemes expose the individual to a variety of risks. To understand these risks, put yourself into the position of someone who is currently many years from retirement, and who has to organise their own pension scheme to provide themselves with retirement income.
How much should you pay into the scheme? It’s important to get this decision right because if you pay in too little, your pension will be too small. Pay in too much, and you could limit your current spending and standard of living, but you can’t be certain of the correct amount. The eventual cost of the pension will depend on these factors:
- Investment returns: as you have seen earlier in the course, when investing for the long term – and pension savings are very long term – stock market investments, like shares and bonds, are likely to be most suitable. It’s impossible to know in advance how well these investments will perform. If, in planning for retirement, you assume they will perform well, you don’t need to invest too much. If your assumption is wrong and the investments turn out badly, you’ll have too little in your pot to provide the pension you wanted. What counts here is the investment return after all the charges have been deducted. An investment fund that offers the chance of higher returns but has high charges might be a poor choice compared with a less ambitious investment fund with modest charges.
- Inflation: Rising prices reduces the buying power of money. To protect against this, you would need to invest extra money to compensate for the effect of inflation, both over the years when the savings are building up and once the pension starts. But you’ll also have to estimate what rate of inflation to guard against. If your estimate is too low, in real terms you’ll have a smaller pension than planned.
- Longevity: the aim is that the pension, when it starts, will provide a regular income, usually paid monthly, until your death. The longer you live, the more months of pension that have to be paid out, and the greater the total cost of the pension. In deciding how much to save, you need to make an assumption about how long you will live or the cost of insuring against living ‘too long’. If your assumption is wrong, either the money will run out before you die or you’ll have saved more than you needed to.
Therefore, defined contribution schemes, including personal pensions, lead to individuals shouldering the risks up to the time when the pension starts. This means that different people saving the same amount can receive very different pensions, and a person’s pension can be markedly different depending on when they retire.
On reaching retirement, you can protect yourself from further longevity risk by buying an annuity that will provide an income for the whole of your remaining life, however long you live. In effect, this is insurance against living for longer than your pension pot would otherwise last. However, the annuity provider will take a slice of the pension pot in charges before what remains is turned into income.
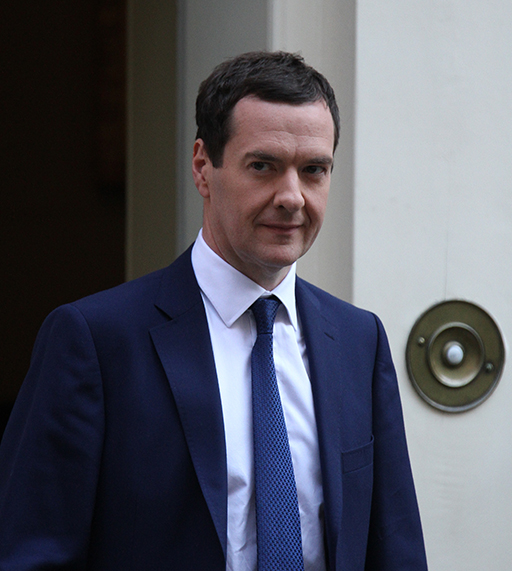
A revolution to defined contribution schemes, however, was presaged in the 2014 budget statement by the Chancellor George Osborne. From April 2015, those retiring have had access to a wider range of alternatives to buying an annuity with their pension ‘pots’.
Additionally, those aged 55 and over can cash in all or part of their pension savings prior to retirement, with 25% of each lump sum drawn out being tax free. After retirement, withdrawals will be taxed as income. So those approaching retirement now have greater flexibility to choose where to invest their pension savings to provide for an income in the future or other purposes.
5.3 Calculating pension income
Learn how to work out amounts of pension at retirement under defined benefit schemes in this video.

Transcript
Activity 5.1 Moving to average salary pensions
Before 2015, most employees in the public sector were still in a defined benefits pension scheme, with the promised pension based on final salary. From 2015, their future benefits will instead be based on a career-average structure (GOV.UK, 2014).
How do you think such a switch could help to reduce the cost to the government of providing pensions?
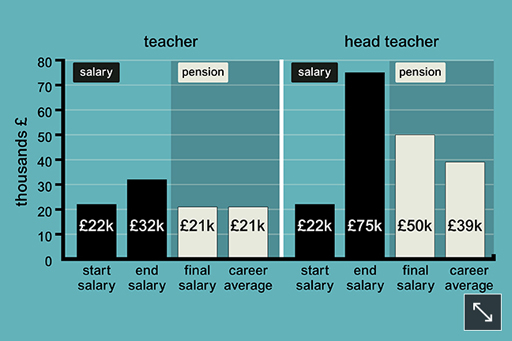
Which workers might gain and which might lose from such a switch? To help you identify winners and losers, take an establish profession, such as teaching, as an example.
5.3.1 Understanding career average pension schemes
In the previous section, you looked at the move by some defined benefit pension schemes to base the pension paid on career average earnings rather than the final annual salary prior to retirement.
The following audio animation shows how these ‘Career Average Revalued Earnings’ or ‘CARE’ schemes work, using the UK’s National Health Service (NHS) CARE scheme as a case study.
Transcript
5.3.2 Funded and pay-as-you-go pensions
| Pension scheme | Organised by | Basis on which pensions are provided | How pensions are financed | Who pays? |
|---|---|---|---|---|
| State scheme: basic | State | Defined benefit | Pay as you go | State provision |
| State scheme: additional pension | State | Defined benefit | Pay as you go | State provision |
| Occupational scheme: final salary | Some pubic sector employers Private sector and some public sector schemes |
Defined benefit Defined benefit |
Pay as you go Funded scheme |
State provision, usually employee too Footnotes 1 Employer, usually employee too Footnotes 1 |
| Occupational scheme and NEST Footnotes 2:defined contribution | Private sector employers | Defined contribution | Funded scheme | Employer, usually employee too1,3 |
| Personal pension | Individual | Defined contribution | Funded scheme | Individual (employer occasionally) Footnotes 1 |
Footnotes
Footnotes 1Tax relief on contributions and on the return from pension fund investments means the State also pays towards the cost of occupational and private pensions. However, some of this tax relief is clawed back once pensions start to be paid because pension income is taxable.Footnotes
Footnotes 2National Employment Savings Trust.In the previous sections you might have worked out that average salary pensions would be cheaper to provide than final salary schemes if, even after adjusting for inflation, a worker’s average pay over many years was lower than their pay just before retirement.
Workers whose pay tends to peak in mid-career might gain from a switch, whereas workers whose pay tends to peak towards the end of their career would lose out. So, in the example of teachers, a person who reached the position of head teacher would lose out in relative terms from this change.
Pensions in a nutshell
With most occupational schemes and all personal pensions, money is paid into the scheme to create a pension pot – a pool of investments. These are called funded schemes. Employers pay into occupational schemes and usually require employees to contribute too. With other types of scheme, individuals often fund the whole scheme.
In most large, occupational defined benefit schemes, experts are appointed to manage the investments, and pensions are paid directly from the fund as they fall due. With defined contribution arrangements, an insurance company often looks after the investments, and the pensions are typically paid by taking money out of the fund to buy annuities.
By contrast, state pensions are pay-as-you-go (PAYG) schemes. There is no pension pot. Instead, the pensions paid out today are financed from National Insurance and other tax revenues collected today. Sometimes this is referred to as a ‘contract between the generations’, with today’s taxpayers paying for today’s pensions on the understanding that when they retire, their pensions will be paid for by the taxpayers of the future.
Some public sector occupational schemes (covering, for example, civil servants, teachers, NHS workers and the Armed Forces) are also financed on a PAYG basis, with employees’ contributions and general tax revenues used to pay the pensions of many retired public service workers. In contrast, the schemes for local authority employees and university lecturers in some universities are funded schemes.
5.3.3 Take control

We have now looked at state pensions and the various forms of non-state pensions that collectively can provide your income in retirement. Take some time now to check your entitlements to pensions using the information provided in the previous sections and the most recent statements provided by your pension provider(s).
Activity 5.2 Assess your position
Now return to the Age UK pension calculator to assess your position and see whether or not you’re on course to get the income you need to afford the lifestyle you want.
Whatever the result, consider your thoughts on ways to take control of your future.
In the coming sections, you’ll hear how the pensions landscape in the UK is changing following the liberalisation of rules relating to access to ‘pension pots’ that took effect from April 2015.
5.4 The 2015 pensions revolution: freeing up access to pension pots
In his 2014 Budget Statement the then-Chancellor, George Osborne, unveiled proposals for pensions reform which have changed the financial options for those approaching retirement. These proposals took effect from April 2015 and have led to restrictions on access to pension pots being eased.
These are the key features of the pensions revolution:
The 2014 Taxation of Pensions Act provides greater freedom for those in ‘defined contribution’ schemes aged 55 years or more to access their personal pension funds (or ‘pots’). Basically, you now have many more options:
- Those retiring with defined contribution pensions now have alternatives to buying an annuity with their pension savings, though they can still do just that. On retirement, up to 25% of the fund can be taken as a tax-free lump sum (as previously applied prior to 2015) but you can still buy an annuity with the rest.
- What is new is that you can access the funds as cash to do what you want with, say, to invest in a range of assets (such as property) or to pay off a mortgage or other debts, or simply to finance current consumption. 25% of the funds accessed from the fund is tax-free. The rest is taxable as income and so could currently attract tax of up to 45% (for taxable income above £150,000).
- You can simply leave the money invested and draw down at a later date.
- There is also greater flexibility to pass on a pension to dependents after death. For those who die prior to the age of 75, income from pension assets can be passed on to beneficiaries tax-free provided this is done within two years of death. This tax treatment previously only applied to lump sums from a pension ‘pot’. For those who die aged 75 or over, normal income tax rates apply. Arguably, this reform removes an unfair excess tax charge on pension pots for which the deceased have spent their lives contributing to. An alternative view is that it provides a way to avoid inheritance tax, with those in retirement drawing on savings and other investments while leaving their pension funds untouched.
One key thing to remember whatever option is chosen is that pension income – including state pension – is liable to income tax. The good news, though, is that National Insurance Contributions (NICs) are not payable.
While the greater flexibility that these reforms provide for pensioners should be welcomed, a few concerns cannot go unmentioned.
First, one motivation for these greater freedoms seems, in part, to be the belief that annuities are poor value and, by inference, that other ways of investing pension funds may be better for pensioners. Yet while there have clearly been issues about how some insurance companies have sold annuity products, it is unfair to say that they are all poor value. The low annuity rates prevailing today simply reflect growing longevity and the currently prevailing low interest rates. Currently (in 2020) – and depending on the features of the product – an annuity of between £4000 and £5000 per annum is paid at 65 years of age for each £100,000 in a defined contribution pension fund. These figures apply to a single person. For a dual-life annuity (i.e. for a couple) annuities are less than £4000 per £100,000 of a pension fund.
Second, there are concerns that many pensioners will spend large portions of their pension pot and not invest the funds to provide the income stream needed in retirement. The risk is that within a few years, some pensioners will find themselves short of the income needed for a comfortable retirement.
Finally, there is a concern that the pensions industry is not resourced to deal with the advice required as a result of these wider freedoms now available to pensioners and those moving towards retirement.
5.4.1 Learning from the Dutch: collective defined contribution schemes

A further reform of pensions was announced in the Queen’s Speech in November 2014.
This proposed the introduction of ‘collective defined contribution’ (CDC) pension schemes. These have worked successfully in the Netherlands and involve workers pooling their pension contributions with thousands of others rather than just paying into their own pension fund. The rationale is that the greater collective size of a CDC fund would allow for a wider diversification of investments and a greater ability to manage investment risk, hence achieving more stable outcomes. The costs of running a fund would be proportionately less than for an individual pension pot, thereby also helping to boost the returns achieved.
Evidence from the Netherlands shows CDC schemes outperforming the average returns seen on conventional defined contribution schemes, with those retiring on a CDC scheme receiving on average 28% of their salary, as opposed to 21% on average from defined contribution schemes.
In April 2023 The Pensions Regulator authorised the first CDC scheme in the UK – the Royal Mail Collective Pension Plan. More schemes are expected to follow.
5.4.2 The challenges of the pension revolution
To round off our examination of pensions and the current pensions revolution in the UK, watch this video of Martin Upton and Jonquil Lowe answering questions posed by learners. The areas covered include issues about pensions schemes and the new freedoms that those retiring now have in making their pension arrangements.
The video was filmed in 2015. However, the issues explored remain relevant to retirement planning.
Transcript
5.5 Week 5 quiz
Check what you’ve learned this week by taking the end-of-week quiz.
Open the quiz in a new window or tab then come back here when you’re done.
Week 5 round-up
This week, you have explored the pensions landscape – focusing on the types of pension schemes in the UK. You’ve also examined the various pension products that can be used to augment the state pension.
You have also looked at how pension planning involves a careful forecast of your spending in retirement – essential expenditures but also aspirational spending – since, ideally, life in retirement should be more than just ‘getting by’ through spending on essentials only. Remember, with growing longevity, pensions planning is the most serious investment activity you are likely to engage with.
If you want to learn more about retirement planning why not try this free short course produced by The Open University in collaboration with the financial services firm Legal & General in 2020: Retirement planning made easy. The course takes around three hours study time.
Don’t forget to continue with Activity 2.4 and check the prices for the selected companies once a week and enter their level in the Market shares tracking worksheet. Remember, you can follow these shares using the BBC Market Data tool, or by picking up a newspaper which focuses on financial markets.
Next week, you’ll complete Managing my investments by focusing on how behavioural factors influence investment decision-making, sometimes with adverse consequences.
You can now go to Week 6.
Images
This free course was written by Martin Upton.
Except for third party materials and otherwise stated in the acknowledgements section, this content is made available under a Creative Commons Attribution-NonCommercial-ShareAlike 4.0 Licence .
The material acknowledged below is Proprietary and used under licence (not subject to Creative Commons Licence). Grateful acknowledgement is made to the following sources for permission to reproduce material in this unit:
Figure 1 © Adrian Sherratt via Alamy Images
Figure 2 Figure 5: vgajic/Getty Images
Figure 3 © Brasil2 via iStockphoto.com
Figure 9 © Twocoms/Shutterstock.com
5.1.1 © The Open University
5.4.2 © The Open University
Every effort has been made to contact copyright owners. If any have been inadvertently overlooked, the publishers will be pleased to make the necessary arrangements at the first opportunity.
Don't miss out:
1. Join over 200,000 students, currently studying with The Open University – http://www.open.ac.uk/ choose/ ou/ open-content
2. Enjoyed this? Find out more about this topic or browse all our free course materials on OpenLearn – http://www.open.edu/ openlearn/
3. Outside the UK? We have students in over a hundred countries studying online qualifications – http://www.openuniversity.edu/ – including an MBA at our triple accredited Business School.
References
Age UK (2023) Pension Credit, Factsheet 43, April 2023 [online] Available at https://www.ageuk.org.uk/ globalassets/ age-uk/ documents/ factsheets/ fs48_pension_credit_fcs.pdf (Accessed 12 October 2023)
Department for Work and Pensions (2014) Family Resources Survey [Online]. Available at www.gov.uk/government/uploads/system/uploads/attachment_data/file/325491/family-resources-survey-statistics-2012-2013.pdf (Accessed 10 December 2014).
Department for Work and Pensions (DWP) (2023) Family Resources Survey: financial year 2021 to 2022, Table 6.1 [online] Available at https://www.gov.uk/ government/ collections/ family-resources-survey--2 (Accessed 12 October 2023)
NEST (2019) ‘Nest celebrates growth of pension scheme’ [online], https://www.nestpensions.org.uk/schemeweb/nest/nestcorporation/news-press-and-policy/press-releases/Nest-celebrates-growth-of-pension-scheme.html (Accessed 14 December 2020)
Office for National Statistics (ONS) (2017) ‘Occupational Pension Schemes Survey UK, 2016’ [Online]. Available at https://www.ons.gov.uk/peoplepopulationandcommunity/personalandhouseholdfinances/pensionssavingsandinvestments/bulletins/occupationalpensionschemessurvey/uk2016 (Accessed 30 November 2017).
Office for National Statistics (ONS) (2019a) ‘Pension wealth in Great Britain: April 2016 to March 2018’ [online],https://www.ons.gov.uk/peoplepopulationandcommunity/personalandhouseholdfinances/incomeandwealth/bulletins/pensionwealthingreatbritain/april2016tomarch2018#:~:text=5.-,Trends%20in%20active%20private%20pension%20wealth%20%E2%80%93%20membership,March%202018%20(Figure%203) (Accessed 30 November 2020)
Office for National Statistics (ONS) (2019b) ‘Occupational Pension Schemes in the UK’ [online], https://www.ons.gov.uk/peoplepopulationandcommunity/personalandhouseholdfinances/pensionssavingsandinvestments/datasets/occupationalpensionschemessurvey (Accessed 14 December 2020)