
©
Figure 4: Reprinted with permission from Davis, R. W. (1999) Science, vol. 283, copyright © 1999 American Association for the Advancement of Science
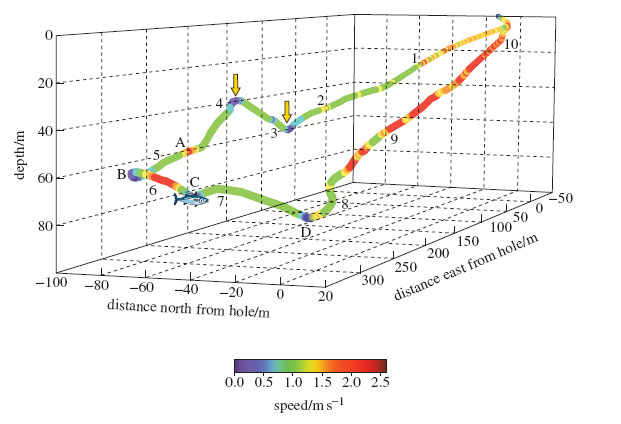
Figure 4 A three-dimensional map of the dive of a Weddell seal. The numbers on the plot indicate elapsed time in minutes since the start of the dive, and point C is where the seal made contact with the fish. Speed is indicated on the scale at the bottom right of the dive map. The diagram is identical to Fig. 1(A) of Reading 2 (linked further down the page); Fig. 1(B) in this reading is an enlarged view of one portion of it. If you try and read off the depth of the seal using the vertical axis, you'll note that it doesn't correspond exactly; we have reproduced the figure accurately from the original publication but it shows the difficulty of representing changes in three dimensions using only two dimensions!