Skip to content
Skip to main content

About this free course

Download this course

Share this free course

Surviving the winter

Start this free course now. Just create an account and sign in. Enrol and complete the course for a free statement of participation or digital badge if available.

Figure 14
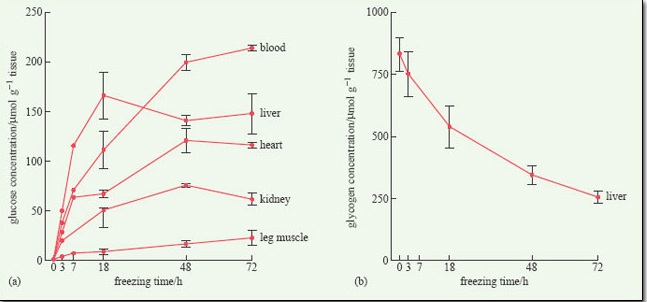
Figure 14 (a) Changes in the concentration of glucose in various organs of the wood frog (Rana sylvatica) over 72 hours of freezing at −2.5°C in the laboratory. (b) The corresponding depletion of liver glycogen reserves. Note that the horizontal axes are non-linear. Data from Pinder et al. (1992).

 1.4.3 Freeze tolerance in ectothermic vertebrates