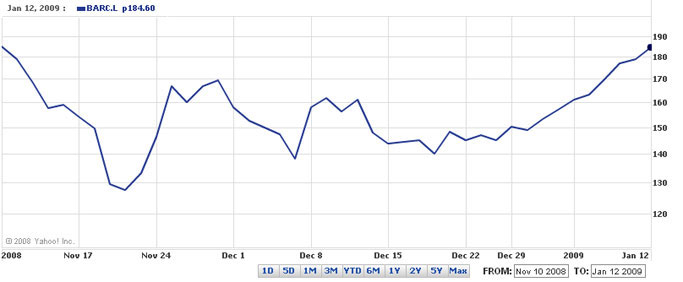
Figure 2 Barclays Bank share prices from 10 November 2008 to 12 January 2009 (Yahoo! UK & Ireland, 2009)

Personalise your OpenLearn profile, save your favourite content and get recognition for your learning

Start this free course now. Just create an account and sign in. Enrol and complete the course for a free statement of participation or digital badge if available.