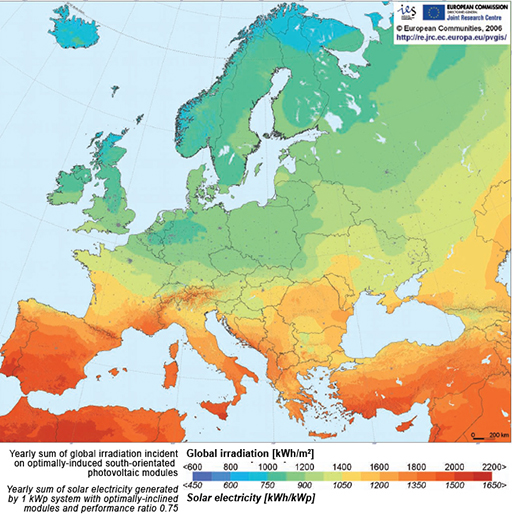
Figure 12 Solar radiation map of Europe, showing annual energy yields of optimally oriented PV arrays in various European locations. (‘Performance Ratio’ is the ratio of actual to theoretical maximum PV array output.)
Personalise your OpenLearn profile, save your favourite content and get recognition for your learning