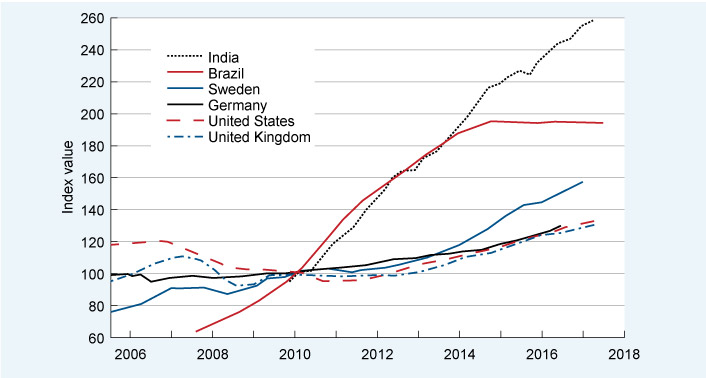
Figure 2 Nominal house prices, 2006–2017. Source: authors’ chart using data from OECD (2018). Index: base year is 2010 (average of four quarters) = 100.

Personalise your OpenLearn profile, save your favourite content and get recognition for your learning
Start this free course now. Just create an account and sign in. Enrol and complete the course for a free statement of participation or digital badge if available.