

3.2 Back to Linda
Thinking with Euler diagrams also helps to clarify why it has to be more likely that Linda is a bank teller than a bank teller and active in the women’s movement (Figure 15).
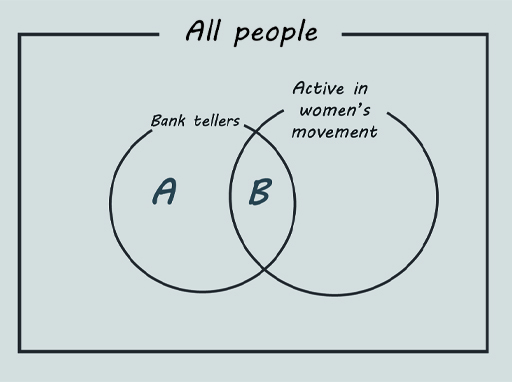
Here the outermost set is shown as a rectangle, which is the conventional way to show the set that represents ‘everything’ for the purposes of a problem under discussion.
Suppose the number of bank tellers not active in the women’s movement is A and the number of bank tellers who are active is B. Altogether there are (A+B) bank tellers.
Suppose that after counting all the people the result is 1,000,000. (Of course, this is not intended as any kind of real estimate. It is just an illustrative number, and any other would have done as well.)
Then the chance of Linda being a bank teller is (A+B)/1,000,000.
The chance of her being a bank teller and active in the women’s movement is B/1,000,000.
Because B is less than (A+B), the second probability is certain to be smaller.
Another bias in our thinking can come from our tendency to believe that small samples provide reliable information about the population as a whole.