

2.2.2 Applying Pareto analysis to customer profitability
It is often useful to distinguish between the most important few and the less important many in order to determine where management attention should be directed in keeping customers happy and/or cultivating relationships. The Pareto rule, that 80% of something is accounted for, or caused by, 20% of something else, often applies to customer profitability. These may not be the exact proportions but the general principle, that a high proportion of something is accounted for by a small proportion of something else, nevertheless often applies. Based on the assumed existence of this relationship, it can be helpful for management to undertake a Pareto analysis. For example, customers may be grouped by profitability to help management decide where their efforts should be directed, for example in KAM or CRM.
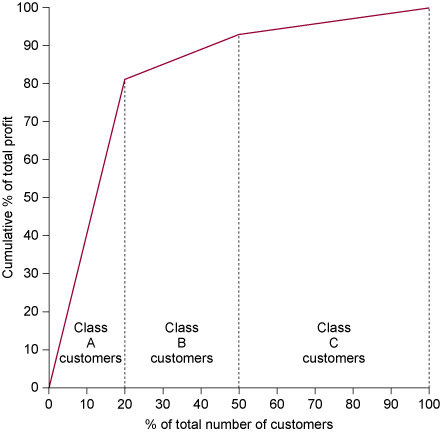
It is quite common to find that the top 20% of customers generate about 80% of total profit, the next 30% generate about 10% of total profit and the remaining 50% of customers generate about 10% or less of the total profit, as illustrated by the following example of DJM Ltd.
Example 1 Customer profitability analysis
DJM Ltd has 20 customers and has undertaken a Pareto analysis of customer profitability as shown below.
| Customer | Profit (£000s/year) | Total profit (%) | Cumulative profit (%) |
|---|---|---|---|
| A | 2,800 | 26.31 | 26.31 |
| B | 2,476 | 23.26 | 49.57 |
| C | 1,800 | 16.91 | 66.48 |
| D | 1,600 | 15.03 | 81.51 |
| E | 400 | 3.76 | 85.27 |
| F | 200 | 1.88 | 87.15 |
| G | 176 | 1.65 | 88.80 |
| H | 170 | 1.60 | 90.40 |
| I | 130 | 1.22 | 91.62 |
| J | 115 | 1.08 | 92.70 |
| K | 110 | 1.03 | 93.73 |
| L | 100 | 0.94 | 94.67 |
| M | 96 | 0.90 | 95.57 |
| N | 96 | 0.90 | 96.47 |
| O | 90 | 0.85 | 97.32 |
| P | 88 | 0.83 | 98.15 |
| Q | 80 | 0.75 | 98.90 |
| R | 64 | 0.60 | 99.50 |
| S | 32 | 0.30 | 99.80 |
| T | 20 | 0.19 | 100.00 |
| Total | Total 10,643 | Total 100.00 | |
| (rounded) | |||
It is useful to classify the top four customers as Class A customers and treat these as key accounts. The next six customers are treated as Class B customers, with less effort devoted to keeping them happy. All other customers receive relatively little attention.
It is sometimes helpful to illustrate the results of a Pareto analysis in a Pareto diagram, which shows the impact of each customer group on total profit, see Figure 2.
Stop and reflect
Internet retail outlets such as Amazon have thousands of customers in many countries. How could such companies use customer profitability analysis? They can no doubt trace the purchase history and related costs of each individual, but it may be useful to have categories of customer. Geographic region is one obvious category, gender or age might be others. Can you think of more possibilities?
This section has discussed how, in addition to knowing the costs (and hence the profitability) of providing particular products or services, an organisation should know the cost of serving different customers to determine their respective profitability. Many organisations’ cost and management accounting systems have focused only on product (rather than customer) costing. Increasingly, however, the impact of competitive pressures on profits is making it necessary for organisations to know the profitability of different customers. Activity based costing, although originally developed for product costing, can be adapted for this purpose. The next section lays the foundation for an important technique for addressing a different strategic challenge – making decisions about investments in projects.