4.4 Modelling sensitivity analysis
Spreadsheets allow us to see the impact of different possible outcomes on the net present value of the project. This form of sensitivity analysis can be very helpful as it allows us to see the effect of a single or a combination of possible outcomes as 'what if' scenarios. The following material shows the use of spreadsheets in this context.
First watch the video ‘Sensitivity analysis’ which shows you how to carry out break-even sensitivity analysis in investment appraisal.
Break-even sensitivity analysis finds the percentage change from the original value, in each of the project’s inputs in turn, that is required to achieve a zero NPV. The input or variable that shows the smallest change is the most sensitive.
The most sensitive variables are the variables where small changes or deviations from the project’s plan will have a greater impact on the outcome, or NPV, than changes in other variables.
Knowing which variables are the most sensitive helps you focus on the high risk areas of a project. It allows further testing of assumptions regarding the forecasts and projections associated with the sensitive variables.
The sensitive variables will be monitored closely by managers if the project goes ahead.
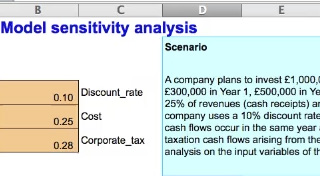
A company plans to invest £1,000,000 in a new product that will generate revenues (cash receipts) of £300,000 in Year 1, £500,000 in Year 2 and £600,000 in Years 3 to 5.
Costs (cash payments) will be 25% of revenues (cash receipts) and are paid in the same year as the relevant cash receipts.
This company uses a 10% discount rate for projects of this type.
The corporate tax rate is 28%. Taxation cash flows occur in the same year as the relevant taxable receipts and payments. There are no taxation cash flows arising from the investment of £1,000,000. Calculate the NPV of this investment.
This time, carry out break-even sensitivity analysis on the inputs of this investment.
Watch the video:

Transcript: Video 5 Sensitivity analysis
This spreadsheet shows you how to identify the most sensitive inputs in a discounted cash flow or DCF model, using a method called break-even sensitivity analysis.
In this method, each of the inputs is tested one at a time to see by how much the input has to change for the investment to break even.
As you can see the DCF model has already been set up and the net present value or NPV calculated, using the assumptions of discount rate, percentage of costs and corporate tax as shown in the input range.
An additional input and output area has been set up with the inputs which we are going to test for sensitivity levels: and these will be discount rate, cost and corporate tax rate.
We have already mentioned the sensitivity of the discount rate and the costs.
The discount rate which brings the NPV to zero is 11% or 11.2763 etc. per cent. Not surprisingly this is the internal rate of return, the IRR or break-even discount rate of the cash flows of the project.
The percentage change column shows the amount of change of the input relative to the original input value which was required to achieve a zero NPV. The percentage of change in the discount rate is 12.76%.
We are going to test the sensitivity of the corporate tax rate. We will use the Goal seek function in Excel. Click on the cell which contains the NPV. Go to the tool bar. Click on Tools and select Goal seek. The Goal seek dialogue box appears with the NPV cell, D22, highlighted. This is the value which we set to zero by selecting the cell which contains the corporate tax rate as the cell to be changed. Click OK, and OK again, and see how the net present value changes to zero.
Go to the corporate tax input range cell. It now shows a value of 0.31 or 31%. This value is rounded to two decimal places. The formula bar shows the exact value to many decimal places! So about 30.5% is the corporate tax rate which gives a zero NPV.
Right click to copy the corporate tax input range cell and paste into the cell which contains the input values after calculating a zero NPV. Right click and select Paste special command and then select Values to copy the value but not the format of the cell.
The cell to the right contains a formula which calculates the change in the value of the corporate tax rate from 28% to 31%. The change is about 9%.
Now re-set the input range corporate tax rate cell to the original 28%.
Sensitivity analysis involves changing one input at a time to measure the effect on the NPV so remember to re-set any changed values back to the original amounts in the DCF model before changing another input.
Go to the calculated percentages which measure how much each input must change before a zero NPV is achieved.
Which input shows the smallest percentage change? Corporate tax is the input which shows the smallest change. This is the most sensitive of these three inputs tested.
A 9% increase in the corporate tax rate will change the NPV to zero. A zero NPV means that the project does not generate value for the company.
Make your own notes.
You can see the Sensitivity analysis (solution) [Tip: hold Ctrl and click a link to open it in a new tab. (Hide tip)] here.
