

4.1 Decision trees and expected value
You are now at a stage to see how an understanding of expected values and probability can be combined to simplify complex business problems.
Example: decision tree for a business considering a new office location
You are considering opening a new office somewhere in the UK and you have shortlisted two town councils: A and B. However, a key factor is the impact of local taxes, also called business rates.
Local elections are coming up with two main parties in the running: J and K. Each party has a different view on how business should be treated; however, there is uncertainty as to whether they will increase or decrease business rates.
Table 8 shows the probabilities of each party winning, their possible views towards business and the impact of each.
| Council | Party | Probability of winning | Probability of being business friendly | Estimated impact of being business friendly/ £M | Estimated impact of being business unfriendly/ £M |
|---|---|---|---|---|---|
| A | J | 0.55 | 0.7 | 3.0 | -0.50 |
| K | 0.45 | 0.4 | 0.5 | -2.00 | |
| B | J | 0.30 | 0.6 | 2.5 | -0.25 |
| K | 0.70 | 0.35 | 1.0 | -1.00 |
The probabilities of winning might be based, for example, on the odds currently being offered by a betting website, predicting the chances of that party winning.
The probabilities of being business friendly would be based on past experience and any announcements being made by the parties.
The final two columns show the estimated monetary impact, positive or negative, in £ millions.
In the fifth column, ‘Estimated impact of being business friendly/£M’, if, for example, in the first row, in council A, party J has a 0.7 probability of being business friendly, then it must have a probability of 0.3 of being unfriendly towards business. This is because the total probabilities must total to 1.
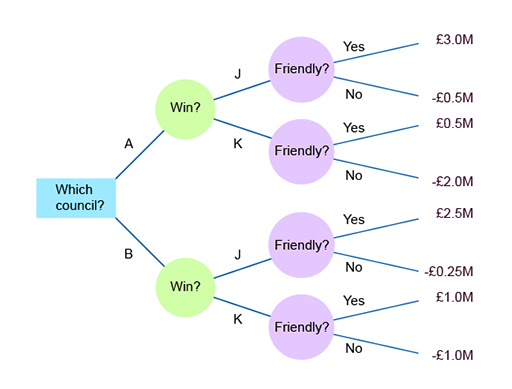
Table 8 includes estimates of the financial impact. So, for example, in the first row, it has been estimated that in council A, if party J were business friendly, the company would benefit financially by £3M. On the other hand, if the party were not business friendly, the company would suffer financially by £0.5M.
The data shown in Table 8 can be mapped in a decision tree as follows.
Creating a decision tree
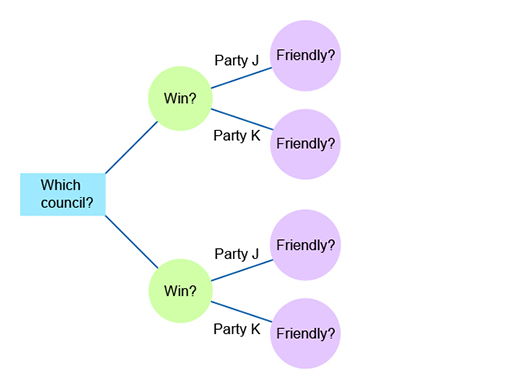
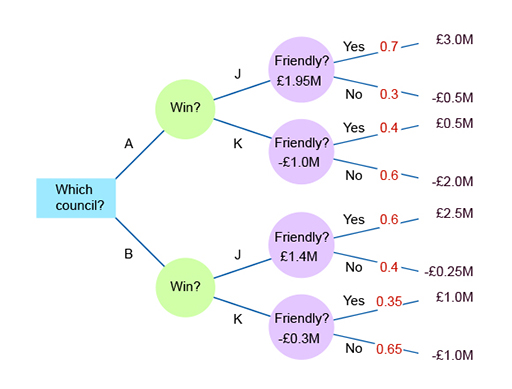
Put in the main decision and choice nodes (Figure 1).
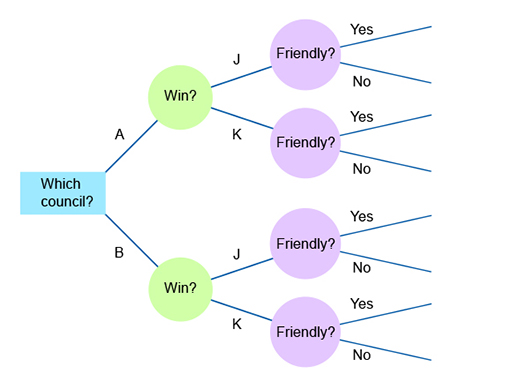
Add the final column (Figure 2). This column leads to the final value for each particular path. In other words, you will add the top branch of the decision tree – the impact if council A wins and it is business friendly.
Put in the impact values (Figure 3).
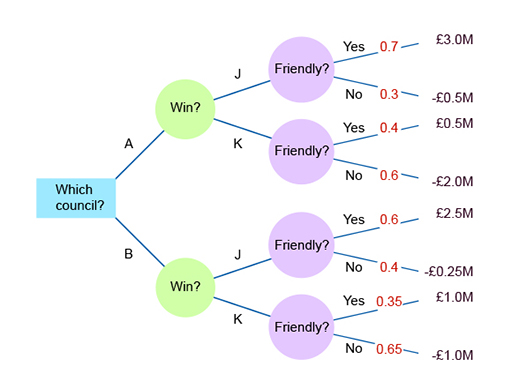
Then add their probabilities. Note that if party J in council A has a 0.7 probability of being business friendly, then it must have a 0.3 (1 – 0.7) probability of being business unfriendly.
As the only possibilities are being friendly or unfriendly, the probabilities of these must equal 1 – it is definitely either friendly or unfriendly (Figure 4).
This example only has one decision node: which town to move to. There are then two sets of chance nodes. The ‘chances’ being those actions outside of the decision-maker’s control. They are: Which party will win? (So you can create a branch for each of the two possibilities) and, is that winning party business-friendly or not?
Again, you create a branch for each answer. If there were more decisions, at each decision node you would insert a branch for each option open to the decision-maker.
Calculating the expected value
Now you can find the expected value of the financial impact for each party in each council.
-
What is the expected value of the financial impact if party J won in council A?
-
There is a 0.7 probability of it being business friendly and 0.3 of it being unfriendly. If party J won council A, the expected financial impact would be:
(0.7 × £3M) + (0.3 × -£0.5M) = £1.95M.
The expected values can be added to the decision tree (Figure 5).
-
What is the financial impact if the company moved to council B?
-
There is a 0.3 probability of J winning (with an expected financial impact of £1.4M) and 0.7 of K winning (with an expected impact of -£0.3M). So the expected financial impact of moving to B is:
(0.3 × £1.4M) + (0.7 × -£0.3M) = £0.21M.
The probabilities can be added to the decision tree (Figure 6).
For example, for council A, the expected value is:
(0.55 × £1.95M) + ( 0.45 × -£1M) = £0.62M
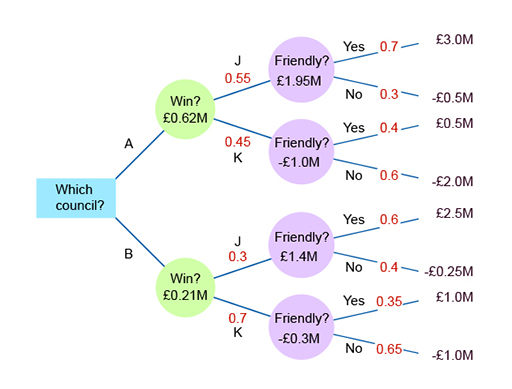
So now you can step back and see that council A has the higher expected value (£0.62M compared with £0.21M in B) and so, on the grounds of economic impact (there may be other factors), you would select to relocate to A.
This general approach to solving the problem, by analysing from the last stage back to the first, is a process called dynamic programming. The content of this course will not go beyond decision trees.
In the next subsection you will consider an example of a complex decision tree related to the launch of a product.