3.2 Aids to decision making
Decision trees
One particular decision making technique is to use a decision tree. A decision tree is a way of representing graphically the decision processes and their various possible outcomes. They are particularly useful when you have to make a decision about a choice of route when there are uncertainties about the results of adopting that route.
Let us take a simple example. Suppose that you are developing a software product and you want to decide whether to buy in a package to form a part of that product or whether to develop a package yourself. You believe that the chances of good sales will be improved if you develop your own package although developing your own package will cost more. This situation can be represented in the decision tree of Figure 9.
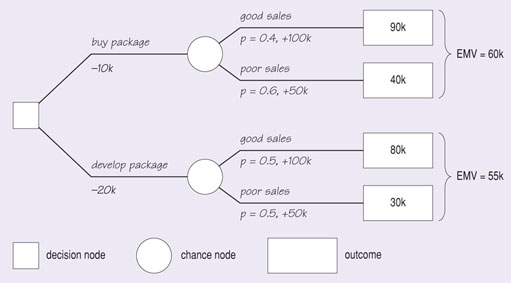
In this decision tree, options or decision nodes are represented by squares, and chance nodes by circles. The main decision is at the left, whether to buy or develop a package. The costs of the options at that point (£10 000 to buy, £20 000 to develop) are shown against the branches. Each of these branches has a chance node shown, with the probabilities of reaching particular outcomes given (e.g. 40% probability of achieving good sales of £100 000). The final rectangle (the leaf at the end of each branch) gives the total value of reaching that particular outcome, including any costs and benefits attached to branches en route. For example, the top leaf on the right of the tree is worth £90 000, as a result of profits of £100 000 minus the cost of buying the package initially, £10 000.
It is now possible to see how the expected monetary value (EMV) for each of the two options shown in Figure 9 is calculated using the formula:
where
Vi is the value of outcome i,
Pi is the probability that outcome i will occur, and each probability is expressed as a decimal between 0 and 1,
n is the number of possible outcomes, and the sum of the probabilities for n is equal to 1.
Applying the formula to the option to ‘buy the package’ gives:
EMV = [0.4 x (100k – 10k)] + [0.6 x (50k – 10k)] = (0.4 x 90k) + (0.6 x 40k) = 60k
Applying the formula to the option to ‘develop the package’ gives:
EMV = [0.5 x (100k – 20k)] + [0.5 x (50k – 20k)] = (0.5 x 80k) + (0.5 x 30k) = 55k
The probabilities assigned at the chance nodes are subjective probabilities, perhaps arrived at by using one or more forecasting techniques, and the values of outcomes may be estimated using one or other of the financial appraisal techniques referred to earlier.
SAQ 11
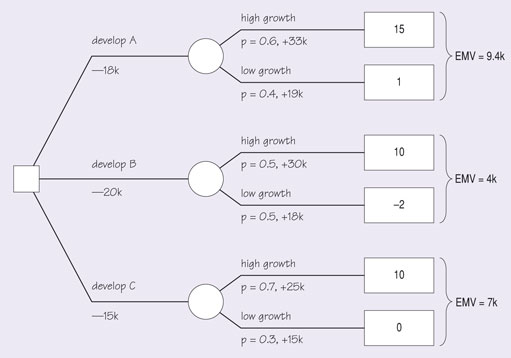
(a) Construct a decision tree to choose from three possible products that might be developed. The costs of developing each product are shown in the first column of Table 9. Estimates have been made of the probability of getting high or low growth for each of the products. The value of the product is in each case higher if high growth can be obtained. The values of the products in each case are as estimated in column 5.
(b) Calculate the EMV of each option.
| Product | Cost £k | Growth | Probability | Value £k |
|---|---|---|---|---|
| A | 18 | High | 0.6 | 33 |
| Low | 0.4 | 19 | ||
| B | 20 | High | 0.5 | 30 |
| Low | 0.5 | 18 | ||
| C | 15 | High | 0.7 | 25 |
| Low | 0.3 | 15 |
Answer
(a) The decision tree is as shown in Figure S.2. The values of the outcomes at each leaf are the net benefits of the whole path from decision to the end of the path. Note that the value of an outcome can be negative.
(b) The values of the EMV for each decision are also shown on the figure: £9400, £4000 and £7000.
The users of the decision trees shown so far have had only one decision to make. This has been the decision shown at the left-hand side of the tree. However, a decision tree can be more elaborate and include further decision nodes, representing further decisions that you will have to make along the route to the outcome. Such a tree is shown in Figure 10, where the primary decision is to choose between the development of two products, A and B. We have already seen product A in Figure 9
If you choose product A you still have to decide whether or not to buy a package as discussed earlier.
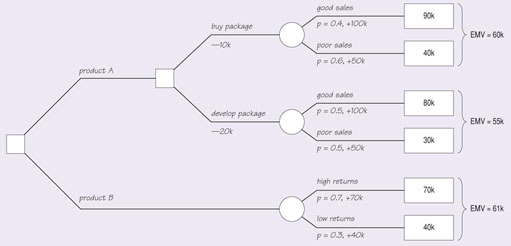
The way to tackle such trees is to look at the subsidiary decision first. In fact we have already done this for product A, and found that the EMV of buying a package was higher than the EMV of developing one, so we conclude that at that decision point we will take the higher-value branch. The tree can then be simplified by cutting out the irrelevant branch and removing that decision node. Since the EMV of product A, as found in Figure 9, is at best £60 000, the decision tree of Figure 10 now indicates product B as the higher-valued choice. (As with all such decisions you must remember the likely accuracy of the estimates, and there may be other, non-monetary, reasons for choosing product A.)
In a tree that has a number of subsidiary decisions you would need to eliminate each node in turn until the tree is reduced to the principal decision, all the other decisions having been taken on the way that gave the optimal value.
Proposal ranking formulas
The technique of proposal ranking formulas is unsophisticated and suitable only when fairly low expenditure is being considered. The viability of different proposals is compared by ranking them in order according to payback time or rate of return.
Proposal selection index
Proposals can be ranked according to a proposal selection index of the form:
I=PT x PC x NPV
where PT is a measure of each proposal’s anticipated technical success, PC is a similar measure of anticipated commercial success and NPV is the anticipated net present value of each proposal.
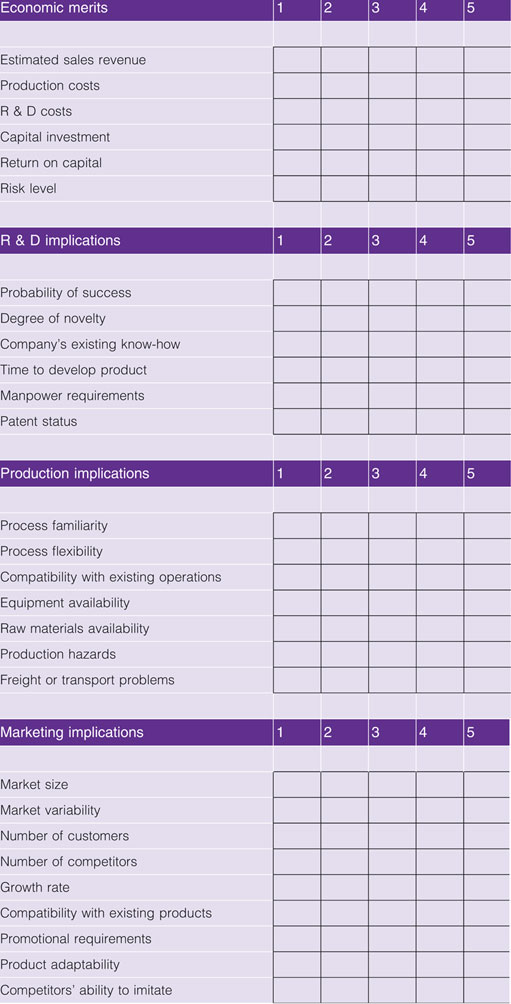
Checklists
Checklists of the type shown in figure can be used to assess various aspects of a number of proposals – in this case R & D proposals – and then used to make comparisons between the different options.
KEY
1 = Unacceptable
2 = Unfavourable
3 = Adequate
4 = Favourable
5 = Most favourable
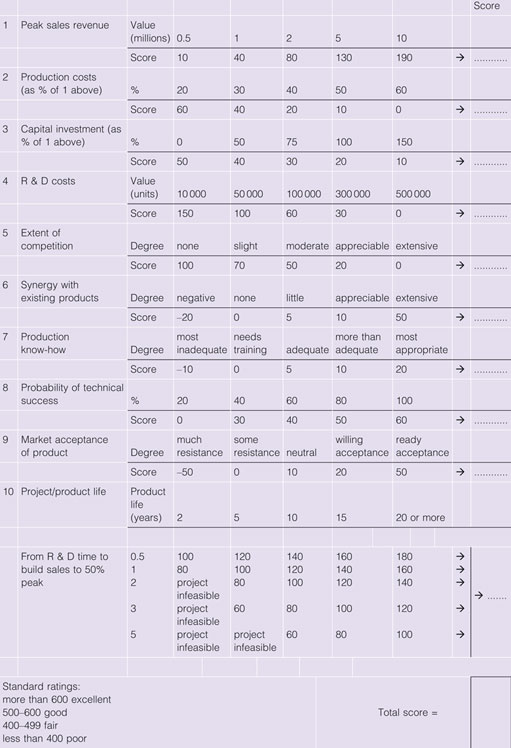
Measured checklists
This method is almost identical to the previous one but instead of various aspects being rated on a scale that stretches from ‘unacceptable’ to ‘most favourable’ they are scored numerically. An example of a measured checklist, again for an R & D project, is shown in Figure 12.
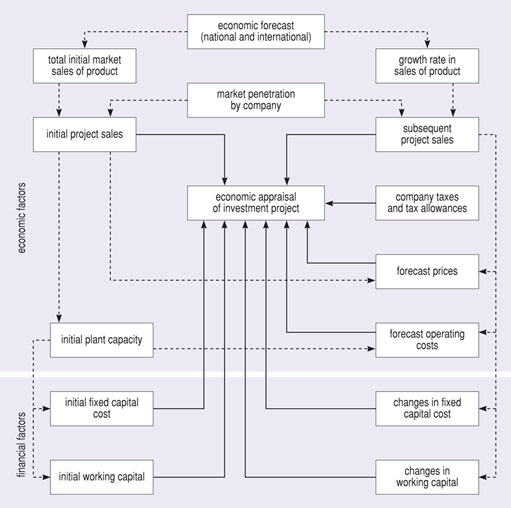
Limitations of techniques
One of the main problems associated with these and similar techniques is that they all require estimates to be made of the cash flows that will be realised throughout the economic life of a project and also of the probabilities of the different outcomes. Putting this another way, they assume, for a capital investment project, say, that it is practicable to supply the information shown in Figure 13. This may patently not be the case when a proposal has not even reached the drawing board stage. The costs of gathering such information are usually too substantial to be incurred lightly. Sometimes the only alternative is to accept the risks that are inherent in making decisions based on hunches and incomplete information and to try to keep some of the rejected options open until the front-runner has been evaluated more fully. Another approach is to use sensitivity analysis, in which we try out different values for some of the main parameters and see how these affect the final decision. Hence, we can determine how sensitive the result is to variations in the data and can make more informed decisions.