2 Exploration of debt
2.1 Debt: concepts and evidence
Let’s start by examining exactly what is meant by ‘debt’. You may be familiar with the concept of assets and liabilities. Assets are things that people own at a point in time. By contrast, a debt is a liability. Liabilities are effectively the opposite of assets: they are amounts, or stocks, of money that people owe at a particular point in time. Typically, this would include mortgages; personal loans; outstanding amounts on hire-purchase agreements; credit card debts; and bank overdrafts. If, at the point of time that you read this course, you owe money in any of these ways, then you have a liability for that amount. Liabilities can also include money owed on items such as utility bills and Council Tax bills (a situation often referred to as being ‘in arrears’), although these are not included in the Bank of England’s calculation of the £1.4 trillion of personal debt.
Having an understanding of both assets and liabilities is an essential part of financial capability. By comparing assets owned with liabilities owed, you will be able to look at concepts such as net worth (also referred to as ‘net wealth’), or the value of all assets minus the value of all liabilities.
In this course, we’ll be concentrating on looking at debt in some detail. Let’s start by briefly considering the terms which are often used to talk about debt: ‘borrowing’, ‘debt’ and ‘credit’. The term ‘borrowing’ is frequently used to describe the process by which debt is taken out, and is also the amount that is taken out in any one time period, such as ‘I borrowed £10,000 this year’. ‘Debt’ is, strictly speaking, the total amount of money owed at a particular point in time – if you borrowed £10,000 this year and £10,000 last year, then you could say that you now have £20,000 of debt (although in reality the figure would have changed due to interest and repayments). Confusingly, ‘borrowing’, in popular usage, can also be used to express the total amount outstanding, as in ‘I have £20,000 of outstanding borrowing’. Sometimes, the distinction is that ‘debt’ is used to imply a less voluntary situation, whereas the term ‘borrowing’ is often used when the debt has been undertaken voluntarily, such as when taking out a mortgage. What is crucial here is that the amount – whether one refers to it as ‘outstanding borrowing’ or simply ‘debt’ – is still a liability. To keep things simple, we will primarily use the term ‘debt’ in this course, with ‘borrowing’ describing the process by which debt is taken out.
The third term that you’ll see or hear in the media is credit, defined as an arrangement to receive cash, goods or services now and to pay for them in the future. It has been argued that there is a rather subtle distinction between debt and credit, which has been described as follows: ‘Debt is the involuntary inability to make payments which the payee expects to be paid immediately, as opposed to credit use, which can be characterised as agreed postponement of payment’ (Furnham and Argyle, 1998, p. 113). So debt can have the sense of being more involuntary than credit – and debt is traditionally associated with debt problems, which we shall be looking at later in this course. It is perhaps not surprising that the part of the UK financial services industry concerned with lending money is known as the ‘credit industry’ rather than the ‘debt industry’. However, the crucial point – just as with the distinction between debt and borrowing – is that an amount owed at a particular point in time, no matter how it has arisen, is a liability.
Some 85 per cent of the UK’s £1.46 trillion of personal debt in 2010 is accounted for by mortgages. Debts such as these are known as secured debt, meaning that the amount owed is secured against assets – in this case houses – which can be ‘repossessed’ and sold by the lender if repayments are not made by the borrower. Debts that are secured on housing are known as mortgages. Other types of debt are known collectively as unsecured debt. In 2010 these represented some £220 billion or 15 per cent of the total (Bank of England, 2010a). Unsecured debt includes money owed on credit cards, retail finance, overdrafts, mail order catalogues, and other types of personal loans. If repayments are not made the lenders will still seek to recover the money lent – often by using debt collection agencies. However, since the debt is unsecured, the lenders have no right to the specific assets that may have been acquired with the borrowed money.
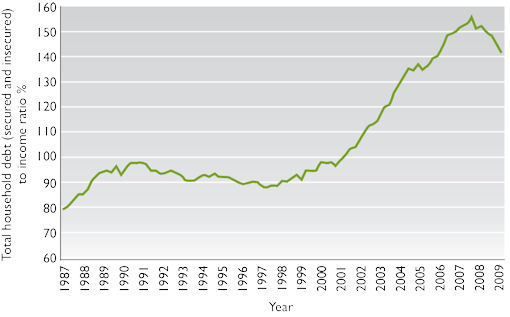
Levels of personal debt have changed over time, growing steadily in the 1980s, then more slowly in the early 1990s – largely as a consequence of falling house prices, which reduced the size of demand for mortgages – and growing rapidly from the mid 1990s until 2007, then slowing significantly during the subsequent financial crisis. Notwithstanding these variations in the rate of growth, the overall picture is that personal indebtedness in 2008 was substantially higher than ten, twenty or thirty years earlier. One consequence has been that the ratio of total personal debt to total after-tax household income has risen materially. As you can see in Figure 2, between 1987 and 2009 the ratio of debt to household income increased from 0.8 to over 1.5 (BIS, 2010). Following the financial crisis the debt-to-income ratio declined, as is also shown in Figure 2. This ratio had risen to 1.6 by the onset of the financial crisis in 2007, at which point it levelled off (Bank of England, 2010a; ONS, 2010a). This means that up to 2008, a period of time when household income was growing, levels of debt were growing even more rapidly. The inference is that the burden of debt on households over this period was therefore growing – since more debt means that greater sums have, eventually at least, to be repaid. From 2008, the fall in the ratio could be explained by households paying down debt and being more reluctant to take out new debt.

An important factor in this preparedness to take on debt was the level of ‘economic confidence’ from the mid 1990s to 2007. When people feel optimistic about the future – when there is the so-called ‘feel good’ factor about the economy – they are more likely to consider taking on debts than if they are worried about the economy and problems such as falling net incomes and unemployment. Indeed, the prevalence of the latter factors from 2007 helps to explain why outstanding personal debt slowed substantially from that point. The demand for debt products remained low throughout the period of economic recession after 2007, and even in 2010 ‘demand for secured lending, including remortgaging, remained weak’ (Bank of England, 2010b), while the annual growth rate of unsecured lending was close to zero.
There were some specific developments within personal debt in the 1990s and 2000s. One was for people to increase the level of secured debt by increasing their mortgage debt. This phenomenon came about particularly as a result of rising UK house prices. The rising prices tended to increase the equity people had in their homes. Many people therefore sought access to this additional equity by increasing the size of their mortgages and then using the resulting funds to increase spending in other areas (Del-Rio and Young, 2005). This process is known as equity withdrawal.
A second development within the total level of personal debt has been an increase and then a decrease in the proportion that is unsecured. Unsecured debt rose from 13 per cent of total debt in 1993 to 18 per cent in 2005, only to subsequently fall back to 16 per cent in 2007 and 15 per cent in 2010 (Bank of England, 2010a). While the rise can be explained by the greater use of credit cards in the 1990s and early 2000s, the subsequent fall in the proportion after 2005 may be ascribed to borrowers replacing unsecured debt with cheaper secured debt or simply paying off expensive credit card debts. Despite this trend change, the average level of unsecured debt for each household in the UK in 2010 still amounted to £8650 (Credit Action, 2010a). There has also been a gradual shift in the uses to which such unsecured debts are put, with more people taking on debt to finance expenditure on items such as holidays, clothing or special occasions (Del-Rio and Young, 2005).

