

2.1 Changes in nominal house prices
To start, look at the evidence for rising house prices.
Figure 2 shows an index of ‘nominal’ house prices for six different countries, which correspond to where the households featured in Activity 1 live. By ‘nominal’, we mean actual house prices without any adjustment for the way the value of money changes over time because of changing (usually rising) prices.
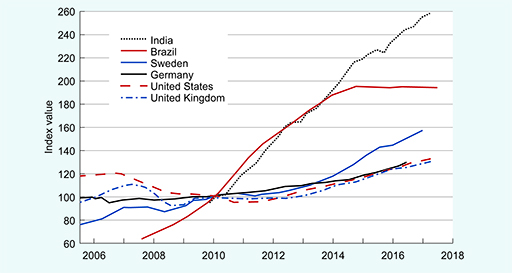
Figure 2 is a line chart with each line representing the change in average house prices over the years in each particular country. The lines do not show actual house prices (in pounds, dollars, and so on). Instead, actual values have been converted to index values. See Box 1 for an explanation of index values.
Box 1 Constructing and using an index
An index shows the value of something (in the case of Figure 2, average house prices in each country) relative to a base value.
A time period is chosen as the base and this is assigned a value of 100. The value in every other time period is calculated using the change in the actual value relative to the actual value in the base period. For example:
- Suppose the actual value in the base period was £100,000 and the actual value in the next year was £110,000. This is an increase of 10%.
- Study note: The percentage (10%) has been worked out like this: take the difference of £10,000 (£110,000 - £100,000), divide it by the starting value of £100,000, and multiply by 100 to express the value as a percentage (in other words a fraction out of 100 parts). This course assumes you have dealt with percentages before. However, if you want to learn about them or brush up on your skills, see the free OpenLearn course Ratio, proportion and percentage [Tip: hold Ctrl and click a link to open it in a new tab. (Hide tip)] .
- The index value for the base year is set at a value of 100. This is called the base value.
- The index value for the following year would be calculated to be 110 (£110,000 ÷ £100,000 x 100), which is 10% higher than the base value of 100. The general formula for calculating an index value is:
- Actual value in selected time period ÷ Actual value in base period x Base value
In other words, index values tell you how the underlying actual values have changed relative to the base year.
In Figure 2, the base value is the average for 2010, so that’s when the index was 100. Index values for other periods that are below 100 mean that house prices were lower than the 2010 average; index values above 100 indicate that house prices were higher.
Activity 2 Patterns in nominal house prices
a.
Downwards
b.
Level
c.
Upwards
d.
Different in different countries
The correct answer is c.
c.
You can see from Figure 2 that the trend in all six countries has been upwards since 2010.
a.
Brazil
b.
India
c.
UK
d.
Sweden
The correct answer is b.
b.
Although nominal house prices have risen in all the countries, they have done so at very different rates. The steepest rise has been in India where, by 2017, nominal house prices were nearly 160% higher than in 2010. This is calculated as ((260 – 100) ÷100) × 100.