
2.6 An evolving consensus on attribution
The fact that the Earth really is warming up now commands near-universal support. However, it is one thing to detect a global warming trend that appears to be unprecedented in the past millennium (Subsection 2.2.2), and quite another to establish with a given level of confidence that it has been caused by (i.e. can be attributed to) human activity - specifically, the increase in greenhouse gas concentrations and associated radiative forcing since pre-industrial times (reviewed in Section 1.6). Establishing 'cause-and-effect' relationships in the behaviour of complex natural systems is always difficult, and often controversial. With such high stakes in the present context, the 'question of attribution' is probably the most sensitive area of the IPCC's remit. Certainly, it is an area where the Panel has always exercised particular caution over its pronouncements, well aware that these will make headline news around the world. As scientists involved in the IPCC process have put it (Allen et al., 2001):
We should recall that the IPCC was under considerable pressure in 1990 to make a statement attributing observed climate changes to human influence 'because if they don't, someone else will' (and indeed, did). The IPCC is a cautious body, and if the evidence is not available in the peer-reviewed literature to support a statement, it will not make it, no matter how great the interest in that statement might be. In the end, this caution resulted in the attribution statement made in the Second Assessment Report [in 1996] having much more impact than if it had been made prematurely.
The reference here is to the much-quoted statement: 'The balance of evidence suggests that there is a discernible human influence on global climate'. Even this decidedly equivocal language was sufficient to trigger charges that the IPCC process had been 'corrupted', and a high-profile campaign (again, especially in the US) aimed at discrediting the Panel's conclusions. Just five years later, however, the TAR pointed to humans as the culprits in more robust terms: it is 'likely' (66-90% probability; Box 8) that 'most of the warming over the last 50 years' is attributable to 'the increase in greenhouse gas concentrations' - the final bullet point at the beginning of this section.
Before we take a closer look at the evidence behind this statement, it is worth pausing to consider why there might be grounds for scepticism about there being a causal link between 20th century climate change and human activity - a stance that a few scientists continue to maintain. With this in mind, try Question 11 before moving on.
Question 11
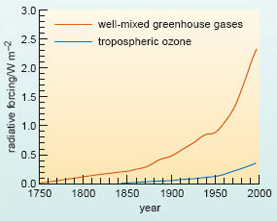
(a) Figure 36 shows how the greenhouse forcing of climate (summarised in Table 2, Section 1.6) has evolved over time since 1750. Compare the pattern of change in this figure with that marked out by the smoothed curve in the instrumental record of the Earth's GMST, Figure 24a. Why might this comparison raise doubts about attributing the development of global warming to the build up of greenhouse gases in the atmosphere?
(b) What other sources of radiative forcing, both natural and anthropogenic, could also have influenced global temperature over the past century? In each case, indicate whether the forcing would be positive or negative, or whether it could act either way.
Answer
(a) As noted in Subsection 2.2.2, the smoothed curve in the instrumental record (Figure 3.3a) traces a very irregular pattern of warming during the course of the 20th century. There is little direct correlation with the observed build up of greenhouse gases, which translates into a relatively smooth and accelerating increase in radiative forcing since pre-industrial times (Figure 35). In this context, the most striking inconsistency is the pause in the upward trend in GMST (or even a slight cooling; Activity 1) from the mid-1940s to the mid1970s - whereas the greenhouse forcing shows the steepest increase from around 1950.
(b) Natural sources of radiative forcing include possible variations in the solarconstant during the 20th century (could be either positive or negative forcing), together with the short-term negative forcing associated with volcanic activity. Other anthropogenic factors include: the cooling effects (both direct and indirect) of sulfates and most carbonaceous aerosols; the warming effects of 'black carbon' (Section 1.6); and the effect on surface albedo of widespread deforestation (likely to be negative forcing; Question 5b).
[The important general point is that variations in the Earth's GMST reflect the influence of the total radiative forcing of climate, and how this has evolved over time during the past century: deviations from the 'expected' steady warming trend due to greenhouse forcing alone are only to be expected. Keep this in mind as you work through the rest of Section 2.6.]