
2.6.2 The role of modelling studies
State-of-the-art models are designed to simulate the workings of the climate system (in so far as this is currently understood), and include the 'internal' interactions that generate short-term natural variability in the real world. They provide modellers with a means of carrying out 'virtual' experiments on the climate system. In the present context, an important aim of these experiments is to identify the 'signal' of a human influence on climate, so studies typically involve 'feeding' into a model the time-evolving history of radiative forcing due to:
natural factors (solar variations and volcanic activity) alone;
anthropogenic factors (usually just greenhouse gases and aerosols) alone; and
both natural and anthropogenic factors combined.
In each case, the model simulates the time-evolving change in GMST in response to that particular history of radiative forcing, and this is then compared with the observed temperature record (i.e. Figure 24a). The results of modelling studies of this kind reported in the IPCC TAR are shown in Figure 37. Study the figure and its caption carefully, and then work through the following questions.
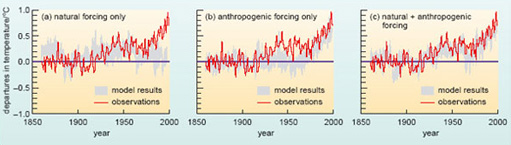
Figure 37 Complex climate models have been used to simulate the Earth's temperature variations over the past 140 years in response to both natural and anthropogenic forcings. The figure shows comparisons between the observed changes and the results of model simulations done with: (a) natural forcing (solar variations and volcanic activity) only; (b) anthropogenic forcing (greenhouse gases and sulfate aerosols) only; and (c) both combined. In each case, the grey band encompasses the results of several model runs and gives an idea of the uncertainty in the simulated response (including that in the 'internal' variability generated by the model). The simulations in (b) and (c) include estimates of the direct and indirect effects of sulfate aerosols. Note that temperature changes are given relative to (i.e. as 'departures from') the climatological average for 1880-1920, not 1961-1990 as in Figure 24a. (Source: IPCC, 2001d.)
SAQ 33
What does the comparison in Figure 34a suggest about the influence of natural forcings during the course of the 20th century?
Answer
The net effect of solar variations and volcanic activity seems to have produced a positive forcing of climate during the first half of the century, and probably contributed to the observed warming at that time. However, natural factors alone would have resulted in a slight cooling of the planet thereafter (i.e. the net forcing was negative).
In other words, natural factors cannot explain the observed warming over the last 50 years.
SAQ 34
How does the comparison in Figure 34b support the IPCC's conclusion that most of this warming was due to human activities?
Answer
The model-simulated response to anthropogenic forcing shows a persistent upward trend in GMST from around 1950 (when the greenhouse forcing accelerated; Figure 32). Further, the rate and magnitude of the simulated warming over recent decades is broadly consistent with the observed changes.
Note that the 'compensating' cooling effect (both direct and indirect) of the tropospheric load of sulfate aerosols, which increased throughout this period, is included in the study in Figure 37b. In experiments done with greenhouse forcing alone, the simulated warming over recent decades is typically larger than that observed in the real world.
Finally, Figure 37c shows that the best match with observations over the whole century is obtained in simulations that include both natural and anthropogenic forcings. This suggests that these forcings are sufficient to explain the major features of the Earth's recent temperature history. And that, in turn, adds weight to the case for an identifiable greenhouse warming signal over the past 50 years. The inconsistencies noted earlier (Question 11) then come down to the way this warming effect has been offset to some extent by the cooling influence of natural factors (especially around the middle of the century, evident in Figure 37a) and sulfate aerosols, together with the noise of internally generated natural variability.
Still, a word of caution is in order. For example, the simulations in Figure 37 do not include the influence of non-sulfate aerosols or past land-use changes. Bear in mind too the considerable uncertainty about the natural and anthropogenic forcings that are included - for all bar the contribution from increased greenhouse gas concentrations (Figure 36). Equally, it is pertinent to ask probing questions about the climate models used in studies like this (as we shall in Chapter 6: how confident should we be about the simulated response to radiative forcing?
The IPCC is well aware of these concerns - a major reason for caution over its pronouncements on the attribution question. The relevant chapter in the TAR documents the sophisticated statistical techniques that have been brought to bear on the significance of the similarities (or indeed, differences) between model simulated and observed changes - not only in the GMST, but also in other climate variables around the world (e.g. those included in Table 4). According to the IPCC, these more detailed studies 'consistently find evidence for an anthropogenic signal in the climate record of the last 35 to 50 years', even when uncertainties of the kind noted above are taken into account. Put this together with a longer and more closely scrutinised temperature record (Question 8), and the unprecedented warmth of recent decades (Section 2.2.2), and you can begin to see why the Panel finally felt able to endorse a less equivocal attribution statement. In the words that appeared in countless press reports when the TAR came out in 2001 (taken from one of the headings in the SPM): 'There is new and stronger evidence that most of the warming observed over the last 50 years is attributable to human activities'.
The IPCC is not alone in its conclusions. As one recent article in the journal Science put it (Oreskes, 2004):
In recent years, all major scientific bodies in the United States whose members' expertise bears directly on the matter have issued similar statements […] concluding that the evidence for human modification of climate is compelling.
In short, the overwhelming scientific consensus is that the human impact on the atmospheric burden of greenhouse gases has made a significant contribution to recent climate warming - and hence, by implication, to the observed changes in other climate variables, and in physical and biological systems reviewed in Section 2.5. But what of the future? What further climate changes might lie ahead in a future that could see an extra three billion people on the planet by 2050 (Figure 18, Section 1.6)?
Just as simulations with climate models have provided insight into the human influence on climate in the past, so they are fundamental to projections of future human-induced climate change. A climate model is just what the name implies: a 'model' of the 'climate system'. But what do we actually mean by the Earth's climate system? This question has been lurking in the background in this and earlier sections and needs to be addressed, but is beyond the scope of this unt.