

3.2 The past temperature of the planet
Measuring the concentration of lead in the ice is called a direct measurement: the ice sample is melted and the water produced contains a very small but readily measured quantity of lead dust. A very accurate set of scales is needed to measure it, but it is a directly measured quantity.
There are also many indirect measurements that can be made using proxies. The concept for using proxies is both simple and brilliant: one measured property allows inference about other states of the system (Box 1).
Box 1 Proxies and correlation
The word proxy is used in various settings to mean a stand-in: representing someone or something else. One example is a proxy vote, where one person agrees to represent the voting intention of another person in the voting booth. In science, the word ‘proxy’ is used when scientists measure one, two or even several direct quantities and use these values to infer some other quantity they wish to know. This is an indirect method of measurement. It is possible for measurements of one quantity to represent another quantity when there is a relationship between the two. You can say that the quantity is a proxy, and that the measurements of the quantity are proxy data.
Take the following as an example:
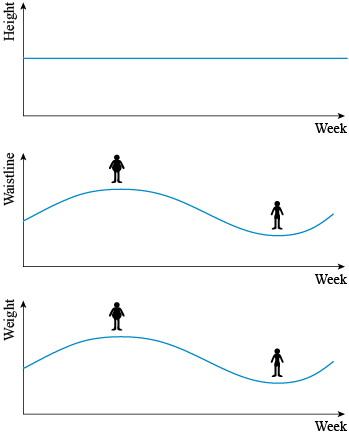
I measure my waistline, my weight and my height every week for a year, there will be a data set consisting of three variables measured 52 times over the course of a year. They are called variables because they are varying quantities; in this case, they vary with time. Typical results might be like those shown in Figure 12.
Because I have stopped growing, my height does not change throughout the year so, as in the top panel of Figure 12, the graph is a flat line. However, both my waistline and weight do vary. With my body shape, when my weight goes up it all goes onto my waistline, so the graph of my waistline and the graph of my weight vary in the same way. As my waistline gets bigger, I get heavier. The opposite also applies – when my weight goes down, my waistline reduces. Because my waistline and weight seem to vary together, you say the two variables are correlated. In this case, they are positively correlated because when my waistline gets bigger, so does my weight. If, for some strange reason, as my waistline got bigger my weight decreased (not a likely scenario!), then the two variables would be said to be negatively correlated.
Because my waistline is correlated to my weight, there is a mathematical relationship between the two variables. So, for example, it might be that when my waistline increased by 2 cm, I was 1 kg heavier. If I just gave you the data for my waistline over a year, and my starting weight, you could derive values for my weight over the whole year. This makes my waistline a proxy for my weight. If I then told you that I tended to eat more over Christmas and exercised a lot in the summer, then you could think it reasonable to add dates to the graphs in Figure 12. My weight and waistline would then be a proxy for the time of year as well.
It is important to understand that correlated variables do not tell you anything about the cause of the observation – they only tell you that the items vary in a particular way. In the example above, clearly the expansion of waistline is not the cause of weight changing – it is the result of it. A more extreme example of this is that the number of people in the British armed forces has decreased since the First World War, and at the same time global atmospheric temperatures have risen. While these two variables are negatively correlated, there is no physical mechanism for one influencing or controlling the other.
So, just because two things are correlated it does not necessarily mean that one causes the other, although in the case of the lead data there is an obvious causal link. What is perhaps not so obvious is that you cannot be sure just by looking at a graph whether two variables are correlated.
To be sure that the observations do show correlation, scientists use formal statistical tests. The details of these are beyond the scope of this course, but they are essential in scientific investigation. In principle, statistical tests use mathematics to tell the likelihood that the results you see occur just by chance. If the mathematics suggest that the results are indeed just chance, you cannot draw any conclusions from them. If, however, the likelihood of it being just a chance relationship is very small, then you can assume that there really is some robust relationship between the two.
To use one item as a proxy for others, you therefore need first to be sure that there really is a correlation, according to accepted scientific standards. Observing a correlation should also lead you to look for a plausible mechanism whereby one item affects the other. In the example of temperature and service personnel given above, such a mechanism is almost totally implausible. Even if the correlation were statistically acceptable, its implausibility would lead a scientist to reject it as being due to chance.
Activity 5 Proxy variables
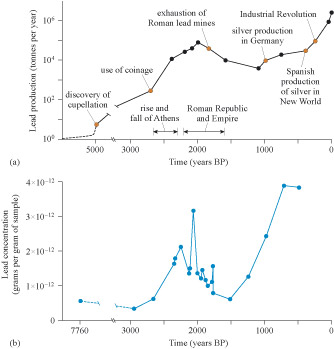
Do the data in Figure 11 suggest that lead production and the concentration of lead in ice cores are correlated, so that one could be used as a proxy for the other?
Answer
Yes, they do appear to be correlated as the values rise and fall together. There is also a direct physical link between the two items, so it might be acceptable to use one as a proxy for the other.
The example in Activity 5 shows that some measurements can be direct or a proxy, depending on the question of interest. If you wish to know about lead dust concentrations in Greenland ice in the past, you can measure them directly from the lead dust trapped in ice cores. If you wish to know about global lead production in the past, you can try to use measurements of lead concentrations in Greenland ice cores as proxy data, as long as you can estimate the relationship between the two.