
3.5 Interglacial periods and sea levels
The EPICA ice core is a record of temperature variations in Antarctica, but what was happening in the rest of the world? Temperatures in other areas varied in a similar pattern of cycles. Other proxy data, such as from sediments found at the bottom of the oceans and lake beds, and the dating of rocks and analysis of ice cores from high-altitude mountain glaciers, show that during the cold periods a large proportion of the northern hemisphere was covered by an ice sheet that was, in places, several kilometres thick. Glaciers advanced, eroding valleys and mountains, and northern hemisphere wildlife moved south to more temperate regions. At the lowest temperatures the ice sheets covered about 10% of the entire planet – up to 30% of all the land. This meant sea levels were very much lower than today, so the area of exposed land was larger. Figure 14 shows how different the ice sheets and coastlines were.
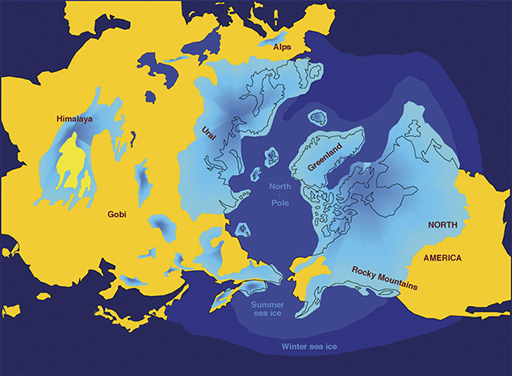
The sea froze as far south as the northern Spanish coast, and almost all of Britain was buried beneath the ice. These periods are called the ice ages. A vast quantity of water was locked in these ice sheets, so sea level was as much as 120 m lower than today, and there was dry land between Britain and the rest of Europe. During times between these cold periods, the ice sheets melted and the water from land ice meant that sea levels rose. These are called interglacials.
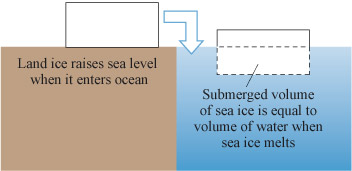
Note that it is only the melting of land ice that changes sea levels: melting sea ice does not change the sea level. Recall that ice is less dense than water, so it floats. As sea ice melts, it forms a smaller volume of water than the volume of ice. In fact, the volume of water formed is exactly the same as the volume of ice that was below the water surface when it was floating, so no change in sea level occurs (Figure 15). Of course, when ice on the land melts and flows into the seas, this does raise sea levels.
What would happen to the size of the Arctic, as has been defined in this course, during an ice age?
Answer
During an ice age, because the planet was colder and ice covered so much land, the treeline – our proxy for the Arctic definition – was much further south than today. This means that the area of the Arctic would have been much larger than at present.
Activity 6 Rates of change of temperature
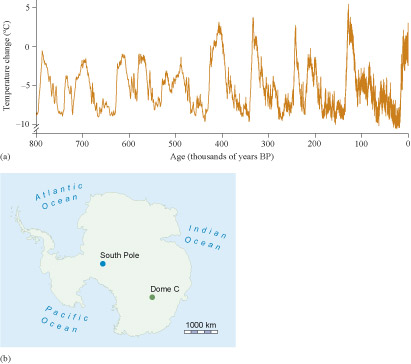
Look carefully at the Antarctic temperature record in Figure 13(a). Are there any general observations you can make about the rates of change of temperature between the relatively warm and relatively cold periods?
Answer
The record in Figure 13(a) shows that the temperatures fall relatively slowly but rise relatively quickly – particularly in the most recent 450 000 years.
Assuming (correctly) that the timing of Antarctic temperature changes is a proxy for the timing of changes in the amount of ice on the planet, the ice sheets in Figure 14 took about 100 000 years to grow, and yet they rapidly decreased in size – typically in only approximately 10 000 years. Consequently, sea levels fall slowly as the ice sheets grow, and rise relatively quickly as they decay again. The obvious question from Figure 13 is what causes these regular fluctuations in temperature and ice cover. One of the most influential is the Milankovitch cycles of the Earth’s orbit. You will look at this in more detail next.